Gold in Focus: Tight Range Before Major US Data 🌐 Gold in Focus: Tight Range Before Major US Data – Time to Prepare for the Storm?
Gold (XAU/USD) is currently trapped within a narrow consolidation zone, with traders across global markets awaiting critical economic events in the second half of this week. The bounce from the 3290–3270 support zones confirms strong buying interest, yet bulls seem cautious ahead of the ADP employment report today and the all-important Nonfarm Payrolls (NFP) on Friday.
Despite dovish signs from recent labor data and declining US bond yields, gold has not been able to regain strong upward momentum. This hesitance is attributed to mixed market sentiment fueled by ongoing US-China trade negotiations, potential interest rate outlook shifts from the Fed, and end-of-month positioning across major asset classes.
💼 What’s happening behind the scenes?
US 10Y yields dropped, signaling weaker inflation outlooks — usually bullish for gold.
DXY remains fragile but still attracts safe-haven inflows amid global political tensions.
Investors are cautious ahead of back-to-back economic events and might delay large trades until Friday.
With a bank holiday looming in Asia and Europe tomorrow, liquidity could tighten and amplify volatility. Gold might continue trading in a compressed range between 3274–3357 until NFP injects a fresh directional impulse.
🔍 Technical Roadmap:
🔺 Resistance Levels to Monitor:
3328
3336
3352
3357
3366
🔻 Support Levels to Watch:
3305
3292
3274
📌 Trade Strategy (30m–1H timeframe bias)
🔵 BUY ZONE A
📍 Entry: 3292 – 3290
🎯 SL: 3287
🎯 TP: 3295 → 3300 → 3304 → 3308 → 3315 → 3320
🔵 BUY ZONE B
📍 Entry: 3275 – 3273
🎯 SL: 3268
🎯 TP: 3280 → 3284 → 3286 → 3290 → 3300
🔴 SELL ZONE A
📍 Entry: 3350 – 3352
🎯 SL: 3356
🎯 TP: 3345 → 3340 → 3336 → 3332 → 3320
🔴 SELL ZONE B
📍 Entry: 3365 – 3367
🎯 SL: 3371
🎯 TP: 3361 → 3357 → 3352 → 3347 → 3340
📣 Final Thoughts:
We are in the "calm before the storm" phase. Price is coiling in tight ranges with declining volume and momentum. Today's ADP report could trigger intraday volatility, but major players may still remain on the sidelines until Friday's NFP.
As it’s also the last day of the month, be alert for liquidity grabs and potential stop hunts. Stick to your risk management plan and avoid revenge trades in volatile setups.
🛡️ Stay patient. Trade smart. Let the market reveal the direction.
Gold

Gold weakens under pressure from USD and bondsOn the morning of April 30, the world gold price fell to 3,318 USD/ounce, down 20 USD compared to the same time the previous day. The strong increase in USD and high US bond yields at 4.23% made gold lose its appeal in the eyes of investors.
The recovery of US stocks and the decline in oil prices further depressed market sentiment. On the H4 chart, gold has not yet escaped the sideways zone around EMA34 - a sign that buying power is weakening.

Gold starts to fluctuate at a high level, will it fall or rise iFrom the 4-hour chart of gold: From the above chart, the current trend may be a convergent triangle consolidation, with the high point gradually moving down and the low point gradually moving up. When the space can no longer be expanded, a breakthrough in a certain direction will be obtained. At present, the upper track is at 3344 and the lower track is at 3273. It may not be able to completely touch the upper and lower tracks, but there is a certain support or pressure performance near them; now the key middle track has been lost again, under pressure at 3315, and there is still a chance to explore and approach the lower track tonight; from the hourly chart: the trend of the Asian session in the past few days has been relatively smooth, with better continuity. Once it reaches the European session, it is a volatile oscillation back and forth; the current 3330 line is today's Feng Shui Ridge. If it can withstand pressure here, there is still room for a second exploration.
On the whole, the short-term operation strategy of gold today is recommended to sell on rebounds as the main strategy, and buy on pullbacks as the auxiliary strategy. The short-term focus on the upper side is the 3330-3340 line of resistance, and the short-term focus on the lower side is the 3300-3290 line of support.
Buying range: 3302-3300, SL: 3290, TP: 3320-3335
Selling range: 3333-3335, SL: 3345, TP: 3320-3315
Key points:
First support: 3300, second support: 3295, third support: 3290
First resistance: 3330, second resistance: 3335, third resistance: 3345

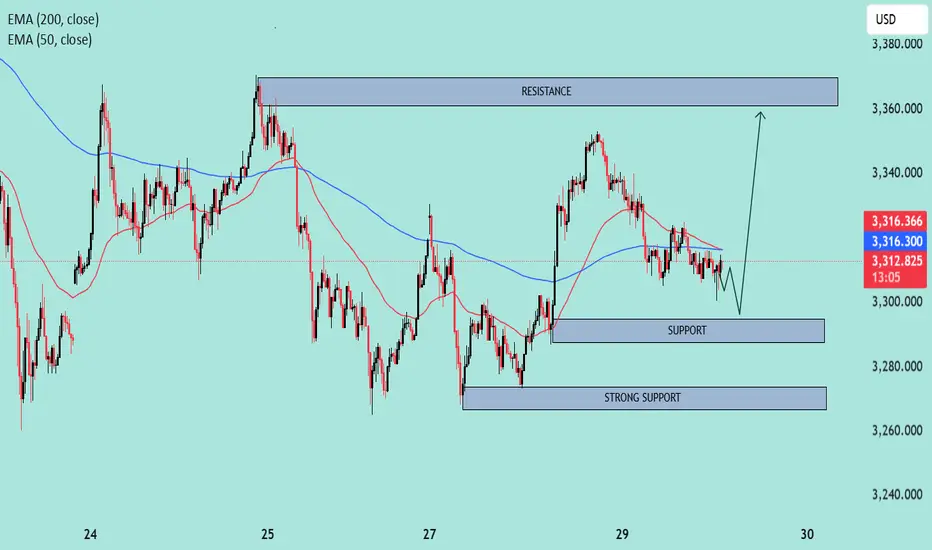
XAUUSD – Bullish Reversal Setup Near Support🟦 Chart Context:
Type: Intraday (likely 15m or 1h timeframe).
Indicators Used:
EMA 50 (Red): 3,316.497
EMA 200 (Blue): 3,316.332
Current Price: 3,312.650
🔍 Technical Analysis:
1. Trend & Moving Averages:
EMA Crossover (Bearish): The 50 EMA is slightly above the 200 EMA, but both are flat and converging, suggesting a neutral to slightly bearish short-term sentiment.
Price below both EMAs indicates bearish pressure in the immediate term.
2. Key Zones:
Resistance Zone: 3,355 – 3,370
Price was previously rejected from this zone, indicating strong supply and likely sell orders.
Support Zone: 3,295 – 3,305
Price has bounced here multiple times, suggesting active buyers.
Strong Support: 3,265 – 3,275
A broader and more historically respected area that could lead to a significant reversal if tested.
3. Price Action:
Currently forming lower highs and lower lows, which is a classic sign of short-term weakness.
A small descending triangle appears to be forming near the support level (bearish bias), but the drawn forecast suggests a potential fakeout breakdown followed by a bullish reversal.
4. Expected Scenario (as per chart projection):
Price might dip briefly into the 3,295–3,305 support, triggering liquidity grab (stop hunts).
A potential bullish rally towards the 3,355–3,370 resistance zone is expected.
This suggests a buy-the-dip strategy near support with tight risk management.
📈 Trade Outlook:
🟢 Bullish Bias:
If the support at 3,295–3,305 holds and price reclaims the 200 EMA convincingly.
Target: 3,355–3,370 resistance zone.
🔴 Bearish Bias:
If price breaks below the strong support (3,265), expect continuation lower.
Downside targets would then extend towards 3,240–3,250.
✅ Conclusion:
Current bias: Neutral to short-term bearish unless the lower support holds.
Key action zone: Watch price reaction around 3,295.
Strategy suggestion: Monitor for a bullish reversal signal at support; avoid chasing trades in the middle of the range.
GOLD Buy Setup by KechFx📈 GOLD Buy Setup by KechFx
This script highlights a bullish opportunity on GOLD/USD based on technical structure and price reaction.
🔹 Entry Zone: 3314.804
🔺 Stop Loss: 3298.768
✅ Take Profit: 3340.247
📌 The idea is based on price respecting a demand zone and forming a potential bullish move towards a key resistance level. Ideal for traders looking to follow momentum with a well-defined risk-reward ratio.
Use this script to track the setup and align with the potential upward move!

Gold - Just Half Way To The Target!Gold ( TVC:GOLD ) still has a lot more upside potential:
Click chart above to see the detailed analysis👆🏻
Over the past couple of months, we saw an almost incredible breakout rally of about +75% on Gold. However, looking at technicals, there is a quite high chance that Gold will actually rally even more and retest the next upper resistance trendline, which would mean another pump of about +75%.
Levels to watch: $4.000
Keep your long term vision,
Philip (BasicTrading)

XAUUSD: Bearish towards the previous High.Gold is bullish on its 1D technical outlook (RSI = 61.142, MACD = 87.300, ADX = 39.603) but has found itself on a short term correction since last week's High. All prior short term pullbacks have tested the High that preceded them. This gives a clear bearish TP = 3,175. It is possible for the market to also make contact with the 1D MA50 there, which has been intact as a Support since January 7th.
See how our prior idea has worked out:
## If you like our free content follow our profile to get more daily ideas. ##
## Comments and likes are greatly appreciated. ##

Gold (XAU/USD) Takes a Breather – Is a Breakout Brewing?Gold remains in a tight consolidation on the 4-hour chart after its historic run to $3,431. Price is trapped in a clear rectangle between ~$3,280 and ~$3,360:
📦 Sideways range suggests indecision after the massive bull run
🔵 50 SMA holding as dynamic support
📉 MACD is flat but trying to cross higher
📊 RSI hovering near neutral at 50 – neither overbought nor oversold
Watch for a break above $3,360 to reignite bullish momentum toward record highs. A break below ~$3,280, however, could signal deeper mean reversion toward trendline or the 200 SMA near ~$3,140.
Patience is key — the next move could set the tone for May.
-MW

GOLD → Consolidation ahead of news. What to expect?FX:XAUUSD is consolidating. Focus on 3370 - 3269. Economic data is expected tomorrow, and gold is likely to trade within the consolidation range for several days.
Optimism about US trade talks with key partners boosted risk appetite and supported the dollar. The US Treasury Secretary reported progress with India, while President Trump softened his rhetoric on China, which also strengthened the dollar. At the same time, traders took a wait-and-see stance ahead of the release of US GDP data for the first quarter. If the figures turn out to be weak, gold could rise sharply as a safe-haven asset. Thus, the gold market remains sensitive to trade news and macro data, especially against the backdrop of rebalancing at the end of April.
At the moment, as part of the current momentum and correction, I expect prices to recover from the 0.5 - 0.7 Fibonacci zone. Gold may test 3323-3325 before resuming its correction within the consolidation.
Resistance levels: 3323, 3352, 3370
Support levels: 3290, 3270
Traders are waiting for a resolution in the tariff dispute as well as economic data due tomorrow. However, while the price is consolidating, I expect a rebound from support. BUT! If the price continues to squeeze towards any boundary, with priority to support, then the chances of a breakout from the consolidation base may increase.
Best regards, R. Linda!

Analysis of the latest gold market trend on April 29:
1. Current market structure: wide range of fluctuations, direction to be broken
Key range: 3260-3338 (recently tested the upper and lower edges many times, no effective breakthrough).
Fierce long-short game:
3260-3270 (multiple bottoming rebounds, strong support area).
3336-3340 (recent high resistance, breakthrough opens up the upward space).
3370 (mid-term long-short boundary, head and shoulders right shoulder pressure).
2. Technical signal analysis
4-hour chart shock pattern:
If it stands firm at 3336 → it may continue to rebound and test 3352-3370.
If it falls back under pressure at 3336 → look down to 3278-3260, and if it falls below, it will open the downward space to 3225-3200.
Key patterns:
Head and shoulders top prototype: If the right shoulder is formed at 3370, the risk of medium-term shorting will increase.
Fibonacci support: 3225 (50% retracement), 3200 (psychological barrier).
3. Today's operation strategy
(Use 3336 as the dividing line, flexibly switch between long and short positions)
Short opportunity (main idea)
Entry conditions:
Price stagnation at 3336-3340 (such as reversal signals such as long upper shadow and engulfment on the K-line).
Target: 3278 → 3265-3260 (add positions after breaking through to see 3225).
Stop loss: above 3352 (to prevent false breakthroughs).
Bull opportunity (auxiliary idea)
Entry conditions:
Retracing to 3270-3260 and stabilizing (quick rebound or lower shadow confirmation).
Target: 3336 → 3352 (reduce position after breakthrough).
Stop loss: below 3255 (strict risk control).
4. Key risk reminder
Fake breakthrough risk: The recent volatility is drastic, and it is necessary to observe whether the breakthrough of 3336 and 3260 is accompanied by large volume.
The dollar and the news: Federal Reserve policy expectations and geopolitical situations may cause sudden fluctuations.
5. Summary
Volatile market → Sell high and buy low, strictly stop loss.
Breakthrough strategy:
Break above 3336 → Go long on the retracement, look at 3370.
Break below 3260 → Go short on the rebound, look at 3225-3200.

GOLD ROUTE MAP UPDATEHey Everyone,
Another great day on the charts with our analysis playing out perfectly.
After completing our bearish target yesterday, we stated that we would now look for a test at 3344 to complete our Bullish target and then a cross and lock will open the level above or failure to lock above will follow with a rejection into the lower Goldturns.
- This played out perfectly. We got the 3344 target hit, as analysed, followed with no cross and lock above 3344 confirming the rejection into the lower Goldturns just like we stated.
3306 Goldturn provided the support and bounce and if this levels holds, we will see a retest above or a further cross and lock below will open the lower Goldturns.
We will keep the above in mind when taking buys from dips. Our updated levels and weighted levels will allow us to track the movement down and then catch bounces up.
We will continue to buy dips using our support levels taking 30 to 40 pips. As stated before each of our level structures give 20 to 40 pip bounces, which is enough for a nice entry and exit. If you back test the levels we shared every week for the past 24 months, you can see how effectively they were used to trade with or against short/mid term swings and trends.
The swing range give bigger bounces then our weighted levels that's the difference between weighted levels and swing ranges.
BULLISH TARGET
3344 - DONE
EMA5 CROSS AND LOCK ABOVE 3344 WILL OPEN THE FOLLOWING BULLISH TARGETS
3367
POTENTIALLY 3390
EMA5 CROSS AND LOCK ABOVE 3390 WILL OPEN THE FOLLOWING BULLISH TARGET
3428
EMA5 CROSS AND LOCK ABOVE 3428 WILL OPEN THE FOLLOWING BULLISH TARGET
3458
EMA5 CROSS AND LOCK ABOVE 3458 WILL OPEN THE FOLLOWING BULLISH TARGETS
3478
POTENTIALLY
3503
BEARISH TARGETS
3306 - DONE
EMA5 CROSS AND LOCK BELOW 3306 WILL OPEN THE RETRACEMENT RANGE
3285 - DONE
3259
EMA5 CROSS AND LOCK BELOW 3259 WILL OPEN THE SWING RNGE
3233
3201
EMA5 CROSS AND LOCK BELOW 3201 WILL OPEN THE SECONDARY SWING RANGE
SECONDARY SWING RANGE
3159 - 3112
As always, we will keep you all updated with regular updates throughout the week and how we manage the active ideas and setups. Thank you all for your likes, comments and follows, we really appreciate it!
Mr Gold
GoldViewFX

GOLD (XAUUSD): Market Outlook & Short Update
Regarding Gold.
I received multiple requests to provide the update after
the price bounced to a target level, as I predicted earlier on Sunday.
At the moment, we see a perfect example of a consolidation.
The price is trading within a horizontal parallel channel - range.
As always, the market will most likely continue staying within that till the release
of important high impact news.
The closest ones we can find in the economic calendar.
Tomorrow we are expecting US GDP and Personal Spending Data.
For now, probabilities will be high that a consolidation will continue.
Consider looking for trading opportunities from the boundaries of the range.
After a news release, a breakout of the range will provide a strong confirmation
and accurately indicate the future direction of the market.
❤️Please, support my work with like, thank you!❤️
I am part of Trade Nation's Influencer program and receive a monthly fee for using their TradingView charts in my analysis.

GOLD - WAVE 4 CORRECTION TO $2,800 (UPDATE)Gold still dipping lower as I said would happen during my video analysis. We've seen a 'BOS' on the 1H TF, followed by a retest, now we're hoping for a continuation to the downside.
But get ready to buy the huge, discounted dip back up📈

USD/JPY : Bull or Bear? Let's See! (READ THE CAPTION)Upon reviewing the USD/JPY chart on the daily timeframe, we observe that due to the sharp drop in the Dollar Index, the price has reached the 140.850 level. This decline was very strong and impulsive; however, as seen on the chart, the price has now approached a significant demand zone between 139.6 and 141. If the price manages to close and stabilize above this area, we can expect a further bullish move from this pair.
Please support me with your likes and comments to motivate me to share more analysis with you and share your opinion about the possible trend of this chart with me !
Best Regards , Arman Shaban

EUR/USD: Possible Fall Ahead? Let's See! (READ THE CAPTION)Upon reviewing the EUR/USD chart on the 3-day timeframe, we can see that following a sharp decline in the Dollar Index (DXY), the pair experienced a bullish move, reaching the 1.15 supply zone. If the price manages to stabilize and close below the 1.15–1.17 area, we can anticipate a further drop in EUR/USD to fill the created Liquidity Void (LV). This analysis will be updated accordingly.
Please support me with your likes and comments to motivate me to share more analysis with you and share your opinion about the possible trend of this chart with me !
Best Regards , Arman Shaban

Gold nears a big breaking pointGold prices have pulled back from the high reached on 22 April and, more importantly, are nearing a break from the recent period of consolidation. Gold is forming a descending triangle, which could provide clues about the direction prices will take.
Typically, a descending triangle is considered a bearish continuation pattern. In this instance, gold has been drifting lower along a downtrend formed intraday on 22 April. Gold is approaching this downtrend line again, having failed to break above it on two previous attempts. A break above this line would be bullish and may sharply increase gold prices, with initial resistance around $3,370 per troy ounce, followed by the recent highs near $3,470.
However, if the pattern is a descending triangle, gold may not break out above the downtrend line. Instead, it could break below support at $3,260, which currently forms the triangle's base. A break below this support could initially send gold back towards $3,210, although the larger risk is a more profound decline down to $2,975.
For now, however, gold is also finding support at its 10-day exponential moving average (EMA), representing another critical level. A breakdown is unlikely if gold can hold above this moving average. Conversely, if gold slips below the 10-day EMA, it could confirm a short-term shift in trend and indicate further downside potential. Additionally, the relative strength index (RSI) is signalling a potential momentum shift, dropping below 70 and showing signs of bearish divergence.
Written by Michael J Kramer, founder of Mott Capital Management
Disclaimer: CMC Markets is an execution-only service provider. The material (whether or not it states any opinions) is for general information purposes only and does not take into account your personal circumstances or objectives. Nothing in this material is (or should considered to be) financial, investment or other advice on which reliance should be placed.
No opinion given in the material constitutes a recommendation by CMC Markets or the author that any particular investment, security, transaction, or investment strategy is suitable for any specific person. The material has not been prepared in accordance with legal requirements designed to promote the independence of investment research. Although we are not specifically prevented from dealing before providing this material, we do not seek to take advantage of the material prior to its dissemination.

GOLD: Long Signal with Entry/SL/TP
GOLD
- Classic bullish formation
- Our team expects growth
SUGGESTED TRADE:
Swing Trade
Buy GOLD
Entry Level - 3313.0
Sl - 3305.4
Tp - 3327.9
Our Risk - 1%
Start protection of your profits from lower levels
Disclosure: I am part of Trade Nation's Influencer program and receive a monthly fee for using their TradingView charts in my analysis.
❤️ Please, support our work with like & comment! ❤️

HelenP. I Gold will continue to decline, breaking support levelHi folks today I'm prepared for you Gold analytics. After an extended bullish phase that pushed the price higher within an upward channel, the market has started to show signs of weakness. Initially, gold moved steadily from the lower support zone, climbing through the channel and forming higher highs. Each pullback was supported by the rising trend line, reinforcing the bullish sentiment throughout the move. However, after reaching the peak near 3570, the price sharply reversed, breaking the trend line and shifting the overall structure. Sellers took control, leading to a breakdown below the channel, and now the price is consolidating near the 3260 - 3285 support zone. Recently, Gold tested the trend line from below but failed to reclaim it, which signals strong resistance overhead. Currently, gold is trading around 3319, just above the lower boundary of the broken channel and inside the support zone. I expect a small upward correction, breaking the trend line, and then followed by a continuation of the downward movement. So that's why I set goal is 3200 points. If you like my analytics you may support me with your like/comment ❤️

SPY/QQQ Plan Your Trade For 4-29 : BreakAway in CarryoverToday's pattern is a Breakaway in Carryover mode.
That suggests today's price move will attempt to break away from yesterday's body range and may be somewhat similar to yesterday's price action.
I interpret this pattern as a potential breakdown (breakaway) attempting to possibly find support below 540.
Remember, we are moving into the May 2-5 Major Low cycle pattern - so price should attempt to move downward at this stage.
Gold and Silver are moving through a consolidated topping phase. Where price attempts to push higher through a series of tops. Ultimately, I believe Gold and Silver will make a big breakout move higher (above $3500, $35.00) and attempt to rally up - breaking the $4200+ level (eventually).
Bitcoin seems to be stalling, like the SPY/QQQ, near upper resistance (near the FIB 50% level).
I see this stalling as the markets searching for a trend.
As I keep saying, I have a hard time seeing any reason why the markets will rally to new ATHs in the current environment (except the possibility of pure speculation).
We need to see some real growth expectations for the markets to begin another big rally phase.
Right now, I'm looking for confirmation of my breakdown into the May 2-5 Major Bottom pattern. Let's see if that actually happens or not.
Get some.
#trading #research #investing #tradingalgos #tradingsignals #cycles #fibonacci #elliotwave #modelingsystems #stocks #bitcoin #btcusd #cryptos #spy #gold #nq #investing #trading #spytrading #spymarket #tradingmarket #stockmarket #silver

GOLD: The Market Is Looking Down! Short!
My dear friends,
Today we will analyse GOLD together☺️
The price is near a wide key level
and the pair is approaching a significant decision level of 3,314.09 Therefore, a strong bearish reaction here could determine the next move down.We will watch for a confirmation candle, and then target the next key level of 3,296.10..Recommend Stop-loss is beyond the current level.
❤️Sending you lots of Love and Hugs❤️

Gold - Warning #1 IssuedGold goes up forever right?
Not necessarily...
Our Team at Bullfinder-official has identified potential risk in OANDA:XAUUSD , issuing Warning #1.
Gold has been moving aggressively to the upside for some time now, hitting +116% since November of 2022.
Gold currently sits at $3,313 - And although this may not be the exact top of this run, we would like to note that current regions may warrant greater caution, and present greater levels of risk.
We're inspired to bring you the latest developments across worldwide markets, helping you look in the right place, at the right time.
Thank you for reading! Stay tuned for further updates, and we look forward to being of service along your trading & investing journey...
Disclaimer: Please note all information contained within this post and all other Bullfinder-official Tradingview content is strictly for informational purposes only and is not intended to be investment advice. Please DYOR & Consult your licensed financial advisors before acting on any information contained within this post, or any other Bullfinder-official TV content.

ETH/USDT : Bulls are coming back? (READ THE CAPTION)By analyzing the #Ethereum chart on the weekly (logarithmic) timeframe, we can see that after reaching the demand zone between $1400 and $1550, buying pressure increased significantly. Currently, Ethereum is trading around $1800, and I expect to see the next bullish wave soon. The potential upside targets are $1990, $2500, and $2600. This analysis will be updated accordingly!
Please support me with your likes and comments to motivate me to share more analysis with you and share your opinion about the possible trend of this chart with me !
Best Regards , Arman Shaban
Gold INTRADAY Key trading level at 3227Gold INTRADAY corrective pullback supported at 3227
Trade optimism is lifting market sentiment, with the US Dollar gaining strength and pulling investment away from safe-haven Gold. However, uncertainty lingers due to conflicting signals in US-China trade talks. While President Trump claims discussions are ongoing, China denies any tariff negotiations. At the same time, traders anticipate the Federal Reserve will restart rate cuts in June, with markets pricing in the likelihood of at least three cuts this year. These expectations could provide near-term support for Gold despite current headwinds.
Resistance Level 1: 3392
Resistance Level 2: 3457
Resistance Level 3: 3500
Support Level 1: 3227
Support Level 2: 3173
Support Level 3: 3130
This communication is for informational purposes only and should not be viewed as any form of recommendation as to a particular course of action or as investment advice. It is not intended as an offer or solicitation for the purchase or sale of any financial instrument or as an official confirmation of any transaction. Opinions, estimates and assumptions expressed herein are made as of the date of this communication and are subject to change without notice. This communication has been prepared based upon information, including market prices, data and other information, believed to be reliable; however, Trade Nation does not warrant its completeness or accuracy. All market prices and market data contained in or attached to this communication are indicative and subject to change without notice.
