GOLD / XAUUSD: Breaking the down channel (correction wave)Therefore, if the 21-day SMA holds in the event of a weak US Non-Farm Payroll (NFP) report, a rebound toward the immediate static support-turned-resistance at 3260 could occur.
A sustained move above that level would encourage Gold buyers to push further toward the former channel support, now acting as resistance, at 3405.
Goldlongterm

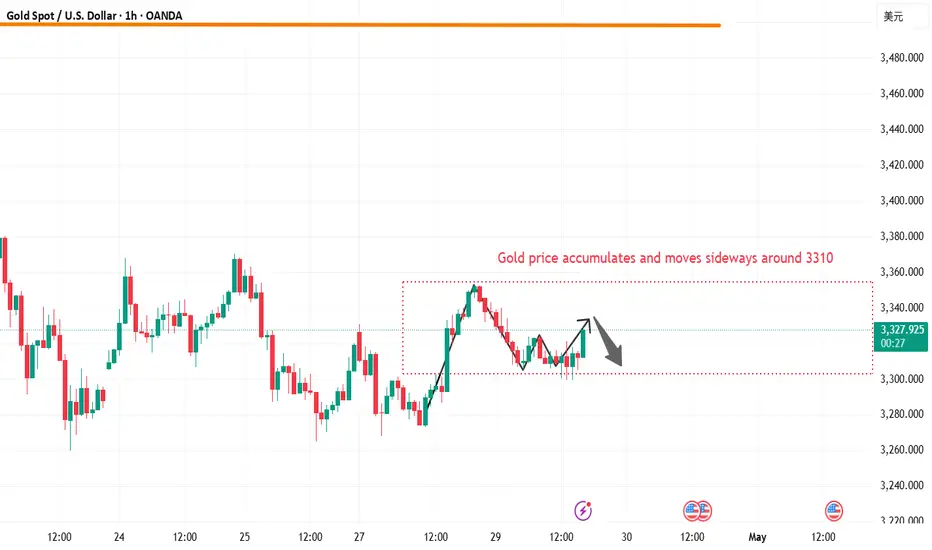
Gold bulls are back in force. What is the operation strategy?The gold price has reached the sideways fluctuation range expected by Quid. This matches my morning prediction.
From the 4-hour trend:
Gold has now broken through the first upward resistance level predicted by Quid, and is currently fluctuating slightly in the 3315-3320 range.
The current upward resistance position is around 3330. The lower support is currently located at 3275-85. If gold does not retreat, then the upward trend may test the position around 3350.
On the contrary, if gold chooses to retreat, traders need to pay attention to the 3275-3285 decline range.
Quid believes that as long as gold retreats and stabilizes in the 3275-3285 range, then a long operation strategy can be carried out at this position.
The current upper high is still at 3350. If the upward resistance level of 3350 is broken later, I expect the price of gold to reach a height of 3380-3420.

Gold fell as expected. What will happen next week?Gold fell within the range expected by Quid. Although it rebounded slightly, the final result did not change. Will the direction of gold change next week?
Quid's analysis:
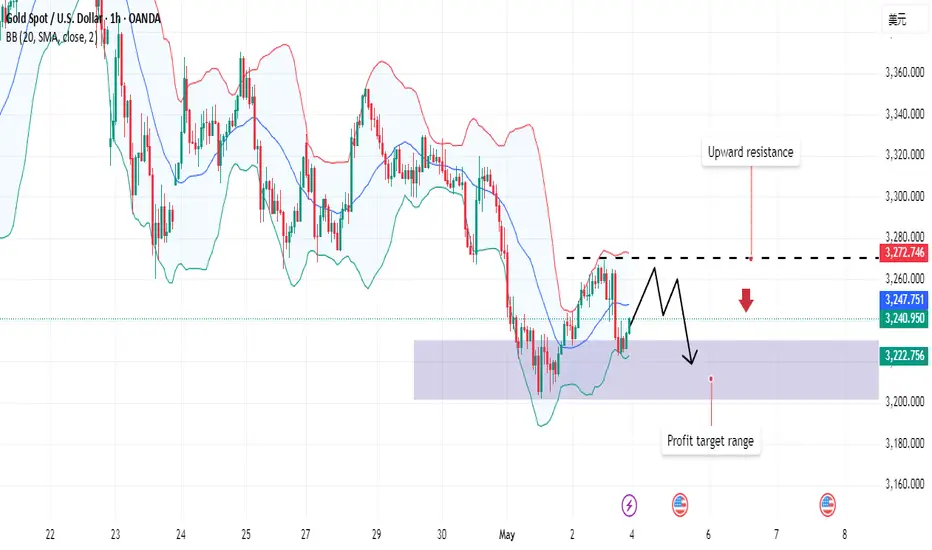
Gold's 1-hour moving average is downward, and there is a trend of continuous downward development; gold is currently under pressure from the 3270 line, so 3270 will still be the key turning point for gold bears next week. Although gold has rebounded slightly, the magnitude of the decline is not large; if the upward resistance level of 3270 fails to break through next week, it may be in a sideways fluctuation.
The downward trend will not reverse for the time being, unless major news is released on the weekend, which directly affects the gold market.
Quid believes that the ups and downs of the market are normal. Gold has fallen by about $300 from its high point, and the overall trend in the near future is still downward; it continues to fall after a small rebound, which means that the strength of gold bears is still there.
Quide believes that it is always easy to follow its trend; violating its rules always makes oneself exhausted; the market is always right, and standing on the opposite side of the market will always be taught a lesson by the market. In the face of the overall trend, traders should not be lucky, and the market will not forgive your mistakes again and again.
Operation strategy:
Short around 3270, stop loss at 3280, take profit around 3220;
As expected, gold prices continue to fall
📌 Gold driving factors
There are two aspects to look at the impact of April non-agricultural data on the gold market.
One is the data itself and the existing economic environment, and the other is combined with the technical aspect.
The market itself is troubled by the tariff issue. Whether it is the US stock market or the US dollar, they all need good economic data to boost. Once the April non-agricultural performance is poor, the market sell-off will be out of control, and it also means that the risk of US economic recession will increase.
Secondly, good data performance reduces the Fed's expectations for rate cuts. As we all know, the Fed's expectations for rate cuts or implementation of rate cuts are theoretically good for gold prices, and vice versa.
The cooling of the tariff issue may come soon, which is also not conducive to the rise in gold prices, but cooling does not mean the end, and the final achievement will definitely take some time.
📊Comment Analysis
Recently, we have been very good at controlling the gold market. Keeping an eye on the changes in fundamental news is the focus of research and judgment. Of course, the technical direction is also of reference value. The next market will revolve around fundamental news, especially in the context of tariffs.
The non-agricultural data exceeded expectations, and the tariff issue may see "dawn". If it can be confirmed in the near future, the risk aversion sentiment will subside in the short term, which is not conducive to the rise of gold prices. There is a high probability that there is room for retracement, so there is no rush to chase now.
💰Strategy Package
Operation ideas for next week:
Gold 3265 short, stop loss 3275, target 3230-3220;.
⭐️ Note: Labaron hopes that traders can properly manage their funds
- Choose the number of lots that matches your funds
- Profit is 4-7% of the capital account
- Stop loss is 1-3% of the capital account

Non-farm data is released, and gold is still going to fall.
📌 Gold information
Today, the market will usher in the heavy non-farm data for April. From the expected value, there are only 130,000 people, far lower than the expected 228,000 people, and the unemployment rate remains at 4.2%.
If we refer to the unsatisfactory ADP data in April, then the number of non-farm people in April should have declined, or it is lower than expected, but the ADP data cannot fully correspond to the final non-farm data. This is the answer given to us by too many experiences in the past, so it cannot be concluded that the non-farm data this time will be lower than expected.
📊Comment analysis
Combined with the technical aspect, the strong technical pressure above the international gold price is around 3280, and then the 3300 mark. Even if it rebounds next, the pressure of the above two prices cannot be broken, and there is still a probability of a pullback adjustment. The initial support below is 3230, and after breaking through the position, it will follow the trend to explore 3205.
💰Strategy Package
If today's non-agricultural data cannot provide strong support for gold prices, the rise in gold prices in the short term will be difficult to sustain. The specific decision can only be made after the final release of the afternoon data and the guidance on prices. The trend fluctuations tonight will be very intense. Remember to strictly control your positions to prevent risks.
⭐️ Note: Labaron hopes that traders can properly manage their funds
- Choose the number of lots that matches your funds
- Profit is 4-7% of the fund account
- Stop loss is 1-3% of the fund account

NF shows a volatile downward trend
📌 Gold Information
China's Ministry of Commerce announced on Friday that the United States has recently initiated communication through official channels, expressing interest in restarting tariff negotiations. Beijing is currently evaluating the proposal, which has sparked optimism that a solution to the long-standing tariff deadlock between the world's two largest economies is imminent.
New hopes for a breakthrough in trade negotiations helped the dollar rise to a three-week high on Thursday, pushing gold prices down towards the $3,200 mark. However, the dollar's bullish momentum remains weakened as the market increasingly digests expectations that the Federal Reserve may cut interest rates further, especially with the closely watched US non-farm payrolls data about to be released.
📊Comment Analysis
NF news volatility is certain, having accumulated significantly since last week. Gold price confirmed the trend after breaking through 3267, and fluctuated downward below 3200
💰Strategy Package
TP1: $3290
TP2: $3280
TP3: $3270🔥
Buy gold area: $3175 - $3177 SL $3170
TP1: $3185
TP2: $3200
TP3: $3210⭐️
⭐️ Note: Labaron hopes that traders can properly manage their funds
- Choose the number of lots that matches your funds
- Profit is 4-7% of the fund account
- Stop loss is 1-3% of the fund account

Technical analysis of short-term gold operations!!!On Wednesday, the gold price generally showed a downward trend. The highest price rose to 3327.91 on the day, and the lowest price fell to 3266.79, closing at 3288.16. In view of the fact that gold fell under pressure during the early trading on Wednesday and broke through the four-hour and daily support as expected, and then the US market rebounded again and came under pressure, and finally ended in a big negative state at the daily level. The price has fallen below the daily support, so we need to pay attention to the continuation of the band decline in the future.
From a multi-cycle analysis, first observe the monthly rhythm. The price rose for three months in the early stage and then a single-month correction appeared. Recently, it has risen for four months and then a single-month correction appeared. Therefore, according to the rhythm, four consecutive positives have appeared. For May, we must pay attention to market risks. From the weekly level, the gold price is supported by the support level of the 3040 area. From the perspective of the medium-term, we can continue to maintain a bullish view, and the price drop is only a correction in the medium-term rise. From the daily level, the current price resistance is in the 3007 area, which is the key watershed of the band trend. If the price is below this position, the subsequent band will be treated as short. At the same time, for the short-term four-hour price resistance, it is around 3290, so the subsequent price will be treated as short under the four-hour resistance. In general, the price can be treated as short under the four-hour resistance and the daily resistance.

Gold 3213 and 3272 are space switching points
📌 Gold information
The US non-farm payrolls report released this Friday (May 3) will become a market vane. If the employment data deteriorates significantly (such as the sharp drop in private employment growth shown by ADP), it may strengthen the expectation of interest rate cuts and promote the rebound of gold; on the contrary, if the data is stable, the US dollar may further suppress the price of gold.
The intraday decline in gold prices seems to be partly driven by technical selling pressure, after gold prices decisively fell below the key support level of $3,265-3,260. However, due to the unexpected contraction of US GDP and the intensification of signs of slowing inflation, the market's expectations for further interest rate cuts by the Federal Reserve (Fed) have increased, and the US dollar (USD) has found it difficult to maintain any significant rebound.
📊Comment Analysis
Gold price rose strongly by $544 in April. It entered the mode of space sweeping and adjustment from the confirmation of 3500. The next move is to sweep the range of the large range, starting at at least $40, and the range is $100, sweeping back and forth
💰Strategy Package
🔥Sell gold area: 3270-3272 SL 3277
TP1: $3260
TP2: $3250
TP3: $3240
🔥Buy gold area: $3178 - $3176 SL $3171
TP1: $3185
TP2: $3200
TP3: $3210
⭐️ Note: Labaron hopes that traders can properly manage their funds
- Choose the number of lots that matches your funds
- Profit is 4-7% of the fund account
- Stop loss is 1-3% of the fund account

Gold is forming a head and shoulders pattern!Analysis and interpretation:
Gold prices have been on a strong upward trend since the beginning of 2025. The daily chart shows that gold prices have climbed from around $2,600 to around the $3,500 mark. Recently, gold prices have formed a consolidation trend in the range of $3,260 to $3,380, indicating that the bulls and bears are fighting fiercely here. It can be seen from the K-line chart that gold prices fell back after hitting a record high of $3,499.83 in April, but then gained support and rebounded at $3,260.
The Bollinger Band indicator shows that the upper track is at $3,465.75, the middle track is at $3,191.92, and the lower track is $2,918.08. The current price is running between the upper and middle tracks, indicating that the medium-term upward trend is still maintained. Although the gold price may fluctuate in the range of $3,260 to $3,380 in the short term, the overall upward trend has not changed.
The MACD indicator shows that DIFF is 81.35, DEA is 84.74, and the MACD value is -6.80. The histogram shows a shrinking state, indicating that the upward momentum has weakened, but no obvious short signal has been formed. The RSI indicator is around 58.81, which is in the neutral to strong area, and has not reached the overbought or oversold level, and there is still room for growth.

XAU/USD(20250430) Today's AnalysisMarket news:
The European Central Bank expects prices to rise 2.9% over the next 12 months, up from 2.6% in February, according to a monthly survey released on Tuesday. This is the highest level since April 2024. The three-year indicator rose slightly to 2.5%. The ECB's first five-year forecast was 2.1%.
Technical analysis:
Today's buying and selling boundaries:
3321
Support and resistance levels
3370
3352
3340
3303
3291
3273
Trading strategy:
If the price breaks through 3321, consider buying, the first target price is 3340
If the price breaks through 3303, consider selling, the first target price is 3291

Gold falls as expected, awaiting guidance from ADPGold continued to fluctuate in 1 hour. Now, the gold fluctuation is most likely a relay of decline. Gold rebounds and continues to be short. The gold 1-hour moving average gradually begins to stick together, but it is still diverging downward. If it continues to cross downward to form a dead cross, then there is still room for gold shorts to fall. Gold hit a high twice and was suppressed by the 3330 line. Today, gold continued to be short at highs under the pressure of 3330.
Gold bulls continue to rebound every time. Now gold bulls obviously have no confidence in further rise, so gold shorts take the opportunity to exert their strength. Gold is still the home of shorts, and gold rebounds and continues to be short.
US trading operation ideas:
Gold 3320 short, stop loss 3330, target 3300-3290;

Gold fluctuates and is bearish, waiting for NF
📌 Policy factors
Gold prices (XAU/USD) continued to fall, falling to $3,310 in the current European session on Wednesday, as signs of improved global risk sentiment and easing trade tensions curbed demand for safe-haven assets. Market participants remained cautious ahead of the release of major US economic data, including ADP employment changes, core PCE price index and first quarter GDP preliminary values, all of which are scheduled to be released later today.
It is reported that President Trump suddenly signed an executive order to provide automakers with up to 15% tariff rebates to ease the impact of his auto tariff policy. Even more unexpectedly, US Commerce Secretary Lutnick revealed that a trade agreement had been reached secretly with a certain country. These major changes immediately triggered a strong market reaction.
📊Comment Analysis
Gold price maintains the accumulation range of 3265-3360, temporarily stable and waiting for large fluctuations
💰Strategy Package
🔥Sell gold area: 3368-3370 SL 3375
TP1: $3350
TP2: $3340
TP3: $3330
🔥Buy gold area: $3264-$3262 SL $3257
TP1: $3280
TP2: $3300
TP3: $3318
🔥Buy gold area: $3285-$3283 SL $3280 scalping
TP1: $3290
TP2: $3295
TP3: $3300
⭐️ Note: Labaron hopes that traders can properly manage their funds
- Choose the number of lots that matches your funds
- Profit is 4-7% of the capital account
- Stop loss is 1-3% of the capital account

Gold maintains a volatile range, pay attention to subsequent breOn Tuesday, the gold price generally showed a downward trend. The highest price rose to 3348.45 on the day, and the lowest price fell to 3299.49, closing at 3316.95. On Tuesday, gold was under pressure during the early trading session, and then the price continued to fluctuate during the European and US trading sessions. Overall, the price is still running within the fluctuation range, but once the daily support is broken, it is expected to break the lower edge of the range.
From the multi-cycle analysis, first observe the monthly rhythm. The price rose for three months before and then a single-month correction occurred. Recently, it has risen for four months and then a single-month correction occurred. Therefore, according to the rhythm, April is generally bullish, but for May, we must pay attention to market risks. From the weekly level, the gold price is supported by the support level of the 3040 area. So from the perspective of the mid-line, we can continue to maintain a bullish view. From the daily level, the current price is supported by the 3004 area support. This position is the key watershed of the band trend. The market will further break down in the future, so it will be focused on in the future. At the same time, for the short-term four-hour price, it has been fluctuating up and down at the four-hour key position recently. Pay attention to the resistance of 3387 and 3370 on the top, and the 3260 area on the bottom. Before the data, the market as a whole tends to fluctuate temporarily. After breaking through the daily support, pay attention to the performance of breaking down the lower edge of the range.

Shorting opportunities are coming near 3330 in the US market!
📌 Driving events
Because the easing of US-China trade tensions has weakened gold's safe-haven appeal, while investors are waiting for US economic data to assess the Fed's policy direction. Gold has been in a range recently as the market now waits for details of the first trade agreement, which is expected to be announced this week or next week.
📊Comment analysis
Gold reached a turning point last week, with Trump making some very positive comments, while stagflation risks continued to be excluded, and gold continued to fall. Stagflation pricing has driven gold prices higher, and as the market begins to exclude this risk, it is normal for a correction to occur, especially considering that "long gold" has become one of the most crowded trades.
💰Strategy Package
Short position:
Actively participate around 3330 points, profit target around 3300 points
⭐️ Note: Labaron hopes that traders can properly manage their funds
- Choose the number of lots that matches your funds
- Profit is 4-7% of the fund account
- Stop loss is 1-3% of the fund account
Gold's shock trend and interpretation of US market thinkingGold continues to fluctuate, we continue to look down in the European session, try long orders near 82;
2025-4-29 Tuesday Gold Asia-Europe long and short strategies
The market is always changing, the only constant is the existence of risks.
Keeping the principal is always the first principle.
◆Short order◆
Aggressive: short near 3356, stop loss 7 points, short at 62-68 after breaking,
Stop loss: stop loss 7 points each, or unified stop loss 77. Target: 3286-69-54-42, continue to reduce holdings after breaking
◆Long order◆
Aggressive: long at 82, stop loss 7 points, long at 75-70 after breaking,
Stop loss: stop loss 7 points each, or unified stop loss 62. Target: 98-06-12, continue to reduce holdings after breaking;
Steady: 66 long, stop loss 7 points, 58-52 long after breaking,
Stop loss: 7 points for each stop loss, or a unified stop loss of 42. Target: 98-06-12, continue to reduce holdings if the position breaks;
【Today's long orders must be promptly protected after profit, and the next position will be entered after the principal is protected】
Stop loss is determined according to your actual tolerance. Protect in time after profit, and enter the next position after protection】
★ Pattern analysis and attention:
Daily strategy ideas: Asia and Europe, our current price 06 long orders are also given to around 22 as expected. We are still bearish if the resistance is not broken, and try 82 long orders
【Reference: Russia-Ukraine peace talks, US-Japan tariff negotiations】
【Data: wholesale inventory rate, consumer confidence index, job vacancies】
☆ There is a delay in posting, and the final operation is based on real-time strategy and current price orders. Please continue to pay attention;
☆ Strategy orders are divided into warehouses, and the total position shall not exceed 20%;

Gold is still volatile, buy at 3298-3305 in the US market
📊Comment analysis
Gold prices need economic news to break through the sideways price range of around 3300. Today, continue to wait and see around 3310, waiting for the right time to enter the market in time.
💰Strategy package
Long positions:
💲Actively participate in gold around 3298-3305 points, with a profit target around 3320 points
Short positions:
💲Actively participate in gold around 3320-3330 points, with a profit target around 3303 points
💢Precise sniping, follow the trading strategy = easy money

Risk aversion eases, gold continues to fluctuateSpot gold prices (XAU/USD) fluctuated and fell, approaching the $3,300 mark, continuing the weak trend of the previous trading day.
From the daily chart, gold prices have fallen from their historical highs and are currently approaching the 38.2% Fibonacci retracement level (US$3,300-3,290). The key support level below is concentrated in the $3,265-3,260 range, which is also the previous consolidation range. If it falls below, it will open up the space for a 50% retracement level (US$3,225) or even $3,200.
In terms of technical indicators, the MACD indicator shows signs of a dead cross, and the green kinetic energy column expands moderately, indicating that short-term bears still have the initiative; the RSI indicator is still oscillating near the 50 axis, and has not yet shown extreme oversold, indicating that the downside space may be limited. Once the price rebounds, the initial resistance above is seen at $3,348-3,353.
After the breakthrough, it is expected to re-challenge the $3,400 mark, and even attack $3,425-3,427.
If the US PCE inflation and non-farm data weaken this week, it will further support the re-entry of gold bulls.

Interpretation of the short-term operation ideas of shopping4-hour trend will not hit the high point within this 4-hour period, so currently we can focus on the morning high point and yesterday's high point 3348-3353. Currently we can focus on the support near 3316.
First point: After the 4-hour high closed with a small positive column yesterday, a big negative column fell in the morning, indicating that the price will continue to bottom out in the short term. Therefore, we can arrange short orders below yesterday's high point 3353-3348 in the white session, so 3340-44 is the best shorting point.
Second point: Because the price rose to 3336 after yesterday's high of 3302 and only retreated to 3319, the support of 3316-17 still exists. The point we focus on in the Asian and European sessions is when 3316-17 will break.
Third point: In the event of an accident, the price directly pulls back and breaks the high point, then the next short position is 3370-72; I think this probability is small. Then if it breaks 3315-16, we need to find a low position to go long. Then 3300-3288 and 3273 in yesterday's Asian and European sessions are the long positions. We can use small stop losses to bet on long positions.
Strategy:
Short at 3340-44 during the Asian session, defend at 3353, target at 3330-3320, break at 3315 and target at 3300-3290
Short at 3370-72, defend at 3378, target at 3350
After breaking 3315, short at 3300-328-3276 with a small stop loss of 5-6 US dollars, target at 3305-3350-70

Gold fluctuates within a wide range, and may stop falling as it On Tuesday, gold trading relied on the 3310 support level to directly go long, and the near-point pressure area of 3360/80 was bullish. The long logic of gold as a "safe haven trump card" is beyond doubt. The small cycle adjustment is only the accumulation stage. Once it starts to explode, it will be unstoppable. Recently, when gold touched 3500 again, there was a market view of "suspected top". It is recommended that all investors maintain their composure-the short-term adjustment is insignificant compared to the entire rising cycle. This time, the price retreated from 3500 and corrected by about US$240, which is still within a reasonable range relative to the previous increase. It is emphasized again that it is not recommended for investors to be bearish on gold in the long term, or to subjectively determine that 3500 has become the top. Such psychology is prone to trading deviations and even breeds a dangerous mentality of short orders to bear losses, which is the root cause of long-term losses.
In the early trading of the day, a 3310 long strategy has been deployed, and it is suggested that 3315 can be entered into the long position during the trading session. The current position is in market fluctuations. The current uptrend will first focus on the recovery of the 3340/45 line, and the opening price pressure level should be paid special attention to, especially during the Asian and European sessions. If the Asian and European sessions maintain a shock correction pattern, the support level will continue to be relied on for game play; if the uptrend effectively breaks through 3340/45 and stabilizes, the handover period between the European and American sessions is expected to explode to the 3380 line, or even challenge a higher price range.

Gold is stuck in the 3300 area, when can it break through?
📊Comment Analysis
Gold prices need economic news to break through the sideways price range around 3300. Today, we will continue to wait and see around 3300, waiting for the right time to enter the market.
💰Strategy Package
Long positions:
💲Actively participate in gold around 3300-3310 points, with a profit target around 3330 points
Short positions:
💲Actively participate in gold around 3330-3340 points, with a profit target around 3310 points
💢Precise sniping, follow the trading strategy = lying down and making money

Gold prices bottomed out and rebounded, market trend analysis.Analysis of gold trend: From the perspective of market sentiment, interest-free gold as a safe-haven asset has performed strongly this year, with prices soaring by nearly $700 and hitting record highs several times. However, the recent optimistic expectations of easing global economic and trade relations have boosted market risk appetite, and the equity market has generally performed positively. Some funds have flowed out of safe-haven assets such as gold and turned to risky assets, which is also the main psychological factor under pressure on gold prices. If market risk appetite continues to improve, global economic and trade relations further ease, and the US dollar strengthens, gold prices may face greater downward pressure. From a technical point of view, the gold price needs to effectively fall below the $3,265-3,260 range in the short term before a larger correction downward may be confirmed. Once confirmed to fall below, the gold price may quickly fall to the 50% retracement level near $3,225, further pointing to the $3,200 mark. If $3,200 is lost, it will suggest that gold may have peaked in the short term.
Gold opened higher in the Asian session on Monday and continued to fall last week after hitting 3336. The idea of the Asian session was to directly bearish at the analysis point of 3277. After hitting the lowest point of 3268, it fluctuated upward. The European session also fell to 3273 and then rebounded. The highest point in the US session just reached 3336 again, a standard bottoming and rebounding trend. Since it is an adjustment structure, let's re-analyze the idea. The gold price fell at 3500 and rebounded at 3260 last Wednesday. The rhythm was volatile. It rebounded above 3260 many times below and did not cross the first rebound high of 3367 above.
Today, we mainly focus on the closing price. If it stands firmly at the 3313 line, we will adjust our thinking on Tuesday. On the contrary, it will fall back after encountering resistance at 3336, today's opening high, and go to 3278. On Tuesday, we will continue to look at the idea of swinging and falling. Now it is the end of the market, and the market is also falling from a high.

Gold is trying to break through the upward channelGold started the new week on a bad note, hitting a low of 3260 in the morning, followed by a small shock adjustment; then it began to rise sharply. As of press time, it has risen to around 3350 and tried to break through the upward resistance.
Although some of gold's safe-haven appeal has weakened, its overall forecast and price trend remain optimistic. Until we see clear lower highs, lower lows, and a solid trade agreement rather than more political bragging from the Trump administration, the possibility of gold setting new highs cannot be underestimated.
Surface calm hides potential risks
Although last week's market movements and today's early trading performance show that the market is calming down, any sense of security is fragile. Under the surface, key risks remain: trade tensions, recession concerns, and uncertainty about monetary policy are real. Ongoing trade negotiations remain a key factor. If the United States sticks to its position on tariffs or the negotiations break down, risk aversion may quickly pick up, boosting demand for gold again.
Quaid's analysis:
Based on last week's market situation, Quaid conducted an analysis of gold's trend this week over the weekend. As I predicted, gold is trying to break through and try a new high.
Gold has risen to around 3350, and 3365 is a key resistance level in the upward trend. If the gold price breaks through this position and can maintain horizontal development, it will continue to rise in a stable situation.
From the upside, the initial resistance level is $3365, followed by $3430. If the bullish momentum is restored, it may soon hit the historical high of $3500 again.
On the contrary, if the price fails to break through the 3365 resistance level, Quaid believes that it is necessary to pay attention to the key support at the 3285 position.

Gold market, further decline is likelyOANDA:XAUUSD Continue to test the support level of 3270 points, looking for a breakthrough. Any easing of the Sino-US conflict may trigger a price drop. But things are not so simple.
The Chinese Ministry of Foreign Affairs issued a statement: China and the United States have not discussed or negotiated on the issue of tariffs.
Gold prices are under pressure before the tariff war and the release of US data.
International situation: Russia issued a statement on a truce; and Ukraine issued a statement: If Russia really wants to achieve peace, it must immediately cease fire. If the two sides formally sign a truce agreement, the safe-haven demand for gold may also be greatly reduced.
In the morning, gold prices tested last week's low of $3260, and the strengthening of the US dollar and the possible easing of Sino-US trade risks put gold prices under pressure.
Traders are waiting for the release of key US GDP and labor market data, which may affect the Fed's interest rate expectations. In this context, if macro statistics are weak and geopolitical risks remain, the correction in gold prices may be replaced by growth.
Another test of the support level may trigger a breakthrough. It is necessary to pay attention to the situation between China and the United States. Any easing of the situation will trigger a decline in gold.
Upward resistance: 3300, 3325
Downward support: 3265, 3245, 3230
The possibility of further decline in gold prices has been exhausted since the opening. Gold prices may strengthen to the above resistance levels. A false breakout of 3300/3325 may trigger a decline, which may bring gold prices closer to the support level of 3270.
