Early Asian session. Latest market analysisIn early Asian session, spot gold rebounded slightly and is currently trading around $3,345/oz, supported by bargain hunting. The U.S. session continued its trend of retreating from record highs, falling nearly 3%, hitting a low of $3,260.08/oz and closing at $3,288.18/oz.
People familiar with the matter revealed that the Trump administration is considering reducing tariffs on imports from Asian powers, adding that any action would not be unilateral.
Quaid Analysis:
People are very relieved about the possibility of negotiations between major powers, and we are seeing this trend have a significant impact on the market.
Driven by central bank buying, tariff war concerns and strong investment demand, gold prices have risen by more than 26% since the beginning of 2025. A large number of long orders are facing profit-taking needs, and investors need to beware of the risk of further correction in gold prices.
From a technical perspective, gold prices hit $3,500, soared before this level, and then reversed sharply, which increases the risk of further correction in the short term.
The preliminary monthly rate of durable goods orders in the United States in March and the number of initial jobless claims in the United States for the week ending April 19 will be released on the Asian trading day. Investors need to pay attention to them. In addition, they need to continue to pay attention to the relevant news on the international trade situation and the geopolitical situation.
Action suggestions:
Go long at 3345, stop loss at 3340, watch 33380
If Quaid's analysis can help traders, then Quaid will be very happy.
Goldlongterm

Gold continues to pull back to the turning point!!!In the 4-hour chart, the price found support near the 3284 area (the recent swing low) and rebounded. Buyers stepped in at this position and set risk below this support level in an attempt to push prices higher again. Sellers hope that the price will fall below this level to push the price further down to the 3167 area.
1-hour chart
On the 1-hour chart, a short-term downward trend line can be seen, which is currently limiting the market's bullish sentiment. Sellers may establish positions near this trend line and set stops above the trend line with a target of 3167.

GOLD: Two Prominent Buying Areas to buy Gold From!Hey there! So, gold took a dip after hitting the $3500 mark, and it’s now at $3370. But here’s the thing, we think it might bounce back soon because it’s filled the liquidity gap. There are two possible points where it could turn around: right now or at $3330. Keep an eye on it and trade safely! Good luck!
Thanks for your support! 😊
If you want to help us out, here are a few things you can do:
- Like our ideas
- Comment on our ideas
- Share our ideas
Team Setupsfx_
❤️

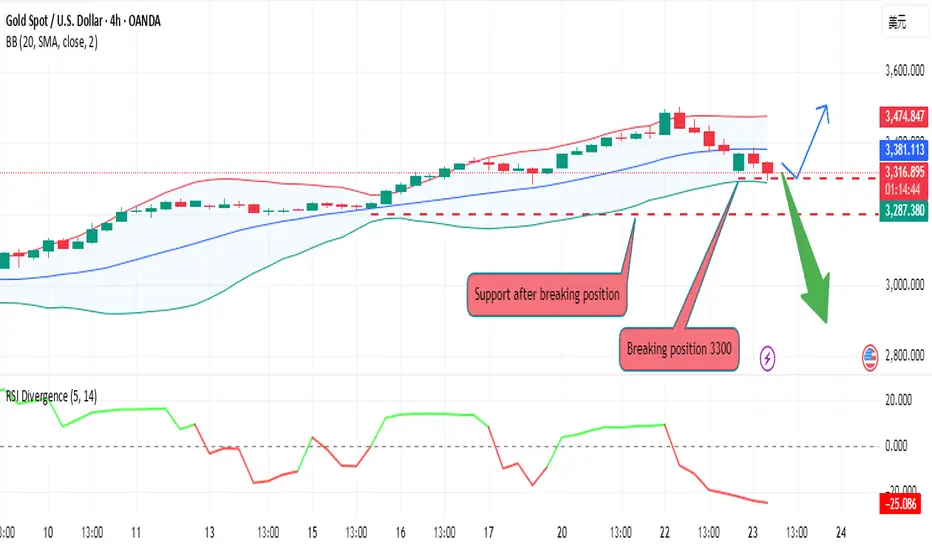
Analysis of gold short-term operation ideasGold price is currently trading below 3330. The downward trend in Asian session broke through the 3315 position in the morning. Our short position also successfully harvested a wave of big profits. Gold price showed signs of rebound in early European session. Now the upper pressure level can be moved down. The short-term pressure level is 3318, followed by the second highest point on the way up at 3357. The lower support level focuses on 3285. After effectively breaking through, we can focus on 3245. Now gold price is trading near the early low of 3315. The prudent operation idea is to go short at 3320 for protection at 3331 and wait for the gold price to reach 3285. After the break, wait for the rebound to 3300 and go short again to see the position of 3245. Long positions are not recommended.

Gold operation strategy, how to grasp the ups and downs of the mAt the end of the Asian market, spot gold maintained a sharp decline in the day. The current gold price is around $3,305/ounce, and it plummeted during the day.
Gold prices fluctuated this week, hitting a record high of $3,500/ounce, and then encountered resistance and fell to the $3,300/ounce level. The main reason for the record high in gold prices was that the market was worried that the Federal Reserve would lose its independence after US President Trump verbally attacked Federal Reserve Chairman Powell.
US President Trump said on Tuesday evening local time that he had no intention of firing Federal Reserve Chairman Powell. Trump also said that tariffs on Chinese imports would be "substantially" reduced from the current 145%.
Quaid believes that the hope of easing Sino-US trade tensions has driven a positive shift in risk sentiment and a recovery in the US dollar. Investors used this as an excuse to take profits on their gold long positions.
Latest trading analysis:
The gold daily chart shows that the 14-day relative strength index (RSI) has fallen back from the overbought area to the bullish area. The latest decline in this leading indicator supports a new round of decline in gold prices. However, as long as gold prices can hold the $3,300/oz level, gold buyers still have hope.
If the gold correction deepens, gold prices may challenge the 21-day simple moving average (SMA) of $3,163/oz. Before that, the $3,200/oz mark may provide some support for buyers.
On the other hand, if the upward trend resumes, gold prices may re-break through $3,400/oz and then aim for the historical high of $3,500/oz.
Gold has been volatile recently. If traders are not doing well in gold operations at present, I hope Quaid's analysis can make your investment smooth. Welcome all traders to communicate.
Interpretation of gold short-term operation ideasThe gold market opened at 3423.4 in the morning yesterday, and then the market fell back to 3411.6, and then the market rose strongly. The daily line reached a high of 3500.4, and then the market fell under technical pressure. Subsequently, the market took profits and went down. The daily line gave a low of 3365.8 and then the market consolidated. The daily line finally closed at 3381.2, and the market closed in an inverted hammer pattern with a very long upper shadow. After the end of this pattern, the market continued to be short after opening low today. In terms of points, yesterday's short positions at 3496, 3468 and 3442 were reduced, and the stop loss was followed up at 3445. If it opens low today and falls directly, give 3292 long stop loss 3285. The target is 3336, 3350, 3365 and 3374. Exit the market and continue the short stop loss at 3381. The target is not released and the loss is held in stages.

Tariffs ease, risk aversion drops, gold continues to be bearishAfter hitting the integer mark of 3500 yesterday, gold fell back by nearly 200 US dollars. Today's early trading opened lower and directly swallowed up the overall rise of yesterday. Will gold continue to correct or turn around?
From the current decline, the range from the high point of 3500 to the current low point of 3315 is close to 200 US dollars. Considering this round of decline, it has exceeded the range of short-term correction. Therefore, traders should guard against the probability that the gold price will enter a turning point in the short term!
After the current decline is too large, the main area is to go sideways to correct the main force. The overall rebound will not be too large.
Main area: around 3380-3400
Defensive support below: double bottom around 3280
Operation suggestion: Do not carry orders, heavy positions, lock positions in sudden change cycles, and bring stop losses! "Specific operations are subject to actual trading"

Gold price plunged nearly $200. The signal of cooling down the tIn the early Asian session on Wednesday, spot gold opened nearly $40 lower and hit $3,313.51 per ounce, down nearly $200 from the historical high of 3,500 hit on Tuesday. Because U.S. Treasury Secretary Benson hinted that international trade tensions would ease, which stimulated optimism in the stock market and boosted the dollar to a near one-week high; spot gold closed down 1.2% on Tuesday, closing at $3,380.95 per ounce.
Bob Haberkorn, senior market strategist at RJO Futures, said: The latest remarks suggest that the trade war with the Asian giant may ease, but this is the time to start selling.
After Benson said that the tariff deadlock was unsustainable, the U.S. stock market rose by more than 2%, suppressing the safe-haven buying demand for gold, and the rebound of the U.S. dollar also suppressed the price of gold.
Quaid believes that its roller coaster trend is still continuing. I hope traders will pay attention to the speeches of several Fed officials later this week, hoping to find clues to future monetary policy at a time when people are worried about the independence of the Fed. And I will analyze it for you as soon as possible and give you reasonable suggestions.
Current strategy:
Relative to the market situation: as long as the price can continue to rise, it means that the current situation is just a volatile market, not a peak retracement, which is also a feature of the volatile trend; at the same time, the current market is not extremely strong after a sharp drop, and it is still in a volatile rise; therefore, do not go long, but go long after the retracement support.

Gold hits 3500 retracement adjustmentGold Technical Forecast:
From a technical perspective, gold is confidently moving along a bullish trajectory. There is no doubt about that. But the signals now sent by the Relative Strength Index (RSI) and other momentum indicators are worth paying attention to. The daily RSI reading is close to 80, which has entered the severely overbought area. However, this does not necessarily indicate impending doom. It just confirms what we already know: buyers are in control.
So, is the price close to a top? Possibly. But I would not sound the alarm bells just yet. These high indicators are more of a warning than a battle cry. It is more of a "stay alert" than a "get out of here".
Spot Gold Technical Levels to Watch
Gold's climb to a record $3,500 was impressive, but as expected, it has begun to retreat slightly from this psychological high, most likely due to some conventional profit-taking. There is no natural resistance above this level; all we have are round numbers. However, on the way down, the situation is different.
Technical Analysis
Initial support includes Monday's high of $3,430 and the round number mark of $3,400 on the daily chart. Looking further down, $3,357 is last week's breakout level, followed by reliable support at $3,300. If a more meaningful pullback occurs, $3,245 and $3,167 will be worth watching, both of which were previous resistance ranges and are now likely to become support levels.

Gold price breaks through a new high of 3500 and enters the key Gold price hit a new record high of 3500. After reaching this point, it showed obvious pressure and went down to find the 3461 area. This is the largest correction since the rise of 3284 last Thursday.
Today's early trading price also continued to rise and break through the new high, but there was an episode, that is, it first broke through the high of 3444, then fell sharply to 3412, and finally confirmed the strong rise at 3418 to break through the new high, and continued to break through the sprint
Until noon, it sprinted to 3495 and suppressed the decline to find 3473 support, and then pulled up again to sprint to break the high of 3500. This time the decline was relatively strong, falling to the 3461 area
So far, the rising process can be slightly slowed down and enter a wave of adjustment
Accumulate momentum to provide power for the next round of start-up
During the adjustment process, pay attention to the golden section line
This wave from Since the rise from 2970, the largest adjustment squat is 0.382, and now this position is 3417, which is close to the Asian market acceleration starting point 3418. The two together become the stabilizer of the bullish trend: 0.382 position 3417 area
This is the first focus of today. During the adjustment process, pay attention to the position of the golden section line
0.382 position is 3417, close to the acceleration starting point
0.500 position is 3391, close to the 3384 area along the channel line
0.618 position is 3366, close to the four-hour lifeline
The current price space is large and the speed is fast. Articles and analysis are only auxiliary, and are more temporary reminders. Plans cannot keep up with changes. The three key points mentioned above can be kept in mind. If there are price variables during the process, they can also be adjusted accordingly.

Gold 3500 mark is about to openThe gold market opened at 3331.4 yesterday morning, then fell back slightly to 3328.6, then strongly fluctuated and pulled up, breaking through the previous week's high of 3358 and the pressure of 3387 and the 3400 integer mark, and then reached the highest position of 3430.8, and then the market consolidated. The weekly line finally closed at 3424.8, and the market closed with a basically saturated big positive line. After this pattern ended, today's market still has bullish demand driven by risk aversion and bullish sentiment, with the target at 3465, and the break at 3480 and 3500

Gold Weekly Outlook: Strong Upward Trend, Continue to Go LongThere is no analysis to be made on gold at present, basically all longs are made, this bull market has to be said to be too crazy.
Since gold started to rise from the low point of 2956, except for two normal adjustments in the middle, the price of gold has maintained a strong upward trend relying on the MA5 moving average for most of the time. This trend characteristic shows that in a shorter period, the MA5 moving average has become an important support line for the rise in gold prices. As long as the price runs above the MA5 moving average, the bulls will dominate.
At present, 3500 is about to arrive in a flash, it is just a matter of time. The current market depends on everyone's courage. If you go in with a long order, you will definitely make a profit, and it is very easy, with basically no callback.
And any callback is an opportunity. In terms of operation, you can continue to go long relying on the short-term moving average MA5.
Just like the analysis in Quaid's previous article, you can boldly believe that it can reach the new height you think. Believe in Quaid, believe in yourself, brother, you can do it.
I am Quaid. After seeing my analysis strategy, no matter your past gains and losses, I hope that you can achieve an investment breakthrough with my help and turn every tide in the gold market into our wealth wave.

GOLD !!! IS IT A TIME TO CORRECT ? Predicted Movement On GOLD for next Weeks
According to CCI Divergence
According to Fibo Extension
According to Fibo Retracement
According to Uptrend channel on weekly
According to UP trend Channel On Monthly

Gold’s Epic Surge: Why I’m Hyped for a Massive Breakout Here’s what I’m seeing with gold at $3,426, and why I’m glued to these levels just for you:
I’m betting if we smash past $3,426, gold’s sprinting to $3,454.
But if we hit a wall at $3,461, I’m bracing for a dip to $3,359. I’ve seen sellers pile in at highs before, and if they do, it’s just a quick nap before gold wakes up.
Kris/Mindbloome Exchange
Trader Smarter Live Better

Interpretation of gold US market operation ideas! ! !Gold continued to be bullish in the morning, and the 3400 mark has been broken. How will it evolve next?
The US dollar index directly fell on Monday morning, and the US Y index fell by more than 8% this year, causing gold to rise in a variable. The rise in gold caused by this situation will be greatly adjusted due to the recovery of the US dollar! The key to winning or losing tonight lies between 20 and 22 o'clock.
If the US stock market opens, it will fall below the 98 mark due to the southward movement of the US dollar, creating a new low since April 2022! The market's trust in the US dollar as a global reserve currency has declined! The possibility of turning to other safe-haven assets has increased, thereby increasing the variable of gold rising.
If based on this logic, tonight's 20-23 o'clock cycle is the main winning or losing day of this week!
Hypothetical principle: If it is postponed to the north during the day, everyone should pay attention to the selling pressure near 3415. As the price changes, the selling pressure is more likely to occur! And the defense line will rise in each round of corrective retracement!
Short-term defense line: 3355-3370-3383-3392
Pressure level above: 3430-3458
Risk notice: 1. When everyone is paying attention, long positions may fall at any time, and the range will not be less than 50-80 points!
2. The decline of the US dollar index will lead to a collapse in futures, which will trigger a chain reaction. Traders will face the possibility of gold settlement to fill the gap in other markets!

Gold is hard to break through 4000, short sellers are coming
Gold prices rose strongly in the Asian session on Monday, approaching the historical high of $3,400 per ounce, as concerns about the global trade situation intensified and the dollar fell to a two-year low due to concerns about economic recession. Despite the overbought signal on the technical side, the market's expectations of the Fed's rate cut and trade concerns continue to attract safe-haven funds to flow into the gold market.
Technical side:
Gold opened higher on Monday and has now risen from 3330 to 3394, with a range of $65. At present, gold indicators are expected to be severely overbought and a large correction may be needed at any time. In addition, the main force continues to push up gold to prevent the main force from fleeing. Gold is mainly shorted at highs below the 3400 mark!
SELL: 3394 Stop loss 3405
TP1: 3375
TP2: 3360

Interpretation of technical analysis of gold market opening operDue to the influence of Easter, the market was closed on Friday this week. After hitting a high of 3357, gold also ushered in a short-term adjustment! In the previous interpretation, we also emphasized to everyone that after hitting a new high, we should guard against the pullback caused by profit-taking. Especially at the critical time point when the market is about to close, but this does not mean the end of the bullish trend. After the sharp rise in gold, although there is selling pressure, gold still rose by 2.5% this week and closed above 3300.
So how should we trade gold next week?
The biggest driving factor for the rise in gold prices this time is Trump’s repeated tariff policy, coupled with the recent tense geopolitical situation, and the pace of global central banks buying gold. In the medium and long term, it is still a driving force for gold to rise.
Short-term operation: Pay attention to the first support level, which is 3310, which has been touched many times.
Short-term key support below: 3285-90
Short-term focus on high points above: 3340-45
If the breakthrough accelerates to the historical high point, everyone should be cautious in chasing more!

Analysis of gold price trend next week!Market news:
April 14 to April 18, 2025, due to the Good Friday holiday, the market was closed on April 18. There were only four trading days this week, and the spot gold market performed strongly, with a weekly increase of 2.76%. Prior to this, some investors chose to take profits after the international gold price hit a new high of more than $3,357 on Thursday. Although the current technical side shows that gold is overbought, the overall market is still in a steady upward trend.The rise in London gold prices was driven by the safe-haven demand caused by the weakening of the US dollar, trade policy uncertainty, and hawkish remarks by Federal Reserve Chairman Jerome Powell on the risk of stagflation. The economic data released this week showed differentiation, with a solid labor market but weak housing data, coupled with geopolitical risks such as the European Central Bank's interest rate cut and the Russia-Ukraine conflict, further enhancing the attractiveness of gold.Looking ahead, the bullish trend of gold remains solid, and investors should pay close attention to the Fed's subsequent policy statements and trade policy dynamics, which will have an important impact on market sentiment and gold price trends in the coming weeks.
Technical Review:
Gold daily level still maintains a strong unilateral bullish trend in the short term. There is no highest, only higher. Before the top pressure K appears, it will continue to step back and be bullish. The support position confirmed by the step back is about 3300-3290. As long as this position is stabilized, there is hope for further efforts in the future to set a new historical high.The 4-hour level is now in high-level fluctuations. The key MA10-day support moves up to 3313. As long as this moving average can be held, this cycle will still maintain a strong squeeze and pull up. At the hourly level, there will be a certain decline and correction in the short-term Asian session on Thursday, and it will be trapped in a shock consolidation. The next step is to wait patiently for the consolidation to end. The short-term pressure point middle track is also the 10-day moving average 3332-33 line. There may be multiple attempts here, but before breaking through, don't chase the rise! Pay attention to the lower track support 3313 below, and the upper track of the previous channel step back to confirm the range of 3300-3290, because the upward channel is uncertain whether there will be a false piercing. Therefore, it is recommended to wait for 3313, 3300-3290 to stabilize and rise next week, or break through 3332-33 and then step back to confirm stability, which is also bullish. After a sharp rise, it is just a small adjustment at a high level or sideways, which is to prepare for the next round of rise.
Next week's analysis:
Gold fell all the way in the US market on Friday, falling to 3283 at the lowest, but gold rose again in the second half of the night for risk aversion. Will gold return to a large range of fluctuations or end the adjustment? Then the trend of gold after the opening next week is very critical. If gold continues to rise strongly at the opening next week, then gold may be adjusted to the end, and gold bulls may continue to exert their strength. This will be seen after the opening of Monday.The gold 1-hour moving average is now continuing to diverge upward with a golden cross. If the gold 1-hour moving average turns in the short term, then the gold 1-hour will begin to adjust. So if the short-term opening is weak next week, then the gold 1-hour moving average may begin to turn, and if it is strong, it will continue to extend upward. Gold is suppressed by the downward trend line in the 1-hour short term. The short-term pressure of gold moves down to the 3332 line. If gold is still under pressure at 3332 after opening next week, then gold may continue to fluctuate downward in the short term, thereby driving the moving average to turn around. If it directly breaks through 3332 after opening, then gold will start to fluctuate in a large range.
Operation ideas:
Buy short-term gold at 3300-3303, stop loss at 3292, target at 3340-3350;
Sell short-term gold at 3350-3353, stop loss at 3362, target at 3310-3300;
Key points:
First support level: 3313, second support level: 3300, third support level: 3285
First resistance level: 3332, second resistance level: 3357, third resistance level: 3373

Trading suspension period. What is the future trend of gold?The dollar continues to fall. Fundamentals depend on Sino-US relations and economic data, especially after Powell's speech. The weekly close is close to the support level, and the decline may continue.
Gold recovers after shock. Fundamentals show that prices may continue to rise. The market will be closed for the next three days and traders will take a break. During the holiday, the weekend is full of too many unknowns. But from a technical point of view, the focus is on the medium-term level. Quaid believes that its upward trend is still strong.
If there is no supernatural event during the holiday, gold may rebound from the nearest resistance level in the Asian session and test the trend support level before continuing to rise. If there is any major change in the mood of the country/politicians, I will update my thoughts in time. Give traders time to adjust their positions.

Gold has a top signal, be wary of a retracement today!
On Wednesday, as the market waited to see whether Trump would reach a new trade agreement with trading partners, the US dollar index fell again and once fell to around $99.
Due to the weakening of the US dollar and the escalation of trade tensions, spot gold continued its record-breaking rise, refreshing its historical high to above $3,340, and soared by more than $100 during the day.
Today, Thursday, gold continued its bullish trend last night in the early trading, and once hit a historical high of 3,357 in the early trading.
But now we need to be extra careful, because tomorrow is Friday, Good Friday, and the market will be closed all day, which means that today, Thursday, is the last trading day of the week. Currently, long positions in gold are likely to be taken out of the market.
Once the long positions are taken out of the market, it is easy to have a large retracement, so we must be careful about this and must not be overly bullish.
Today's opening position is around 3342. In the morning, it retreated to around 3320, and then stretched up again.
However, it can be found that since it fell below the opening position of 3342, gold has not stood above 3342 again.
This is a strong signal of short-term retracement, especially when long positions are about to be profited.
Moreover, the hourly chart has a little ABC wave-shaped retracement. Once it comes down, I think it is not a problem to touch 3300-10, and it is not ruled out that it will be lower.
Currently, the ma10 moving average position below gold is also at 3300-3310.
Therefore, it is not recommended that you chase long orders today, and you should be prepared for the possibility of falling to 3300-3310 in advance.
In terms of operation, I suggest that you can enter the market and short near 3340, and the target can be 3300-3310.

XAU/USD 16 April 2025 Intraday AnalysisH4 Analysis:
-> Swing: Bullish.
-> Internal: Bullish.
Price has printed according to yesterday's analysis, however, as I mentioned in my analysis yesterday whereby I stated that price has printed a bearish CHoCH and I would continue to monitor price.
Price has printed very minimal pullback and continued its bullish trajectory, therefore, I will again apply discretion and not classify a bullish iBOS. I have however marked this in red as a guide.
Intraday Expectation:
Await for price to print bearish CHoCH to indicate bearish pullback initiation phase. Bearish CHoCH positioning is denoted with a blue dotted line.
Note:
With the Federal Reserve's dovish stance and persisting geopolitical uncertainties, heightened volatility in Gold is expected to continue. Traders should proceed with caution and adjust risk management strategies in this high-volatility environment.
Price could also be driven by President Trump's policies, geopolitical moves and economic decisions which are sparking uncertainty.
H4 Chart:
M15 Analysis:
-> Swing: Bullish.
-> Internal: Bullish.
Price did not print according to yesterday's analysis, failing to target weak internal low by printing a bullish iBOS. This is most probably due to Trump's tariff policy and ongoing uncertainty.
Price has now printed a bearish CHoCH to indicate bearish pullback phase initiation.
Price is now trading within an established internal range. However, I will continue to monitor price.
Intraday Expectation:
Price to trade down to either discount of 50% internal EQ, or M15 demand zone before targeting weak internal high priced at 3,317.920
Note:
With the Federal Reserve maintaining a dovish stance and ongoing geopolitical tensions, volatility in Gold prices is expected to remain elevated. Traders should exercise caution, adjust risk management strategies, and stay prepared for potential price whipsaws in this high-volatility environment.
Trump's tariff announcement will most likely cause considerably increased volatility and whipsaws.
M15 Chart:

Unpopular opinion, but I think it's time to short GoldThis melt-up is approaching resistance, and the symmetry on the chart is compelling. It could set up a great short opportunity as gold consolidates ahead of its next major move higher, likely in 2027.
However, if it breaks out of the current channel, we could be entering a true melt-up phase — and there's potential for significantly higher prices.

XAU/USD 15 April 2025 Intraday AnalysisH4 Analysis:
-> Swing: Bullish.
-> Internal: Bullish.
Price has now printed a bearish CHoCH as mentioned on various occasions in previous analysis. This is the first indication, but not confirmation, of bearish pullback phase initiation. I will however continue to monitor price.
Intraday Expectation:
Price to continue bearish, react at either discount of internal 50% EQ or H4 demand zone before targeting weak internal high priced at 3,235.845.
Note:
With the Federal Reserve's dovish stance and persisting geopolitical uncertainties, heightened volatility in Gold is expected to continue. Traders should proceed with caution and adjust risk management strategies in this high-volatility environment.
Price could also be driven by President Trump's policies, geopolitical moves and economic decisions which are sparking uncertainty.
H4 Chart:
M15 Analysis:
-> Swing: Bullish.
-> Internal: Bearish.
Price printed as per my alternative scenario in yesterday's analysis where I mentioned that due to the narrowing of the internal range, it could be a potential early signal that all HTF's are beginning their bearish pullback phase initiation. I would therefore not be surprised if price printed a bearish iBOS.
Price has printed a bearish iBOS.
Price has subsequently printed a bullish CHoCH to indicate bullish pullback phase initiation and has traded up to premium of internal 50% EQ.
Intraday Expectation:
Price has traded up to premium of internal 50% EQ and should technically target weak internal low priced at 3,193.630. However, price could also potentially trade up to mitigate M15 supply zone before targeting weak internal low.
Note:
With the Federal Reserve maintaining a dovish stance and ongoing geopolitical tensions, volatility in Gold prices is expected to remain elevated. Traders should exercise caution, adjust risk management strategies, and stay prepared for potential price whipsaws in this high-volatility environment.
Trump's tariff announcement will most likely cause considerably increased volatility and whipsaws.
M15 Chart:
