XAU/ USD) bullish trend analysis Read The ChaptianSMC Trading point update
analysis for XAUUSD (Gold vs. USD) on the 2-hour timeframe appears to suggest a bullish continuation setup after a correction. Here's a breakdown of the idea:
Key Points from the Chart:
1. Rising Channel:
The price is moving within an ascending channel.
After a breakout and strong rally, it is currently in a flag or wedge-like correction pattern.
2. Correction Zone:
The price is consolidating downward inside a small descending wedge (a bullish pattern), potentially forming a bull flag.
This is typically a sign of continuation after a strong upward impulse.
3. Support Zone:
A 4H support level is marked around 3,301.416, which aligns with the lower boundary of the flag pattern.
This is a potential buy zone for price to react and bounce.
4. Target Point:
The target is projected at 3,404.254, implying a breakout to the upside if the support holds.
5. RSI Indicator:
RSI is currently around 65, with previous values near 80, suggesting a slight cooldown but still in bullish territory.
A slight drop in RSI might occur before the next bounce.
6. EMA 200:
The EMA 200 is well below current price (around 3,137), indicating a strong bullish trend.
Mr SMC Trading point
Possible Trade Idea:
Entry: Around the 3,301–3,305 support area.
Confirmation: Wait for a bullish reversal pattern (engulfing candle or strong bounce).
Target: Around 3,404 (as per the marked target zone).
Stop Loss: Below the support zone (e.g., below 3,295), depending on risk tolerance.
Pales support boost 🚀 analysis follow)
Goldmansachs

XAU/USD) Flag Analysis Read The ChaptianSMC Trading point update
Analysis presents a bullish outlook for XAU/USD (Gold vs USD) on the 1-hour timeframe, based on Smart Money Concepts (SMC). Here’s a breakdown of the key elements:
---
Key Analysis Points:
1. Order Block + Key Support Zone:
Price recently tapped into a bullish order block around the $3,166.74–$3,208.62 zone.
This area is also marked as a "key support level", suggesting a strong demand zone.
The confluence of the Fair Value Gap (FVG) and order block gives this zone higher validity for potential reversal.
2. Bullish Market Structure:
The chart shows higher highs and higher lows, indicating a bullish trend.
Price action broke above a small consolidation, showing bullish momentum is resuming.
3. Projected Target:
The target point is set at $3,283.01, suggesting about a 55-point upside from the current price.
This target sits above a previous high, indicating anticipation of a liquidity grab or breakout.
4. RSI (Relative Strength Index):
RSI is at 57.94, which is a neutral-to-bullish zone. It supports the idea that there's still room for price to move up before being overbought.
5. EMA 200 (Exponential Moving Average):
The price is well above the 200 EMA, confirming a bullish bias in the higher timeframe.
Mr SMC Trading point
---
Possible Strategy:
Long (Buy) Entry Zone: Between $3,166–$3,208 (ideal near the order block/FVG).
Target: $3,283
Stop Loss: Below the order block, ideally below $3,166 to avoid getting wicked out.
---
Final Thoughts:
This is a well-structured bullish setup based on institutional concepts like order blocks and FVGs. The price is aligned with the trend, and RSI supports more upside. However, watch for any major news catalysts (especially with those economic event icons shown).
Pales support boost 🚀 analysis follow)

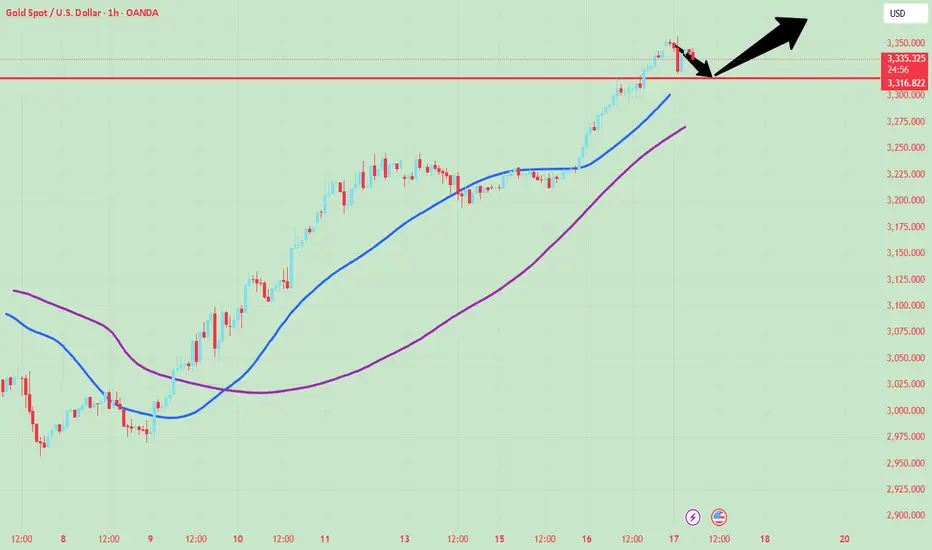
The price of gold is skyrocketing!Market news:
In the early Asian session on Thursday (April 17), spot gold rose slightly, once hitting a record high of around $3,357 per ounce. As the trade situation became increasingly tense, investors turned to safe-haven assets. The chairman of the Federal Reserve admitted that economic growth was slowing down, and the U.S. stock market, the U.S. dollar and U.S. bond yields fell sharply, which also provided momentum for the rise of gold prices. International gold prices soared dramatically, and the London gold price broke through the $3,300 per ounce mark and set a new high. Gold still has strong support, including a weaker U.S. dollar, uncertainty about tariff news, and concerns about a global recession. The escalating tensions between the world's two largest economies have hit confidence in financial markets, and investors have begun to flock to assets such as gold for risk aversion. At the same time, the U.S. dollar fell against other major currencies and remained at a nearly three-year low hit last week, meaning that gold has become relatively cheap for buyers holding foreign currencies. This trading day will usher in the European Central Bank's interest rate decision, and the market generally expects a 25 basis point drop; in addition, the changes in the number of initial jobless claims in the United States, the initial value of the annualized total number of building permits in the United States in March, and the annualized total number of new housing starts in the United States in March will also be released, and investors need to pay attention to them. Friday is the Good Friday holiday, and investors also need to be wary of brokers' position adjustments before the holiday.
Technical Review:
Trends are king. Whether you believe it or not, do it or not, gold continues to set new historical highs, soaring, and soaring. The price continues to run in the trend structure, the buying trend structure is intact, and the daily line continues to close strongly! However, it is necessary to pay attention to the daily price reaching the upper track of the Bollinger band, the four-hour chart is 9 consecutive positive, and the RSI indicator is overbought above the 80 value. It is necessary to pay attention to the emergence of a high-rise and fall-back wash trend. Buy at a low price and wait for a callback to the relative low point layout. At present, gold has basically rushed to the sky. In April, you can basically see the fluctuation range of gold within 70-100 points every day. In this market, you say that fixed points are sometimes fleeting, and the optimistic resistance is like paper that can be broken at the touch of a button. So is gold really going to the sky? I can only say that under such favorable conditions, it is really difficult to see gold fall! From a macro level, the daily chart gold price has formed a lasting upward trend since the low of $2536.68. The current price is around $3350, which is significantly higher than all major moving averages, indicating that the long-term bullish momentum is still strong. The golden cross pattern of the MACD indicator on the daily chart continues to develop, indicating that the long-term trend momentum is still upward. This year, the trend cannot be changed. There is a callback squat or sideways consolidation, which are all bullish opportunities; So once the big positive K is closed today, the retracement above the top and bottom support of 3315 will continue to be bullish. As for the height, the third derivative wave of the monthly line is calculated at 3444 by 2 times, which is also the goal of the next stage.
Today's analysis:
Gold has been crazy recently, and the buying momentum of gold has been galloping all the way. In the past two days, I woke up every day and opened my eyes. Gold has reached a new high again. The buying power of gold is very strong. It was bought at 3342 in the Asian session and harvested at 3355. Although gold is crazy now, we should also pay attention to the purchase of gold at any time. The current trend of gold buying has not changed. Continue to buy when it falls in the Asian session. The 1-hour moving average of gold continues to be a golden cross and the upward buying divergence arrangement. It is difficult for gold to have a big correction if it is strong. After gold began to fall and fluctuate and adjust at the line near 3315 yesterday, gold continued to break upward in the US session. Then the short-term 3315 of gold will form support again. Gold will continue to buy on dips when it falls back to 3315. If gold falls back to around 3320, it can continue to buy. Before there is no particularly obvious sign of a sharp decline, buying has become our only choice, and it is also the best and safest choice! While being bullish, pay attention to the opportunity to fall back. Unless the strength is suddenly strong at that time, don't buy easily. Wait patiently for the opportunity to fall back. How long can gold buying be crazy? No one knows that there is no top when it rises. Since gold is so crazy, what we have to do is follow it. It is difficult for gold to fall sharply before a large-scale sell signal appears!
O peration ideas:
Short-term gold 3317-3320 buy, stop loss 3308, target 3360-3380;
Short-term gold 3387-3390 sell, stop loss 3398, target 3340-3330;
Key points:
First support level: 3340, second support level: 3332, third support level: 3315
First resistance level: 3363, second resistance level: 3377, third resistance level: 3386
Gold is bullish but not high, but be careful to adjust the risk!
📌 Driving Event
Federal Reserve Chairman Powell made a clear statement at the Chicago Economic Club on Wednesday (April 16) that he would wait for more economic data to be released before deciding the direction of interest rate adjustment. He particularly emphasized that the recent market volatility is a reasonable response to the Trump administration's tariff policy, and bluntly denied the possibility of "Federal Reserve support". This hawkish speech directly led to
the expansion of the decline in US stocks and the continued surge in gold.
The US dollar index has risen in the past two days, and with the increase in tariff policies, there will be no unfavorable factors if the game between major powers does not stop.
📊 Commentary Analysis
Gold continued to rise unilaterally in the past two days, especially the full-day increase of more than 100 US dollars on Wednesday, which almost beat the shorts without any ability to fight back. At present, gold continues to rise and fall, setting new highs, and there is no way to see where the high point is in this rally. For the current market, the only effective trading strategy is to go long on the decline and continue to be bullish. If there is no adjustment and decline space, it is better not to trade.
Even if you are bullish today, you should be aware that there will be room for adjustment at any time. If it falls below 3320, it will not be very strong. If it falls below 3280, gold may fall in retaliation. Therefore, don't be too bullish today and pay attention to the risk of high gold prices. Moreover, Friday is Good Friday, and the US market will be closed for one day. Beware of the risk of closing positions after long positions are profited. 🔶Personal
💰Strategy
Long position:
Gold is long near 3330-35, defend near 3320 area, and target 3360
⭐️ Note: Labaron hopes that traders can properly manage their funds
- Choose the number of lots that matches your funds
- Profit is 4-7% of the fund account
- Stop loss is 1-3% of the fund account

The opportunity to short gold in the European session has arrive
📌 Driving Event
On Tuesday, US President Trump launched an investigation into the necessity of tariffs on key minerals, the latest move in the expanding trade war. This trade war has affected key areas of the global economy.
📊Comment Analysis
In the morning, gold fell briefly at 3275, and then broke through again.
The current market rises or dives all depend on Trump's words, and today is the 34th trading day since gold rose from 2832 on February 28, and the 8th trading day since it rose from 2956 on April 7. It is likely to be a new round of change time window.
Therefore, I think the current rise is just the main force pulling up and shipping. The European session is alert to the possibility of a sharp decline again! ! !
In terms of the hourly chart, the current 3293 line will be an obvious pressure. The European session recommends actively shorting here! ! !
💰Strategy Package
Short position:
Actively participate at 3290-3300 points, profit target below 3280 points
⭐️ Note: Labaron hopes that traders can properly manage their funds
- Choose the number of lots that matches your funds
- Profit is 4-7% of the fund account
- Stop loss is 1-3% of the fund account

Gold prices soared again!Market news:
In the early Asian session on Wednesday, spot gold suddenly surged in the short term, breaking through the $3,275/ounce mark, with an intraday increase of more than $45. The latest report from Bloomberg News in the United States said that as the Trump administration pushed forward investigations that could expand the trade war, it stimulated demand for safe-haven assets, and the London gold price hit a record high again. As the escalating trade war has raised concerns about the prospect of a global recession, as a traditional safe-haven asset, gold has accumulated a gain of more than 23% in 2025, continuing to set a record. As investors increase their holdings of international gold-backed exchange-traded funds (ETFs) and central banks continue to increase their holdings of gold, major banks remain optimistic about the outlook for gold in the coming quarters. Investors are waiting for a speech by Federal Reserve Chairman Powell, scheduled for Wednesday, to look for clues related to interest rates. It is also necessary to pay attention to the US retail sales data at 20:30 on Wednesday and the specific implementation details of Trump's tariff policy. The analyst specifically reminded that market liquidity may decline before the Good Friday holiday, and any sudden policy changes may trigger sharp fluctuations.
Technical Review:
Gold opened sharply higher in the early trading and hit a new record high. It broke through the 3230 mark in the late trading and stabilized. The price continued to break the adjustment range of yesterday and rose in large volume. There was no technical movement during the day. The super-gain appeared in the early trading, and the price continued to hit a new record high. As investors turned to safe-haven assets amid the uncertainty brought by the continued tariff plan of US President Trump, additional tariffs could exacerbate the ongoing trade war and slow global economic growth. As global stock markets bottomed, the pressure on gold finally eased, and the precious metal rose sharply to a record high. The rise was very fierce because everyone rushed into the gold market, hoping to use it as a safe haven against the stagflation caused by the trade war. From a more macro perspective, gold is still in an upward trend because real yields may continue to fall because the threshold for rate hikes remains very high. Potential risks include another sharp sell-off in the stock market or a hawkish stance from the Federal Reserve. In the short term, given that gold's buying positions are too concentrated, if the trade war eases, gold prices are likely to experience a deeper correction, so it is necessary to pay close attention to developments in this regard. The current environment still supports the rise of gold, but the road to gold price rise will not be smooth, and there may be a temporary correction in the middle.
Today's analysis:
Gold directly broke through the new high in the early trading to avoid risks. The short-term adjustment of gold ended and finally completed the adjustment in a volatile manner. This kind of strong buying market of the breakthrough will basically not fall back too much. Since gold has chosen to break upward, since it has broken through, then it is to buy in the trend. The decline of gold is an opportunity to buy.The 1-hour moving average of gold began to turn upward. If the 1-hour moving average of gold continues to diverge upward, then the buying of gold will continue to exert its strength. After gold breaks through 3245, then gold 3245 has formed support in the short term. Buy on dips when gold falls back to 3245. The strength of the wave of gold in the morning was still there at that time, so after the high, you must wait patiently for adjustments and continue to go long. Gold can continue to buy when it falls back to around 3245.
Operation ideas:
Buy short-term gold at 3245-3248, stop loss at 3236, target at 3280-3290;
Sell short-term gold at 3293-3295, stop loss at 3304, target at 3250-3240;
Key points:
First support level: 3253, second support level: 3240, third support level: 3225
First resistance level: 3280, second resistance level: 3300, third resistance level: 3315

Gold bull market? 3300 is not far awayEvent summary:
Goldman Sachs releases another "gold bomb"! The Wall Street giant raised its gold price target for the third time, predicting that gold will soar to $3700 per ounce in 2025, and even warned that it may exceed $4500 in extreme cases! In just a few months, the expected price of gold has soared like a rocket, and the market is completely boiling-this is not an investment, but this time, it may be an unprecedented super market!
Level analysis:
The early fluctuations of gold were not large, and it has always shown a trend of oscillating sideways. However, the current surge has directly given everyone a big surprise. How should we view the upward trend?
The surge in gold directly broke through the oscillation area. The daily line continued to attack after a break. The trend is still in a strong form, so it is better to follow and do more in the short term!
Trading signal:
3240-50 long, stop loss 3230, take profit 3285.
I am Quaid. After seeing my analysis strategy, I hope you can achieve an investment breakthrough with my help and turn every tide in the gold market into our wealth wave.

How to profit from gold volatility!📌 Driving events
Looking ahead to this trading day, whether gold prices can rise further may still depend on Trump's tariff headlines and the upcoming Fed speech, as there is still no top economic data released on the US calendar
📊Comment analysis
In fact, the US trading time for gold today is to pay attention to short-term adjustments. Gold now seems to be accustomed to gold bulls for risk aversion. Although gold is supported by risk aversion today, the strength of gold bulls is not very strong. Gold has repeatedly hit highs and fallen back. Gold 3228 continues to be short, and the decline is harvested. The US market rebounds 3225 and continues to be short. Gold falls again and harvests. Gold is still adjusting at a high level. Don't chase the high for the time being. Gold rebounds and rushes high and can still continue to be short.
Today, short-term gold bulls have begun to be unable to do their best, so gold bears may start at any time. Gold still has the opportunity to adjust. Gold continues to watch the adjustment market in the short term and pay attention to trading signals in time.
Card the price and participate well. Grasp the rhythm of long and short two-way transactions. You will find that this volatility is much more fun than the big volatility.
💰Strategy Package
US trading ideas:
Short gold at 3230-35, stop loss at 3240, target at 3190-3180;
⭐️ Note: Labaron hopes that traders can properly manage their funds
- Choose the number of lots that matches your funds
- Profit is 4-7% of the fund account
- Stop loss is 1-3% of the fund account

Sideways, continue to wait for a new ATH of 3270
📌 Driving Events
Bloomberg reported that gold prices climbed to near record highs as the United States planned to impose more tariffs, further exacerbating investor anxiety.
Bloomberg reported that the Trump administration launched an investigation into semiconductor and pharmaceutical imports, paving the way for tariffs
📊Comment Analysis
Gold prices are sideways, waiting for prices to rise and continue to hit new highs
💰Strategy Package
Long positions:
Actively participate at 3225-3235 points, with a profit target above 3240 points
Short positions:
Actively participate at 3245 points, with a profit target below 3230 points
⭐️ Note: Labaron hopes that traders can manage their funds properly
- Choose a lot size that matches your funds
- Profit is 4-7% of the fund account
- Stop loss is 1-3% of the fund account

Do you think this is the final height of gold?
At present, affected by the global trade conflict, the price of gold is above $3,200. Although there was no accelerated rise on Monday, the retracement to confirm the position of $3,190 is also very perfect. I also emphasized the key position of $3,190 in the article last night. The gains and losses of this position will determine the direction of the short-term gold price.
Therefore, regarding the next target of gold in 2025, I think we should continue to pay attention to the target price of $3,318, and then adjust it according to the situation. What we need to do now is not to adjust the so-called target, but to understand the underlying logic of the deep-level gold rise when we encounter a callback in the middle!
Okay, let's talk about the gold market today.
On Monday, the price of gold opened slightly lower and pulled up to the previous high of $3,247, and then slid down in the European session. Many friends are worried about whether they will encounter Black Monday. My point of view is not speculation, but to see whether the key position of $3,190 will be lost. If it is lost, adjust the direction. Don't make too many assumptions before it is lost.
Today, gold continues to fluctuate at a high level. Two positions are focused on below. One is the support low point before the last 1-hour level pull-up at 3190, and the other is the top and bottom conversion position of the previous high point of 3167 US dollars.
As shown in the figure, the 4-hour gold price fell back to confirm 3190 US dollars last night, and then continued to climb steadily upward. The current focus is on the breakthrough of 3250 US dollars. Once it breaks through here, it will form a new pull-up. Fear of heights is the mentality of most people. They think that they will be trapped after the plunge if they chase high positions. In fact, as long as they fasten their seat belts, even if the plunge does not have much impact, people who are afraid of heights cannot make friends with the trend. They always think that a surge will definitely surge, which is a black-and-white thinking model.
Today, gold continues to rely on 3190 US dollars as the dividing point between long and short positions, and then go long after the callback. Pay attention to 3250-3265-3270 US dollars above. Break through 3190 US dollars and adjust the thinking to do a reverse hand!
Join me and I will guide you to a profitable trade 💵!

Gold is finishing at a high level to resist the fall! The bullis
📌 Driving events
U.S. President Trump said on Monday that he was exploring the possibility of temporarily exempting tariffs on imported cars and parts to give auto companies more time to establish production bases in the United States.
New York Fed: The unemployment rate is expected to rise to the highest level since April 2020 in March. In March, households were more pessimistic about employment and future income. The expected inflation rate for the next five years is 2.9%, down from 3% in February.
Geopolitical situation:
It was learned on the 14th local time that Israeli officials said that Israel and the Palestinian Islamic Resistance Movement (Hamas) still have great differences on the ceasefire in Gaza. The official said that compared with the previous negotiating position, Hamas seems willing to release more Israeli detainees, but if Hamas insists on requiring all parties to guarantee that Israel must stop waging war in the Gaza Strip after the ceasefire, it will still be difficult to promote an agreement. The official expects Hamas to respond to the new ceasefire proposal in the next few days.
📊Comment Analysis
The hourly level shows that the short-term gold price has fallen from a high level and gradually fell into a narrow range above the hourly 60-day moving average support level. The current hourly level indicators are narrowing, maintaining a short-term shock guide reference. The 5-day moving average and the 10-day moving average at the four-hour level are arranged in a downward cross, maintaining the four-hour level peak signal. The short-term decline gradually brings about the four-hour RSI mean reversion, forming a four-hour level adjustment trend. The gold price has risen and fallen to maintain a shock downward trend, which has not changed the medium- and long-term upward trend. Be cautious to maintain a bullish shock trading strategy during the day.
💰Strategy package
Long order:
Aggressive participation at 3185-3195, profit target above 3210
Steady participation at 3175-3185, profit target above 3195
Short order:
Aggressive participation at 3250, profit target below 3230
⭐️Note: Labaron hopes that traders can properly manage their capital
- Choose the number of lots that matches your capital
- Profit equals 4-7% of the capital account
- Stop loss equals 1-3% of the capital account

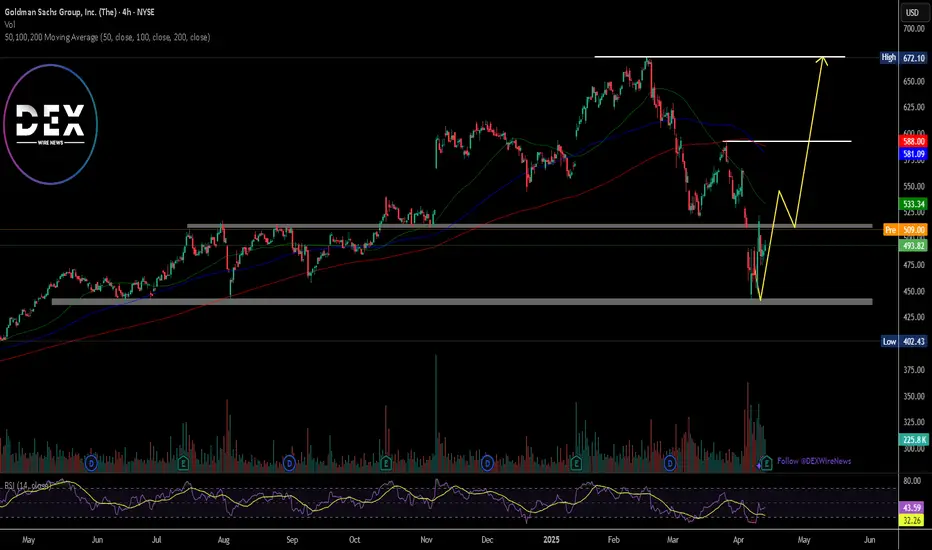
Just In: The Goldman Sachs Group, Inc. (GS) Set for Breakout The Goldman Sachs Group, Inc. (GS) shares is set for a breakout today as the firm smashes Q1 Estimates leading to a 2.45% surge in Monday's premarket trading.
Reports Overview
Goldman Sachs delivered a strong first-quarter performance, beating Wall Street expectations on both earnings and revenue, thanks to a record-setting quarter in equities trading. The bank posted earnings of $14.12 per share versus an expected $12.35, with revenue reaching $15.06 billion compared to forecasts of $14.81 billion.
Financial Performance
In 2024, The Goldman Sachs Group's revenue was $52.16 billion, an increase of 15.34% compared to the previous year's $45.23 billion. Earnings were $13.48 billion, an increase of 71.52%.
Analyst Forecast
According to 16 analysts, the average rating for GS stock is "Buy." The 12-month stock price forecast is $593.43, which is an increase of 20.02% from the latest price.
Technical Outlook
Prior our last analysis on NYSE:GS stock, the asset is already approaching the short term resistant point and a break above that pivot would cement the path for a bullish campaign for NYSE:GS shares . As hinted by the RSI at 43, NYSE:GS shares has more room to capitalize on the dip and pull on a bullish campaign today.
All eyes are set on the $520 level, should NYSE:GS shares break that pivot, a bullish breakout might be inevitable.
Gold price hits new high, 3216 as the dividing lineGold prices rose strongly by nearly $276 in three trading days, and broke through historical highs one after another. There is no highest, only higher.
There are many similar points in the rise, which can be summarized into five points. The first is the continued rise in the early trading and breaking through the new high. The second is the 0.382 position of the space adjustment and the same amplitude switching of the space. The third is the wandering back and forth sweep of the European session. The fourth is the flash of good points. The fifth is to learn to stop when you are ahead.
Combining these five points to look at the market situation, the gold price continues to rise. Last Friday, it closed directly at the high of 3237-3238 area.
Today The price opened lower in the morning and touched 3210, and hit a new high of 3245.6. But this time it was different. After the high, it fell back. The rise was 30 US dollars, and the high fell back 25 US dollars. Basically, the rise was as much as the fall. In the afternoon, the resistance of 3238 was confirmed for the second time, and it fell 22 US dollars again to find 3216, which was basically recovered.
The overall trend will be more adjusted. The cooperation between the high fall and the bottom recovery will provide momentum for the start of a new round of market.
Specifically, the key points to note are:
1. The correction range of the market space is at least 30 US dollars, and the start is at least 60 US dollars. Instead of focusing on the high and low issues, we should grasp the present.
2. The daily and weekly lines are rising strongly, and the indicators and patterns are overloaded. At present, only the direction is referenced; the four-hour pattern opening situation, the lifeline position is slightly far away, 3154 is close to the support point 3151 area that was stepped back late at night, and together they become the spatial dividing line. The resistance above is 3270-3275 and 3299.
3. The hourly chart pattern closed and flattened. Today's white market has been running back and forth around the upper and lower rails. The current pattern further closed the range of 3242-3216. Break through this space and then look at the space switch, and then cooperate with the small cycle double-line upper rail position 3194 area. If the price breaks the early low of 3210, it will switch space downward.
4. As shown in the figure, the price last week accelerated the rise and broke through 3190, and last Friday, it repeatedly broke through the new high around 3210, first the new high of 3238 (looking for 3210), then the new high of 3245 (looking for 3210), and then the new high of 3245.6
Now the price is down to 3216, which is also the starting point of the Asian session
Using 3216 as the switching point, the current sweeping space is about 30 US dollars, and the subsequent price breakthrough will switch the space of 30 US dollars
Focus on 3276-3278 upwards and 3186-3188 downwards
And it is very interesting that the 0.382 position of the latest wave of rise is also at 3187-3188
So, here we need to focus on the key points , with 3246-3216 as the range sweep, breaking through and switching to 30 US dollars, focusing on the support of the 3186-3188 area, and then looking at the upward switching space
In addition, it is necessary to remember that the online position is the 3131-3129 area, the top and bottom conversion position, and it is also a strong resistance level that turns into a strong support level after breaking through. After breaking through, it directly rises unilaterally
In summary, for gold at the beginning of the week, we treat it with a biased adjustment and sweeping idea. Referring to this idea, we have deployed high altitude twice in the 3236-3238 area. As of press time, the price fell to 3216, and all short orders were closed at 3217, waiting for the next plan. Now the price has risen again to 3230, and it continues to sweep, rushing high and falling, bottoming out and rising, which is in line with the above-mentioned biased sweeping and adjustment method.

XAU/USD) Bullish trand analysis Read The ChaptianSMC Trading point update
technical analysis of Gold (XAUUSD) on a 2-hour timeframe, with a bullish outlook. Here's a breakdown
1. Trend & Structure:
Uptrend Channel: Price is moving within a clear upward channel, respecting the trendline.
Higher Highs and Higher Lows: Indicates strong bullish momentum.
2. Key Zones:
Key Support Level (Yellow Box): Around $3,158.49 – this is the "safe entry point" if price pulls back.
First Entry Point: Around $3,222.76 – likely a breakout entry above a local resistance.
Target Point: $3,378.01 – a projected bullish target based on continuation.
3. Indicators:
RSI (14): Currently above 70 (overbought zone), but still climbing. There's bullish strength, but a pullback may occur soon.
200 EMA: Positioned below current price, confirming the bullish bias.
Mr SMC Trading point
4. Expected Scenarios (2 Paths):
Bullish Continuation: Price keeps rising, respecting the uptrend and hitting the target.
Pullback and Bounce: Price may retrace to the support zone or trendline, then bounce back up to target.
Summary of Idea:
This is a buy setup:
Buy at breakout above $3,222.76 (First Entry)
Safer buy at $3,158.49 (Support Re-test)
Target: $3,378.01
Watch RSI for pullback clues.
Pales support boost 🚀 analysis follow)

GOLD Ready to Break Highs Again! 🔥 3058 Level in Sight – Are You Ready? 🔥
📊 Market is following H4 Structure
📈 H4 BMS & OB in Play – Strong Momentum Building!
For detailed analysis & real-time updates, follow our TradingView page! 📍📩

US Banks on Fire | Revenues Soar, and So Do the ProfitsWho Needs a Recession? Banks Are Swimming in Cash!
The largest U.S. banks have reported some of their best quarterly performances in recent years, with surging trading revenues, a resurgence in dealmaking, and an overall renewal of corporate confidence playing pivotal roles. Let’s break down the key details of the results.
Market Recovery
Across the major banks, investment banking and trading activities recorded impressive performances. Goldman Sachs saw investment banking revenue increase by 24%, while Bank of America (BofA) experienced a massive 44% jump, marking its strongest quarter in three years.
The market volatility stemming from factors like the U.S. election and changing expectations around interest rates continued to fuel robust trading revenues. Morgan Stanley’s equities division, for example, reached an all-time high, while JPMorgan and Goldman Sachs enjoyed notable gains in fixed-income trading.
A surge in CEO optimism has led to an uptick in mergers and acquisitions (M&A), initial public offerings (IPOs), and private credit demand. Morgan Stanley, in particular, is seeing the largest M&A pipeline in seven years, signaling a sustained wave of dealmaking.
Mixed Results for NII
Net interest income showed varying results across the banks, but forward guidance indicates that NII will likely see moderate growth in 2025, spurred by continued loan demand and higher asset yields.
Credit Risks on the Rise
Consumer lending pressures have persisted, with JPMorgan’s charge-offs rising by 9%. Many banks are preparing for a further increase in delinquencies, particularly in credit cards.
Commercial Real Estate Challenges
While the office sector remains under stress, banks are managing their exposures cautiously and have yet to face significant shocks in this area.
Regulatory Scrutiny Continues
Citigroup lowered its 2026 profitability target as it undergoes a transformation, while Bank of America faced increased scrutiny over its anti-money laundering compliance.
Resilient U.S. Economy
Banks are reporting strong consumer spending, loan growth, and corporate profitability, which supports an optimistic outlook for earnings growth heading into 2025.
Performance Breakdown for Each Bank
JPMorgan Chase
- JPMorgan posted a record annual net income of $58.5 billion, marking an 18% increase from the previous year.
- Investment banking saw a 46% surge in revenue, driven by strong advisory and equity underwriting.
- Trading revenue climbed by 21%, led by a 20% increase in fixed-income trading.
- Despite the impressive results, JPMorgan is still facing challenges such as rising charge-offs and pressures on loan margins. CEO Jamie Dimon emphasized concerns about persistent inflation and growing geopolitical risks.
Bank of America
- BofA experienced an 11% year over year growth in revenue, reaching $25.3 billion, with net income up 112% from the previous year.
- The investment banking division saw a dramatic 44% rise in revenue, the highest in three years, thanks to strong debt and equity underwriting.
- Trading revenue grew by 10%, driven by solid performance in fixed income (up 13%) and equities (up 6%) as market volatility spurred client activity.
- BofA also reported growth in its consumer and wealth management divisions, with credit card fees and asset management showing strength. Client balances grew to $4.3 trillion, a 12% increase from the previous year.
- After several quarters of decline, BofA’s NII grew by 3%, exceeding expectations and signaling stability. The bank expects NII to continue rising through 2025, with projections of $15.7 billion per quarter by the end of the year.
Wells Fargo
- Wells Fargo’s revenue remained flat at $20.4 billion, but net income surged by 50%.
- NII declined by 8% year-over-year but is expected to rise slightly in 2025 due to higher reinvestment rates on maturing assets.
- The bank made significant progress in cost-cutting efforts, reducing non-interest expenses by 12%, thanks to workforce reductions and efficiency initiatives.
- Investment banking fees rose by 59%, benefiting from the broader market recovery and the bank’s renewed focus on its Wall Street presence.
- Wells Fargo returned $25 billion to shareholders in 2024, including a 15% dividend increase and $20 billion in stock buybacks. However, the bank continues to face regulatory constraints, notably the asset cap imposed by the Federal Reserve.
- Looking ahead to 2025, Wells Fargo anticipates modest growth in fee-based revenue, with cost discipline and efficiency gains driving improvements.
Morgan Stanley
- Morgan Stanley saw a 26% increase in revenue, reaching $16.2 billion, while net income soared by 142%.
- Equity trading revenue jumped by 51%, setting a new all-time high as market volatility sparked increased client activity, particularly in prime brokerage and risk-repositioning trades.
- Investment banking revenue grew by 25%, fueled by strong demand for debt underwriting, stock sales, and M&A activity. CEO Ted Pick noted that the M&A pipeline is the strongest in seven years, signaling a potential multi-year recovery in dealmaking.
- Morgan Stanley’s wealth management division saw $56.5 billion in net new assets, increasing total client assets to $7.9 trillion. The firm is pushing toward its goal of $10 trillion in assets under management.
- In response to growing business complexities, the firm launched a new Integrated Firm Management division to streamline services across investment banking, trading, and wealth management.
Goldman Sachs
- Goldman Sachs experienced a 23% increase in revenue, reaching $13.9 billion, while net income more than doubled, up 105%.
- Record performance in equity trading contributed to a 32% increase in revenue from this segment, as market volatility drove greater client activity.
- Investment banking revenue grew by 24%, boosted by significant gains in equity and debt underwriting.
- The firm’s asset management division saw an 8% rise in assets under management, reaching $3.1 trillion, while management fees exceeded $10 billion for the year.
- Goldman is winding down legacy balance-sheet investments but also saw a gain of $472 million from these investments in Q4. The firm’s recent launch of its Capital Solutions Group is aimed at capturing growth opportunities in private credit and alternative financing.
Citigroup
- Citigroup posted a 12% increase in revenue, reaching $19.6 billion, with non-interest revenue surging 62%.
- Fixed-income and equity markets were key drivers, growing 37% and 34%, respectively, as market volatility tied to the U.S. election boosted performance.
- Investment banking revenue climbed by 35%, supported by strong corporate debt issuance and a pickup in dealmaking activity.
- The bank unveiled a $20 billion stock repurchase program, signaling confidence in future earnings.
- Citigroup also made strides in controlling operating expenses, which declined by 2% quarter-over-quarter. However, the bank lowered its 2026 return on tangible common equity (RoTCE) guidance to 10%-11% due to the costs of its ongoing transformation.
- CEO Jane Fraser emphasized Citigroup’s long-term growth trajectory, noting improvements in credit quality and continued progress with the strategic overhaul, including the postponed IPO of Banamex, the bank’s Mexican retail unit, now expected in 2026.
Long story short
Heading into 2025, the major U.S. banks are in strong positions, buoyed by a favorable economic backdrop, continued growth in trading, and a rebound in corporate dealmaking. Despite challenges such as rising credit risks, regulatory hurdles, and potential macroeconomic uncertainties, the outlook remains positive. With a recovering IPO market, continued wealth management growth, and strong trading revenue, the banks are poised to capitalize on the renewed corporate optimism. The key question will be whether the dealmaking frenzy continues or whether uncertainties in the global economy and market dynamics could temper the rally.

XAU/USD) Bearish trand analysis Read The ChaptianSMC Trading point update
This chart analysis is for Gold Spot (XAU/USD) on the 1-hour timeframe. Here’s a breakdown of the idea shown:
---
Key Points in the Analysis:
1. Current Price:
XAU/USD is around $2,982.92 at the time of the chart.
2. Trend:
The chart suggests a bearish outlook.
Price has been consistently rejected from the yellow supply zone (around 3,020–3,033).
EMA 200 (blue line) is above the current price, confirming downward momentum.
3. Rejection Zone:
Marked in yellow between 3,020 and 3,033. Labeled as “Reject points”.
Price failed to break above this zone multiple times.
4. Breakout Pattern:
Two descending rectangles highlight bearish continuation patterns.
A bearish flag or wedge is visible, followed by a breakout downward.
5. Target Zone:
Highlighted in yellow between 2,900 and 2,921, with target point at 2,920.615.
Price is expected to move down to this level.
6. RSI (Relative Strength Index):
RSI is declining and shows bearish divergence, supporting downside move.
Currently around 39.19, which is closer to oversold territory but still has room to drop.
Mr SMC Trading point
---
Trade Idea Summary:
Bias: Bearish
Entry Area: Rejection near 3,020–3,033 zone
Target: 2,920.615 (highlighted support zone)
Stop Loss: Could be placed above 3,033 (supply zone or EMA 200)
Confluence Factors:
EMA 200 rejection
Bearish RSI divergence
Repeated supply rejection
Breakout from bear flag structures
Pales support boost 🚀 analysis follow)

XAU/USD) Bearish analysis Read The ChaptianSMC Trading point update
This chart analysis of Gold (XAU/USD) on the 2-hour timeframe appears to be a bearish setup based on Smart Money Concepts (SMC). Here's a breakdown
Key Elements:
1. Price Channel Break & CHoCH:
The price was in a rising channel.
A clear Change of Character (CHoCH) occurred after the price broke below the structure, signaling a shift from bullish to bearish.
2. Fair Value Gap (FVG):
There's a bearish Fair Value Gap (FVG) highlighted in the yellow box around the 3,047–3,075 level.
The expectation is that price may retrace into this FVG before continuing downward.
Mr SMC Trading point
3. Target Zone:
A major demand zone or target point is marked around 2,940, indicating a potential bearish move of around -148 points (~4.8%) from the FVG.
4. EMA & RSI:
200 EMA is around 3,047, acting as dynamic resistance now.
RSI is below 40 and trending down, showing bearish momentum with slight bullish divergence, hinting at a short retracement before another drop.
---
Summary of the Idea:
Bias: Bearish
Trade Plan:
Wait for price to retrace into the FVG zone (~3,047–3,075).
Look for bearish confirmation (like bearish engulfing or rejections).
Enter short with a target at 2,940, stop above FVG.
Let me know if you’d like help formulating a trade setup or risk management plan based on this.
Pales support boost 🚀 analysis follow)

Gold (XAUUSD) Bullish Reversal Setup – FVG Entry to EMA 200 ResiThis chart shows a potential bullish setup for Gold (XAUUSD) on the 15-minute timeframe, with some key technical elements and a projected trade idea. Here's a breakdown of the analysis:
1. Current Market Overview
Price: Trading around $3,038.51.
Trend: Recent downtrend followed by a minor recovery.
Indicators:
EMA 200 (Blue): Currently at $3,090.41, acting as a dynamic resistance.
EMA 30 (Red): Positioned below the EMA 200, indicating a still bearish trend but with potential for a pullback.
2. Key Zones & Labels
Limit Entry Zone: Highlighted around $3,025.72 (bottom purple zone)
Labeled as “LIMIT ENTRY”, indicating a potential buy entry.
This area corresponds with a fair value gap (fvg) — often used in smart money concepts as a sign of institutional interest.
Target Zone: Around $3,082.22 (top purple zone)
Labeled as “target point EA”.
Lies just below the EMA 200 resistance level, which is a likely take-profit area for a bullish move.
3. Projected Price Action
A possible bullish retracement is anticipated:
Dip into the limit entry/fvg zone at ~$3,025.
Then, a rally targeting the $3,082 zone, possibly extending toward the EMA 200 at ~$3,090.
4. Trade Setup (Based on the Chart)
Entry: Around $3,025.72 (limit buy)
Target: Between $3,082.22 - $3,090.41
Risk: Likely below the FVG zone (~$3,015–$3,020), depending on risk appetite.
Conclusion
This is a smart money concept-based setup anticipating a liquidity grab or fair value gap fill before a bullish move. The trade aims for a reversal at a key demand zone, with confirmation from EMA confluence above as a profit target.
Would you like help plotting stop-loss levels or analyzing the risk/reward ratio?

Goldman Sachs Raises Recession Odds to 35% Amid Tariff Fears Goldman Sachs (NYSE: GS) has lowered its S&P 500 year-end target again. The firm now sees the index ending at 5,700 points, down from its earlier forecast of 6,200. This revision comes just days before President Trump’s new round of tariffs is set to begin. The updated target implies only a 2% gain from Friday’s close of approximately 5,597.
Chief U.S. Equity Strategist David Kostin pointed to rising tariffs and slowing economic growth as key concerns. The revised forecast reflects a cautious outlook in light of economic risks. This is the second time Goldman has slashed its target this month.
At the same time, Goldman Sachs has raised its 12-month recession probability to 35%, up from a previous 20%. Chief Economist Jan Hatzius explained that higher tariffs and softening economic data contributed to the decision. Goldman now estimates the average U.S. tariff rate will rise to 15% in 2025, compared to an earlier projection of 10%.
Alongside these changes, the bank has cut its Q4 2025 U.S. GDP growth forecast to 1.0% from 1.5%. The adjustment follows weakening household and business confidence. Recent White House comments also suggest officials may accept short-term economic strain to pursue long-term trade objectives.
These developments reflect growing concern across Wall Street. Goldman’s 5,700 target ranks among the lowest of major forecasts. With markets already on edge, the new projection underscores broader fears over trade tensions and economic resilience.
Technical Analysis: Bearish Momentum Below $500
The S&P 500 has turned bearish after falling below a key support at $510. This level had held firm previously but now acts as resistance. The break and close below the key level signals strong bearish pressure and there is a possibility of more bearish momentum.
Price is currently trending lower towards the next potential support at $440. If it breaks below it, further drop could follow. The bearish pressure may continue unless the bulls defend the key support level.
However, if the bulls can finally defend the $440 level, it could potentially recover and target $510. In that case, the first resistance to overcome is $510. If it is also broken above, the next target would be the $592 resistance zone. A break above $592 could revive bullish momentum.
As of April 4th 2025, Goldman Sachs stock closed at $21.74, down 1.50% on the day. Investors await further updates ahead of the earnings report due April 14th 2025.

Perfect ending, gold trend analysis and layout for next weekEarly layout plan for gold: 3.31-4.4 Reviewing this week, a total of 20 layouts were arranged, and the overall harvest was 1245pips! This week can be called a super week. After the tariff fundamentals were implemented, the market started the callback mode, and there was a big sweep in the middle. It is unrealistic to say that we can win all the games. The number of mistakes we made this week has also increased. This is normal, but our eye-catching operations are even more dazzling, and we have gained more. Overall, I am quite satisfied. I will continue to work hard next week.
Analysis of gold market trends next Monday: Technical analysis of gold: The gold market on Thursday and Friday this week can be described as thrilling, with a rise and fall of more than 100 points in two days! The gold market suddenly changed, and there was an extremely violent sweep. First, it rose rapidly to 3136 without any signs, and then fell back quickly at lightning speed, and fell below the intraday low. After a series of big negative declines, the current short-term trend of gold is bearish. The daily line has a big negative downward trend, breaking the short-term moving average and piercing the middle track, leaving a lower shadow below. The pattern shows a bearish signal of Yin engulfing Yang. In the short term, it may rely on the support of the middle track to confirm the 10ma resistance and fall again. The 4-hour Bollinger band opens and extends downward. The K-line continues to decline, and the trend is bearish and downward. The callback space is larger than the rising space. Falling below the previous day's starting low of 3054 is a short-term empty point, and the lowest retracement is around 3015. The daily line is in a partial adjustment in the short term.
Combined with the falling wave space of the 4-hour chart. The 3000 integer mark is the support position of the golden section point 0.5. The 4-hour Bollinger Bands open downward, and the K-line continues to decline. The downward trend is obvious. The focus below is on the break of the 3000 mark. As long as the 3000 mark is held, the short-term bullish structure will not change. The market will continue to rise to new highs. If the 3000 mark is broken, the market will form a large-level adjustment structure. The short-term operation is mainly to buy on dips above 3000, and to sell at high altitudes. The upper resistance is around 3054-3057-3072, and the lower support is 3015-3000. On the whole, the short-term operation of gold next Monday is mainly to buy on rebounds, and to buy on callbacks. The upper short-term focus is on the 3054-3057 resistance line, and the lower short-term focus is on the 3000-3015 support line. Friends must keep up with the rhythm. It is necessary to control the position and stop loss, set the stop loss strictly, and do not resist the single operation. The specific points are mainly based on real-time intraday trading. Welcome to experience and exchange real-time market information ☎️, enter ✈️✈️ to follow real-time orders.
Reference for gold operation strategies on Monday:
Short order strategy: Strategy 1: Short gold rebounds near 3045-3055, stop loss 10 points, target near 3030-3015, break to see 3000 line.
Long order strategy: Strategy 2: Long gold pullback near 3015-3005, stop loss 10 points, target near 3030-3040, break to see 3050 line.

Gold (XAU/USD) Technical Analysis: SMC Trading point update
This chart is a technical analysis of Gold (XAU/USD) on a 4-hour timeframe. Here’s a breakdown
1. Ascending Channel:
The price is moving within an upward channel, showing a bullish trend.
Higher highs and higher lows confirm the uptrend.
2. Support and Resistance Zones:
Yellow Boxes: Key support zones where price previously consolidated before moving higher.
Red Arrows: Marking resistance zones where the price faced rejection.
Green Arrows: Indicating support levels where the price bounced.
3. Current Price Action:
Price recently dropped to a key support zone (around $3,050).
A bullish reaction is expected from this level.
If support holds, the price may continue the uptrend toward the target of $3,186.
4. Projected Move:
The black zigzag line suggests a potential bounce from support.
If the support level holds, price could move back up within the channel.
Mr SMC Trading point
Conclusion:
If price respects the support zone, there could be a good buying opportunity.
A break below the support zone would signal potential bearish movement.
Monitoring price action around the yellow zone is crucial for confirming direction.
Pales support boost 🚀 analysis follow )

Gold has been moving big recently, don’t hold it blindly!What is coming has come, more than 100 US dollars a day, the decline is always faster than the rise, and more fierce, after breaking the 3100 watershed, it accelerated downward, the current minimum is 3054, the key position below is 3000/3040, pay attention to the plunge and the card position can also participate in the long, but must be patient to wait for the position.
After the big drop, the stage high point appears, and the follow-up is that both long and short can participate. The first plunge only establishes the high point position, and it is not so fast to turn short. It will fluctuate for a period of time. Generally, major news is an opportunity. The evening news detonates the market, and the main force often uses the news to pull up shipments. If the rebound touches 3110-3120, short it.
