GOLD 1H CHART ROUTE MAP & TRADING PLAN FOR THE WEEKHey Everyone,
Please see our updated 1h chart levels and targets for the coming week.
We are seeing price play between two weighted levels with a gap above at 3260 and a gap below at 3217. We will need to see ema5 cross and lock on either weighted level to determine the next range. EMA5 is lagging below 3306 so will need a close above and then below to confirm.
We will see levels tested side by side until one of the weighted levels break and lock to confirm direction for the next range.
We will keep the above in mind when taking buys from dips. Our updated levels and weighted levels will allow us to track the movement down and then catch bounces up.
We will continue to buy dips using our support levels taking 30 to 40 pips. As stated before each of our level structures give 20 to 40 pip bounces, which is enough for a nice entry and exit. If you back test the levels we shared every week for the past 24 months, you can see how effectively they were used to trade with or against short/mid term swings and trends.
The swing range give bigger bounces then our weighted levels that's the difference between weighted levels and swing ranges.
BULLISH TARGET
3260
EMA5 CROSS AND LOCK ABOVE 3260 WILL OPEN THE FOLLOWING BULLISH TARGETS
3308
EMA5 CROSS AND LOCK ABOVE 3308 WILL OPEN THE FOLLOWING BULLISH TARGET
3340
EMA5 CROSS AND LOCK ABOVE 3340 WILL OPEN THE FOLLOWING BULLISH TARGET
3382
EMA5 CROSS AND LOCK ABOVE 3382 WILL OPEN THE FOLLOWING BULLISH TARGETS
3428
EMA5 CROSS AND LOCK ABOVE 3428 WILL OPEN THE FOLLOWING BULLISH TARGETS
3478
BEARISH TARGETS
3217
EMA5 CROSS AND LOCK BELOW 3217 WILL OPEN THE BEARISH TARGETS
3174
EMA5 CROSS AND LOCK BELOW 3174 WILL OPEN THE SWING RNGE
3126
3078
EMA5 CROSS AND LOCK BELOW 3078 WILL OPEN THE SECONDARY SWING RANGE
SECONDARY SWING RANGE
3034 - 2979
As always, we will keep you all updated with regular updates throughout the week and how we manage the active ideas and setups. Thank you all for your likes, comments and follows, we really appreciate it!
Mr Gold
GoldViewFX
Goldprediction

GOLD ROUTE MAP UPDATEHey Everyone,
Great start to the week with our Bullish target at 3260 hit, followed with ema5 cross and lock opening 3308. This was hit perfectly also completing this target.
We are now seeing ema5 lock above 3308 opening 3340. Any rejections on this zone will see price testing the lower Goldturns for suport and bonce inline with our plans to buy dips within the overall structure.
We will keep the above in mind when taking buys from dips. Our updated levels and weighted levels will allow us to track the movement down and then catch bounces up.
We will continue to buy dips using our support levels taking 20 to 40 pips. As stated before each of our level structures give 20 to 40 pip bounces, which is enough for a nice entry and exit. If you back test the levels we shared every week for the past 24 months, you can see how effectively they were used to trade with or against short/mid term swings and trends.
The swing range give bigger bounces then our weighted levels that's the difference between weighted levels and swing ranges.
BULLISH TARGET
3260 - DONE
EMA5 CROSS AND LOCK ABOVE 3260 WILL OPEN THE FOLLOWING BULLISH TARGETS
3308 - DONE
EMA5 CROSS AND LOCK ABOVE 3308 WILL OPEN THE FOLLOWING BULLISH TARGET
3340
EMA5 CROSS AND LOCK ABOVE 3340 WILL OPEN THE FOLLOWING BULLISH TARGET
3382
EMA5 CROSS AND LOCK ABOVE 3382 WILL OPEN THE FOLLOWING BULLISH TARGETS
3428
EMA5 CROSS AND LOCK ABOVE 3428 WILL OPEN THE FOLLOWING BULLISH TARGETS
3478
BEARISH TARGETS
3217
EMA5 CROSS AND LOCK BELOW 3217 WILL OPEN THE BEARISH TARGETS
3174
EMA5 CROSS AND LOCK BELOW 3174 WILL OPEN THE SWING RNGE
3126
3078
EMA5 CROSS AND LOCK BELOW 3078 WILL OPEN THE SECONDARY SWING RANGE
SECONDARY SWING RANGE
3034 - 2979
As always, we will keep you all updated with regular updates throughout the week and how we manage the active ideas and setups. Thank you all for your likes, comments and follows, we really appreciate it!
Mr Gold
GoldViewFX

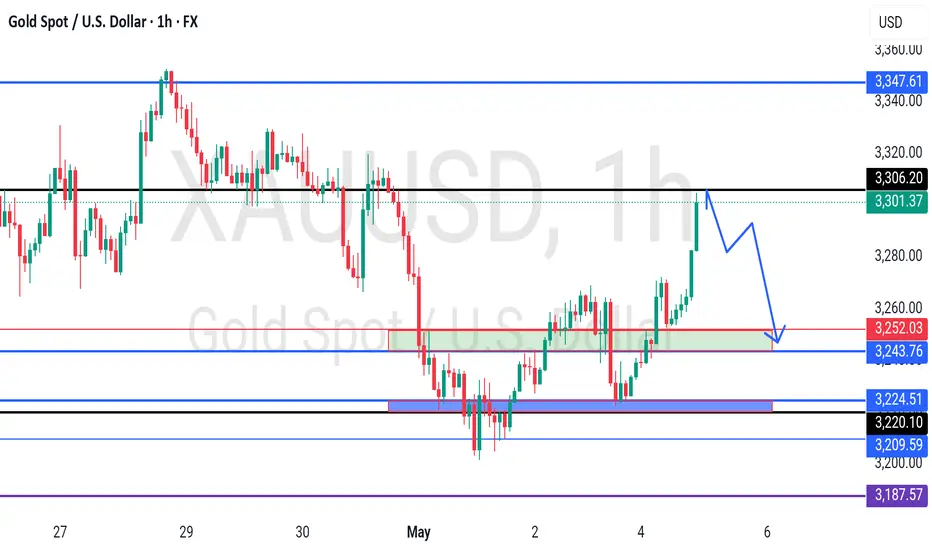
Gold Bear Flag in Play – More Downside Ahead?Last week was a strong one for Gold bears, with price dropping sharply and reaching a low near the 3200 mark.
A normal recovery followed, but the bounce is now facing pressure below the 3270 level – a former support that has now turned into resistance.
Current price action is forming a bear flag, a classic continuation pattern. If we get a break back below 3250, this could trigger a new leg down, targeting the 3170 support zone.
My outlook remains bearish, and I’m continuing to sell rallies into resistance, expecting this bear flag to resolve to the downside.
Disclosure: I am part of Trade Nation's Influencer program and receive a monthly fee for using their TradingView charts in my analyses and educational articles.

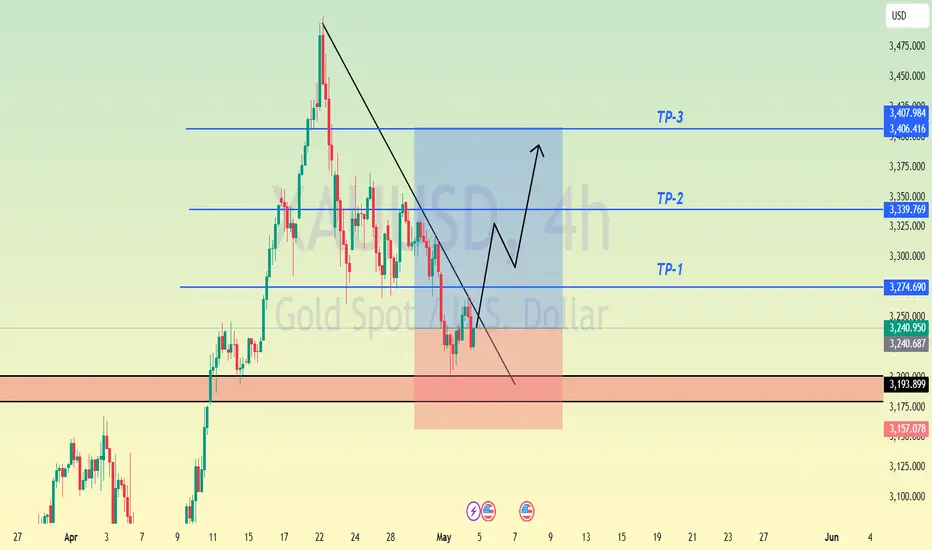
XAU/USD) Bullish reversal analysis Read The ChaptianSMC Trading point update
technical analysis of Gold Spot (XAU/USD) on the 4-hour timeframe, projecting a bullish outlook. Here's a breakdown of the main ideas conveyed:
1. Support Level & Double Bottom
A strong support level is marked around the 3,177 area, with the price bouncing from it twice (highlighted by two black dots), indicating a potential double bottom pattern, which is typically a bullish reversal signal.
2. EMA 200 Support
The 200 EMA (Exponential Moving Average) lies just below the current price (~3,177), acting as dynamic support. The fact that price is holding above it adds strength to the bullish argument.
3. Bullish Divergence on RSI
The RSI (Relative Strength Index) shows a bullish divergence, where the price made lower lows but RSI made higher lows—another potential reversal indicator.
4. Price Projection
If the bullish move plays out, the chart outlines two upward targets:
Target Point: ~3,501.67
Next Target Point: ~3,729.23
These are based on measured moves from previous impulse legs (shown by vertical blue projections).
5. Entry Setup
The chart suggests a break above the short-term consolidation could trigger the bullish run toward the first target, aligning with bullish price structure and support confirmation.
Mr SMC Trading point
---
Overall Idea: The chart expects a bullish reversal from support, confirmed by double bottom, EMA 200 support, and RSI divergence, targeting higher resistance zones.
Pales support boost 🚀 analysis follow)

GOLD DAILY CHART ROUTE MAP UPDATEHey Everyone,
Here’s the latest update on our daily chart idea, it’s been playing out perfectly!
The daily chart is unfolding as projected, with price action respecting the structure of the Goldturn ascending channel. A breakout above the channel was confirmed by the EMA5 crossing and closing above the upper boundary. This move extended to test the 3433 Goldturn axis level, where price met resistance. Notably, EMA5 failed to sustain a close above 3433 Goldturn level, confirming a lack of bullish momentum and validating a rejection. Price has since reversed, re-entering the channel.
Below, broader support is identified around 3104, which aligns with the channel’s half line. While this level may not be reached immediately, the current price range between 3297 and 3104 is significant. We may observe continued consolidation within this zone, with the half line gradually ascending. This dynamic could result in price interacting with the half line earlier than a direct move to 3104, providing potential bounce opportunities best monitored through lower timeframes for refined entries and validations.
This is the beauty of our Goldturn channels, drawn using weighted averages instead of pure price action. This unique approach helps us clearly identify fake-outs and real breakouts, cutting out much of the noise that usually confuses traders.
Moving forward, we’ll focus on smaller timeframes (1H and 4H) to buy dips off the weighted Goldturns, aiming for clean 30–40 pip moves. Ranging markets are perfect for this style, allowing us to capitalize on quick moves without getting caught in the chop of larger swings.
Thank you all again for your continued likes, comments, and follows, we truly appreciate your support!
Mr Gold
GoldViewFX

GOLD 4H CHART ROUTE MAP UPDATE & TRADING PLAN FOR THE WEEKHey Everyone,
Please see our updated 4h chart levels and targets for the coming week.
We are seeing price play between two weighted levels with a gap above at 3282 and a gap below at 3224. We will need to see ema5 cross and lock on either weighted level to determine the next range. We have a bigger range in play then usual.
We will see levels tested side by side until one of the weighted levels break and lock to confirm direction for the next range.
We will keep the above in mind when taking buys from dips. Our updated levels and weighted levels will allow us to track the movement down and then catch bounces up.
We will continue to buy dips using our support levels taking 30 to 40 pips. As stated before each of our level structures give 20 to 40 pip bounces, which is enough for a nice entry and exit. If you back test the levels we shared every week for the past 24 months, you can see how effectively they were used to trade with or against short/mid term swings and trends.
The swing range give bigger bounces then our weighted levels that's the difference between weighted levels and swing ranges.
BULLISH TARGET
3282
EMA5 CROSS AND LOCK ABOVE 3282 WILL OPEN THE FOLLOWING BULLISH TARGET
3343
EMA5 CROSS AND LOCK ABOVE 3343 WILL OPEN THE FOLLOWING BULLISH TARGET
3404
EMA5 CROSS AND LOCK ABOVE 3404 WILL OPEN THE FOLLOWING BULLISH TARGET
3439
EMA5 CROSS AND LOCK ABOVE 3439 WILL OPEN THE FOLLOWING BULLISH TARGET
3503
BEARISH TARGETS
3224
EMA5 CROSS AND LOCK BELOW 3224 WILL OPEN THE FOLLOWING RETRACEMENT RANGE
3190
3138
EMA5 CROSS AND LOCK BELOW 3138 WILL OPEN THE SWING RANGE
SWING RANGE
3088 - 3046
EMA5 CROSS AND LOCK BELOW 3046 WILL OPEN THE SECONDARY SWING RANGE
SECONDARY SWING RANGE
3015 - 2988
As always, we will keep you all updated with regular updates throughout the week and how we manage the active ideas and setups. Thank you all for your likes, comments and follows, we really appreciate it!
Mr Gold
GoldViewFX

GOLD WEEKLY CHART MID/LONG TERM ROUTE MAPHey Everyone,
Quick update on our weekly chart idea, it's been playing out beautifully, helping us track the move down and catch the move back up.
The weekly chart structure is unfolding in line with prior analysis. Price action reached the upper boundary of the ascending Goldturn channel and temporarily broke above it; however, the EMA5 remained confined within the channel, validating the upper trendline as dynamic resistance.
A sustained EMA5 breakout above the channel would have confirmed a potential continuation of the breakout. Currently, price is consolidating within the Goldturn channel, with the 3189 level acting as immediate support. The channel half line of the channel may serve as a stronger swing support area, though price may not retest this level immediately. As the channel continues its upward trajectory, the midline will also rise, potentially aligning with price in future upward movements.
This is the beauty of our Goldturn channels, drawn using weighted averages instead of pure price action. This unique approach helps us clearly identify fake-outs and real breakouts, cutting out much of the noise that usually confuses traders.
Moving forward, we’ll focus on smaller timeframes (1H and 4H) to buy dips off the weighted Goldturns, aiming for clean 30–40 pip moves. Ranging markets are perfect for this style, allowing us to capitalize on quick moves without getting caught in the chop of larger swings.
Thanks again for all your likes, comments, and follows, we really appreciate the support!
Mr Gold
GoldViewFX

Gold Completes Wave 4 - Pullback – Time for the Next PushGold ( OANDA:XAUUSD ) touched $3,223 as I expected in the previous idea (Full Target) .
Gold has managed to break the Resistance zone($3,308-$3,293) and is trying to break the Resistance lines and complete the pullback .
In terms of Elliott wave theory , it seems that Gold is completing microwave 4 , which could act as a pullback to the broken Resistance zone($3,308-$3,293) . After the completion of microwave 4 , we should expect Gold to attack the Resistance lines to complete microwave 5 .
I expect Gold to rise to at least $3,232 , and if the Resistance zone($3,387-$3,357) breaks, we can expect further gains .
Note: If Gold touches $2,272 (the worst Stop Loss(SL)), we can expect further declines.
Gold Analyze ( XAUUSD ), 1-hour time frame.
Be sure to follow the updated ideas.
Do not forget to put a Stop loss for your positions (For every position you want to open).
Please follow your strategy; this is just my idea, and I will gladly see your ideas in this post.
Please do not forget the ✅' like '✅ button 🙏😊 & Share it with your friends; thanks, and Trade safe.

XAUUSD: Price Mitigated Earlier, We Got Left Behind! Hey Everyone
Happy Friday
So, yesterday, we were expecting gold prices to dip down to around 3172. But guess what? It didn’t quite go as planned! The price took a nosedive from 3208 and is currently sitting at 3260, almost 520 pips move.
It’s not always going to be a smooth ride, so let’s not get discouraged. We can focus on analysing this chart and keeping an eye on the price as it moves.
Once the trade is activated, there are two targets you can set. You can choose your own take-profit based on your analysis and trade management.
Good luck and trade safely! 😊
Thanks a bunch for your unwavering support! ❤️🚀
If you’re feeling generous, here are a few ways you can help us out:
- Like our ideas
- Comment on our ideas
- Share our ideas
Cheers,
Team Setupsfx_
❤️🚀

Can we get a leg lower on XAUUSD?Hi fellow traders, XAUUSD will be ready to make a move lower from the golden pocket within the blue box after completing the correction. Target the 3195.03 level. Good luck and trade safe!

GOLD Price Analysis: Key Insights for Next Week Trading DecisionGold ended last week under pressure as investors booked profits following improved risk appetite, driven by easing trade tensions and a strong U.S. labor market report.
📰 NFP came in at +177K in April, with the unemployment rate steady at 4.2%, matching forecasts—possibly keeping the Fed cautious on policy easing.
Technically, Gold remains bullish but is now testing the $3,200 support zone, and sellers are gaining momentum.
As we head into next week, gold price action is at a critical decision point, and whether buyers or sellers will take control is unclear.
In this video, I break down the key technical zones, share my trading plan, and discuss potential opportunities to help navigate the uncertainty ahead.
Disclaimer:
This is my take based on experience and what I see on the charts. It’s not financial advice—always do your research and consult a licensed advisor before trading.
#GoldAnalysis #XAUUSD #GoldPrice #ForexTrading #TechnicalAnalysis #FundamentalAnalysis #GoldOutlook #FedRateDecision #NFP #GoldBreakdown #GoldBulls #GoldBears #USJobsReport #ForexMentor

Gold Market Outlook – Upcoming FED Decision & Trading StrategyAs we head into the upcoming week, all eyes are on the Federal Reserve's interest rate decision, which is a major catalyst for gold. This event could significantly influence gold’s direction — either fueling the ongoing bullish trend or triggering a pullback.
🔎 Current Technical Outlook:
Gold is currently showing strong bullish momentum across higher timeframes.
Liquidity targets remain above, with key zones likely to be breached via wicks or trendline taps.
Given the uncertainty around the news and macro factors, we’ll execute trades only on confirmed setups from lower timeframe's confirmation.
📌 Trade Plan:
Open 50% of the position at $3160,
an inevitable level which is a critical level backed by technical confluence.
Enter remaining positions based on lower timeframe confirmation.
📝 Supporting Fundamentals:
COT (Commitment of Traders) Report indicates an increase in net long positions on gold.
$3160 is highly probable — we anticipate price to tap this zone.
The U.S. has significantly increased gold imports, reflecting strategic accumulation.
Smart money has taken partial profits, but large bullish positions are still being held.
Expectation: A sweep of major liquidity levels, followed by a continuation of the bullish trend.
Stay sharp and disciplined. Wait for confirmation before adding full exposure.

GOLD - reached at today resistance? What's next??#GOLD - perfect bounce above our area as we discussed in our video analysis.
Now market just reached at his today resistance area that is around 3302-05
Keep close it and if market holda then drop expected
Good luck
Trade wisely
Gold pullback continues to see bulls
In my first article today, I reminded everyone to be careful that gold will stand above the 3300 mark again.
And I also told you to rely on 3255-50 to do more, looking at the upper 3280 and 3300 positions.
Sure enough, after the opening of the European session, gold has made rapid progress, and the highest has reached above 3300 so far.
I also notified the real-time students to enter the market and do more near 3255 during the Asian session, and directly gave the target position of 3300.
At present, the target position of 3300 has been perfectly reached, and I also made a profit of more than 55 US dollars.
From the current 4-hour chart:
It can be found that gold is now completely above the trend line.
The only suppression position above is currently around 3350.
The support below is currently located at 3275-85.
If gold does not retreat, then the upper side will directly test the suppression near 3350.
On the contrary, if gold chooses to retreat next, then just focus on 3275-85.
As long as gold retreats and stabilizes in the 3275-85 range, you can directly enter the market and go long.
Continue to look at 3350 from above. If it breaks through and stabilizes above 3350 in the future, you will see the 3380-3420 range.

There are short-selling opportunities in gold in the short term!
After gold rebounded, there was strong pressure around 3315, so it was a short opportunity, sl: 3325, tp: 3290

USDJPY Analysis week 19🌐Fundamental Analysis
Signs of rising inflation in Japan still open the door for the BoJ to tighten interest rates further. Moreover, persistent geopolitical tensions and uncertainty over US President Donald Trump’s trade policies have kept investors on edge. Moreover, bets on more aggressive easing by the Federal Reserve will limit any meaningful gains in the dollar and help limit deeper losses for the lower-yielding yen.
🕯Technical Analysis
After a breakout and bounce late Friday, USDJPY is looking to continue its strong uptrend. Last week’s high of 145.900 will act as a temporary buffer before the pair heads towards the weekly resistance around 148.000. On the other side, last week’s liquidity sweep converging with the trendline also creates an important buying zone for the week if the pair reverses. The support level that the bears are strong at is also the weekly support level of interest around 142.000.
📈📉Trading Signals
SELL USDJPY 148.000-148.200 Stoploss 148.500
BUY USDJPY 142.000-141.800 Stoploss 141.500

Gold Will be Bullish from a Historic Support LevelHello Traders
In This Chart GOLD HOURLY Forex Forecast By FOREX PLANET
today Gold analysis 👆
🟢This Chart includes_ (GOLD market update)
🟢What is The Next Opportunity on GOLD Market
🟢how to Enter to the Valid Entry With Assurance Profit
This CHART is For Trader's that Want to Improve Their Technical Analysis Skills and Their Trading By Understanding How To Analyze The Market Using Multiple Timeframes and Understanding The Bigger Picture on the Charts
(XAU/USD) Bullish Trade Setup – Targeting $3,506.52 with Entry aEntry Point: $3,221.19
Stop Loss: $3,169.80
Resistance Zone: Around $3,277.98 to $3,280.64
Target (TP) Point: $3,506.52 (Approx. 9.05% upside)
📊 Technical Indicators and Markings:
Moving Averages:
Likely a 50-period (blue) and 200-period (red) moving average.
Price is currently below both MAs, signaling a short-term downtrend.
Support & Resistance Zones:
Strong support around $3,207.67–$3,221.19 (entry area).
Resistance at $3,244.25–$3,280.64.
Stop-loss is strategically placed below support to limit downside risk.
Target Area:
Projected upside target is $3,506.52, with a potential 9.05% gain from the entry.
This is marked as the EA (Expert Advisor) Target Point, possibly suggesting this is a strategy from an automated trading system.
Orange Circles:
Likely indicate swing highs and lows, used to identify trend patterns and potential reversal points.
📈 Trading Idea Summary:
Bullish Setup: Buying at support, aiming for breakout above resistance to reach target.
Risk-Reward Ratio: Favorable, assuming price holds above $3,207.
Watch for Confirmation: Price needs to break above resistance around $3,280 for momentum continuation.

GOLD / XAUUSD: Breaking the down channel (correction wave)Therefore, if the 21-day SMA holds in the event of a weak US Non-Farm Payroll (NFP) report, a rebound toward the immediate static support-turned-resistance at 3260 could occur.
A sustained move above that level would encourage Gold buyers to push further toward the former channel support, now acting as resistance, at 3405.

Let's wait for gold to break new highs
Today, the price of gold bottomed out and rebounded, breaking through the expected dividing point of 3260.
At this time, many traders need to learn to adjust their thinking.
If it is a retracement, on the one hand, the price will not break through and open a decline, and on the other hand, after the force is too strong, it must be a position adjustment and a reverse long.
Even if you don’t go long, you can’t go short easily. In many cases, the rules of trading must be followed.
The second rise from the low point to the high point just corrected the 382 support 3252 and continued to rise and break the high. It depends on whether you have the courage to enter the market.
The intraday increase of 80 US dollars +, today there is only one idea, continue to go long;
The support level refers to 3210 and 3215, you can go long in batches, with 3290 as defense, and continue to watch the gold price break high!
After the strength, there will be a second high point!
Thank you dear traders for reading, if you like it, please tell me

How to plan when gold’s rise encounters resistance🗞News side:
1. Pay attention to the recent trade situation and news about the Fed's interest rate cuts
2. Be wary of DXY trends
3. The situation of the Russian-Ukrainian war and the follow-up events of the India-Pakistan conflict
4.Trump imposes 100% tariff on non-US films
📈Technical aspects:
Compared with today's market, the morning rise happened to be a sideways price, breaking through the previous high point. In a volatile rise, it doesn't matter. It is very likely that in the later trend, the price will return to the starting point or even lower, but it can continue to rise. This is a feature of the shock. At the same time, the current market is not extremely strong, and it is still in a volatile rise. Therefore, do not chase long, but retrace as much support as possible.
🎁SELL 3315-3325
🎁TP 3280-3270
🎁BUY 3270-3280
🎁TP 3300-3310
If you agree with this point of view, or you have a better idea, please leave a message in the comment area. I look forward to hearing different voices.
OANDA:XAUUSD FX:XAUUSD FXOPEN:XAUUSD FOREXCOM:XAUUSD TVC:GOLD

GOLD SWING XAUUSD took support form bottom - up Line.
All long targets are achieved
This month taking rejection from major resistence,
Let's track the moves from Top down line.
Follow for more swing analysis for INDICES - CURRENCY - COMMODITIES

Is the gold market ushering in betting?
📌 Gold driving factors
There are two aspects to look at the impact of April non-agricultural data on the gold market.
One is the data itself and the existing economic environment, and the other is combined with the technical aspect.
The market itself is troubled by the tariff issue. Whether it is the US stock market or the US dollar, it needs good economic data to boost it. Once the April non-agricultural performance is poor, the market sell-off will be out of control, and it also means that the risk of US economic recession is increasing.
Secondly, good data performance reduces the Fed's expectations for rate cuts. As we all know, the Fed's expectations for rate cuts or rate cuts are theoretically good for gold prices, and vice versa.
The cooling of the tariff issue may come soon, which is also not conducive to the rise in gold prices, but cooling does not mean the end, and the final achievement will definitely take some time.
📊Comment Analysis
"After experiencing short-term fluctuations, the price of gold appears to be relatively stable around $3,250. If it is to rise further, it must break through the $3,300 mark. But whether the market is ready to break through this point remains to be seen."
At present, gold is still in a continuous adjustment trend. Although it retreated to the 3,200 line on Friday and then rose again, it is still under pressure below the opening of the 3,265 decline. This is also the pressure level we need to pay close attention to next Monday!
The sideways trading period on Friday is long enough, and it is time for a breakthrough. So how should we arrange the market next week? It should not rise, but it will fall instead. It is not difficult to understand the trend on Friday. If it rises in the morning next week, it should be noted that the upper 3,265 is the watershed. If it breaks through, it will continue to rise, but if it is still under pressure, it is our opportunity to enter the short position!
💰Strategy Package
Operation ideas for next week:
Short at 3265 gold, stop loss at 3275, target 3230-3220;.
The market fluctuates violently, and real-time entry and exit are mainly based on real-time guidance!
⭐️ Note: Labaron hopes that traders can properly manage their funds
- Choose the number of lots that matches your funds
- Profit is 4-7% of the fund account
- Stop loss is 1-3% of the fund account
