Gold fluctuates in a wide range, and the short-term trend is upwGold fell by $240 in two trading days, but the rebound was also very fierce, from yesterday's low of 3260 to 3367 in the early trading. The current volatility is still very large. The high and low points of $100 often appear, and it is normal to fluctuate by dozens of dollars. So pay attention to the market. There is no shortage of opportunities. Just grab what you can grasp.
The daily cycle has stepped back to the MA10 position. It has entered a critical stage. If the bulls recover, the strong rhythm is still there. It is too early to say that the peak has been reached. Pay attention to follow the market and don't be stubborn. The short-term resistance is 3386 and the 618 position of the decline and rebound is 3408. It is recommended to wait and see in the European session and look at the trend. Intervene in the US session.
Goldprediction

Gold Analysis April 24D1 candle closed with a sharp decline of nearly 100 prices
And today's opening with a price gap of more than 100 prices shows the instability of the market.
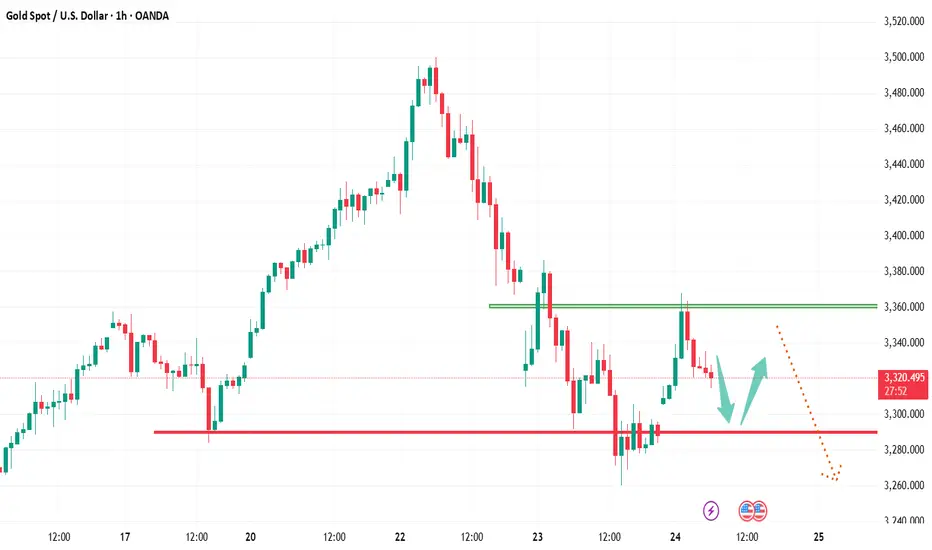
Returning to the h1 time frame wave will be easier to grasp. At the beginning of the European session, the market decided that the buyers won and are pushing up from 3322. Pay attention to the immediate area of 3340. If it breaks at the end of the European session, continue to wait for the price reaction at 3363. If it doesn't break, you can SELL. In the opposite direction, if it breaks 3363, wait for 3384 for the SELL strategy.
The BUY strategy is focused on the European session's price push zone of 3322. When it breaks, pay attention to the GAP opening zone this morning at 3295 and the bottom zone yesterday at 3266

GOLD Goes "Buy The Dip", Following 200-hour SMA Major SupportGold prices have experienced significant volatility over the last days, with conflicting reports on the current trend. According to some sources, gold prices have increased, with spot gold reaching $3,500 per troy ounce, new all the history high on Tuesday, April 22, 2025.
The $3,500 milestone has sparked increased interest from investors and market analysts, meaning that Gold spot doubled in price over the past 5 years, 3rd time in history ever.
Despite the short-term volatility, gold has shown a strong performance since the beginning of 2025, with an increase of approximately 30-35% year-to-date. Market analysts remain bullish on gold, with some forecasting prices to reach $ 4'000 per ounce in the near term.
The main 1-hour Gold spot OANDA:XAUUSD graph indicates on 200-hours SMA technical support, with further upside opportunity due to forming on the chart descending triangle (flat bottom/ descending top) breakthrow.
--
Best #GODL wishes,
💖 Your Beloved @PandorraResearch Team

Gold profit taking continuesThe gold market opened at 3337.5 yesterday due to the profit-taking of the previous day. After the market fell back to 3315.6, the market rose strongly to fill the gap. The daily line reached a high of 3386.7 and then fell strongly. The daily line reached a low of 3259.6 and then the market consolidated at the end of the day. The daily line finally closed at 3287.9 and the market closed with a long upper shadow line. After this pattern ended, today's market continued to be empty. In terms of points, the short positions at 3496, 3468 and 3442 the day before were reduced and the stop loss was followed up at 3400.
SELL:3340 45 50 Stop loss: 55
TP1:3330
TP2:3320
TP3:3300

Gold Price Analysis April 23Candle D has a clear bearish confirmation and the 4-line structure is being continuously sold, leading to the gold price falling nearly 200 prices from ATH.
Today's strategy will mainly be SELL following the market trend. At the end of the European session, the price breaks 3319, then wait for a retest to BUY up towards the resistance zones of 3379 - 3345. If it does not break 3319, then SELL Gold back to 3275 and 3247. Pay attention to the price reactions in the chart areas to have a reasonable BUY and SELL strategy.

Gold may continue to fall in the short term
Trading sometimes does require some luck, but in the long run, good luck and bad luck will offset each other. To continue to succeed, you must rely on skills and apply good principles. Always remember; "Trading gold: half science, half art, all discipline."
📌 Driving events
The continued uncertainty of President Donald Trump's tariff policy and its broader impact on global economic growth have exacerbated market anxiety. These factors have triggered a new wave of safe-haven demand, pushing investors back into the gold market.
📊Commentary analysis
Gold prices are still facing selling pressure and are consolidating below the downward trend line. Trading prices are around 3,300 or lower.
💰Strategy Package
Short position:
Participate around 3320-30 points, profit target around 3290-80 points
⭐️ Note: Labaron hopes that traders can properly manage their funds
- Choose the number of lots that matches your funds
- Profit is 4-7% of the fund account
- Stop loss is 1-3% of the fund account
GOLD → Holdings are still insufficient, and there is still potenThe gold market has pulled back sharply one day after hitting an intraday record high of more than $3,500 an ounce. But Quaid believes that the gold rally is far from over as gold is severely under-owned and still cheap by some indicators.
Investors may see some short-term volatility as gold's parabolic move above $3,400 an ounce has made it "overbought at certain technical levels." However, overall, gold is still widely ignored by investors.
This could be a good technical target for gold. Comparing historical gold prices to the cost curve, the ratio shows that we can go further.
Although the opportunity cost of holding gold will remain high, gold remains an important safe-haven asset.
While a large number of investors continue to ignore gold, there is one group in the market that is buying as much of the precious metal as possible, and that is central banks.
Central banks will continue to buy gold as they question the reliability of the United States as a trading partner. The dollar is still weakening despite the selling of long-term U.S. bonds. This shouldn't happen, so there are definitely signs that not all US Treasuries are traditional safe-haven assets, and gold will benefit from this.
I hope this comprehensive analysis by Quaid can help all traders.
If you have other ideas, please leave a message to Quaid and we will discuss its trend together.

Is the gold price rally over?Market news:
In early Asian trading on Thursday (April 24), spot gold rebounded sharply and is currently trading around $3,355/ounce, supported by bargain hunting. London gold prices continued to fall from record highs on Wednesday, falling nearly 3% to a low of $3,260/ounce, a stunning plunge. U.S. President Trump's remarks not only appeased investors and encouraged risky assets, but also hit international gold. Due to the possible easing of tensions between China and the United States, and U.S. President Trump's statement that he does not intend to fire Federal Reserve Chairman Powell, risk appetite has improved, the overall financial market atmosphere has improved, and the U.S. dollar has also rebounded from Trump's criticism of Powell for not cutting interest rates for several consecutive days. This has suppressed gold prices. After gold prices were blocked and fell back at the 3,500 mark, more short-term long profit-taking also dragged down international gold prices. This trading day will release the initial monthly rate of durable goods orders in the United States in March and the number of initial jobless claims in the United States as of the week ending April 19. Investors need to pay attention to them. In addition, they need to continue to pay attention to relevant news about the international trade situation and geopolitical situation.
Technical Review:
Gold Since 2025, the bull market of gold has been obvious. In just one quarter, it has reached the 3500 mark, and the increase has jumped by about 30%, which further illustrates the severe global economic situation and the risks brought by regional political turmoil, thus prompting investors to choose to buy gold to avoid inflation! After the gold white plate fell yesterday, the European plate continued to adjust widely, and the long and short battles were obvious. Subsequently, the short-term correction continued to intensify. The United States was afraid of breaking down again to 3260, the largest correction from the recent high! As time goes by, Huang is facing the closing of the monthly and weekly lines today. In the short term, we believe that the correction is likely to end soon, and there will be another pullback at any time. Pay attention to the 3380 inflection point for the pullback, and the inflection point breakthrough will be tested again at any time! At present, from the market, we can clearly see that the long-term gold bull market is not reduced. The short-term correction may be for better stretching later. Therefore, we should pay attention to the correction strength in the short term. From the 4-hour chart, the current long MACD of Huang Jin is gradually decreasing, and it is about to switch to short position. However, the KDJ indicator signal bottom divergence, and the big golden cross is expected. Obviously, the most important thing is to look at the Asian market trend and the closing of the next white market of gold!
Today fenxi:
The gold daily line fell by 240 US dollars in a row. At present, 3500 is temporarily under short-term pressure. Whether the adjustment is over or not is still uncertain. The short-term 4-hour middle track 3380 has been lost and has become a key counter-pressure point. As long as it does not stand on it again, it will maintain a downward correction. After breaking 3292 below, it is the 66-day moving average of 3260 to see the loss! The 1-hour K-line was under pressure from ma10 and ma5, and continued to fall. After last night’s consolidation and pull-up, the K-line is now running above ma10 again, and the macd is under the zero axis. This wave of 200 US dollars’ rapid decline has almost corrected most of it. If it continues to fall, or with the help of bottom divergence, it will slowly brew a short-term bottom! Today is also a critical day for gold. After the bottom of 3260, will the adjustment end and continue to rise, or will it just rebound? Then today’s strength is very important. If gold continues to rise directly today without a major correction, it means that gold may start to fluctuate and rise again.
Operation ideas:
Short-term gold 3315-3318 buy, stop loss 3306, target 3360-3380;
Short-term gold 3387-3390 sell, stop loss 3400, target 3320-3330;
Key points:
First support level: 3326, second support level: 3300, third support level: 3288
First resistance level: 3350, second resistance level: 3376, third resistance level: 3400

XAU/USD(20250424) Today's AnalysisMarket News:
The United States hit a 16-month low in April. The total number of new home sales in the United States in March was an annualized to a new high since September 2024.
Technical analysis:
Today's buying and selling boundaries:
3311
Support and resistance levels:
3436
3389
3359
3263
3233
3186
Trading strategy:
If the price breaks through 3311, consider buying, the first target price is 3359
If the price breaks through 3263, consider selling, the first target price is 3233

Early Asian session. Latest market analysisIn early Asian session, spot gold rebounded slightly and is currently trading around $3,345/oz, supported by bargain hunting. The U.S. session continued its trend of retreating from record highs, falling nearly 3%, hitting a low of $3,260.08/oz and closing at $3,288.18/oz.
People familiar with the matter revealed that the Trump administration is considering reducing tariffs on imports from Asian powers, adding that any action would not be unilateral.
Quaid Analysis:
People are very relieved about the possibility of negotiations between major powers, and we are seeing this trend have a significant impact on the market.
Driven by central bank buying, tariff war concerns and strong investment demand, gold prices have risen by more than 26% since the beginning of 2025. A large number of long orders are facing profit-taking needs, and investors need to beware of the risk of further correction in gold prices.
From a technical perspective, gold prices hit $3,500, soared before this level, and then reversed sharply, which increases the risk of further correction in the short term.
The preliminary monthly rate of durable goods orders in the United States in March and the number of initial jobless claims in the United States for the week ending April 19 will be released on the Asian trading day. Investors need to pay attention to them. In addition, they need to continue to pay attention to the relevant news on the international trade situation and the geopolitical situation.
Action suggestions:
Go long at 3345, stop loss at 3340, watch 33380
If Quaid's analysis can help traders, then Quaid will be very happy.

XAUUSD Market Update – April 23, 2025“Bulls Are Alive, But Not Rushing – Gold Builds in Discount Trenches 🏗️🟢”
🔍 Macro + Context
HTF Bias: Still bullish. Daily candle shows strong rejection wick from below 3280 → bulls defending structure.
LTF Flow: Bearish → Clean CHoCH + BOS chain (H1–M15) from 3455 ATH zone → currently building base.
Current Price: ~3294
RSI: Starting to climb from oversold on M15–M30 → first hints of a potential shift.
📈 Confirmed Structural Updates
🔻 Sell Zones (Premium)
Zone Range Type Confluences
🔴 3450–3455 ATH Supply HTF OB + 1.618 Fibo Liquidity + Rejection Block
🔴 3414–3422 NY Session OB Retest Zone M30 OB + Last Reaction High
🟠 3380–3395 Flip Zone H1–M30 Rejection Block EMA Lock + FVG + CHoCH
🟢 Buy Zones (Discount)
Zone Range Type Confluences
🟢 3280–3288 LTF Demand Reentry Zone M5-M15 OB + Recent Wick Defense
💚 3220–3235 HTF Demand Stronger Demand Zone H4 OB + D1 EQ zone + Weekly Pivot
🔵 3170–3190 Extreme Discount Long-Term Zone Untapped FVG + D1 OB
⚙️ Current Price Action
📍Price rejected perfectly from the 3260s → defended with strong wick, now reclaiming M15 internal CHoCH.
🟣 M5 showing micro BOS + reclaim of 9EMA → potential for bullish continuation toward 3320–3333.
⚠️ Flip Zone at 3380–3395 remains a major short-term decision level. If price breaks above it, we’ll be in recovery mode toward 3415.
🎯 Session Outlook
Buyers in control short-term if price holds above 3280.
Next key reaction expected at 3320–3333 minor resistance → if broken, bulls might retest 3385+.
Sellers may reengage hard at 3380–3395 or above (3422, 3455).
🧠 Smart Money Snapshot
🟢 Liquidity swept below 3280 = engineered low
🟠 Internal CHoCH on M5 confirmed → LTF bullish short-term
🔴 Next sell interest likely around 3385 or 3415 unless HTF flips bullish again
XAUUSD – News & Risk Preview for April 24, 2025
Claims & Chaos?🧨📉📈
🔍 What’s Coming:
🧾 Unemployment Claims (USD) – 14:30 UTC+2
➤ Expected spike in volatility. Watch for algo-driven whipsaws if numbers surprise (especially under 200k or above 250k).
➤ Low claims = strong USD = potential XAU drop.
🧠 Tactical Advice for Thursday:
Avoid full-size entries→ spikes can violate structure briefly before returning.
Focus on reaction-based trades: let price show direction after the event, then join.
Best plan: pre-mark levels now, react later.
🗣️ Final Note
This market update reflects structure-only precision, no emotional bias. If bulls want back in, 3280–3290 is the launchpad. If not, sellers are watching 3385+ like hawks. 🦅

Gold peaked and plummeted, entering a correction mode!Analysis of gold market trend:
Technical analysis of gold: Today, the highest price of gold is 3386, and the lowest price of US market is 3260, which is also a drop of 126 points. Although gold has continued its decline, it is not like yesterday. The decline is accompanied by a rebound. The trend of Asian market is a back and forth, and the trend of European market is also a back and forth. Needless to say, the US market fell after the opening and the current rebound, the overall rhythm is bearish, but it is not as clean as Tuesday. This trend reflects the opposition of market sentiment. After the risk aversion subsided, the gold price fell from the high of 3500, but after the long position was sold at a high level, some people still took over at a low level, so it led to a rebound trend after the decline.
Now from the daily chart, the daily K is likely to close with an upper shadow line as on Tuesday. Now the upper shadow line has been formed, so the closing price should be below the opening price of 3320. Now we need to pay attention to whether the lower shadow line can continue to spread downward. In other words, after this wave of rebound in the US market, there will be another wave of decline, and there will be a small rebound; returning to the short-term trend, in 1 hour, after the gold price fell below the two key positions of 3356 and 3285 today, the support moved down to around 3245. Although there was a rebound in the US market, it is likely to go to the range of 3228 to 3245 before rebounding, so the support references are 3260 and 3245; on the other hand, the resistance level, now the gold price pierces 3285 and then rebounds, and is now trading near this. The only reference is 3315 in the Asian session, and then up is the European session rebound high of 3340. If it is effectively crossed here, the bearish outlook will be suspended.
The direction of the end of the session is bearish. The steady operation is to intervene in short orders near 3320 to protect the area near 3330. Of course, you can intervene in short orders near 3310 to see if it can reach the range of 3260 to 3245. This is up to you. Even if it touches this range and rebounds later, I do not recommend participating in long orders. Overall, today's short-term operation strategy for gold is to focus on rebound shorting. The short-term focus on the upper side is 3315-3320 line resistance, and the short-term focus on the lower side is 3260-3245 line support. Friends must keep up with the rhythm.

The rise of the US dollar index suppressed gold.From the perspective of technical analysis, the gold daily chart shows a large negative line pattern and then forms an inverted hammer reversal prototype structure. Today, the key support level below has moved down to the 3300 integer mark area. In the US hourly chart cycle, after the gold price short-term touched the price of 3290 US dollars/ounce, the technical indicators showed oversold repair characteristics, suggesting the existence of technical rebound momentum. The upper resistance level of the current price range is locked in the 3350-3360 US dollars/ounce area, and the core defense level below is still 3300 US dollars/ounce. I think if this support level is effectively broken, it may trigger a technical bottoming out of the price in the 3250 US dollars/ounce area.
It is worth noting that the US dollar index has a short-term technical retracement. This kind of currency market fluctuation may provide a phased rebound support for the gold price through the exchange rate transmission mechanism. However, we need to be alert that the gold price has fallen below the 23.6% Fibonacci retracement level of the upward trend started from $2,900/ounce. If the 38.2% retracement level of $3,289/ounce is confirmed to be lost, it may trigger the resonance of technical stop loss orders and programmatic trading systems, forming further selling pressure. The current market structure shows typical characteristics of long-short game. It is recommended to pay close attention to the significance of gains and losses of $3,300/ounce for trend judgment.
Operation strategy: 1. It is recommended to short gold when it rebounds around 3,310, with the target at 3,290.3250

How is gold going? What to do now?After reaching the psychological high of $3500, it entered a correction phase, which was also affected by the slight easing of the US-China tariff conflict...
After failing to hit the 3250 area of concern, gold prices will be slightly stronger. Meanwhile, the market is looking forward to the US PMI data. Earlier, gold prices hit an all-time high of $3500, but fell back on hopes of a easing of the US-China trade war and the US Treasury Secretary's remarks about a possible "detente".
The dollar recovered in the correction, but investors doubted Trump's predictability and gold prices began to pull back at this time. The focus is on the S&P Global PMI index: the results of this index may affect expectations for the federal funds rate and bring a new direction to the market.
From a technical point of view, gold prices are in a correction and confirm the bearish structure. But any unexpected remarks from Trump may attract a lot of buying.
Quaid data analysis:
Upward resistance: 3340, 3360
Downward support: 3280, 3250
Quid believes that buying can be considered when retesting the support level or closing above 3370.
Traders, do you agree with Quaid's idea? Please leave your thoughts. I'll be happy that way.

Gold once fell below the 3,300 mark, can it rise again?
📌 Driving Event
Spot gold (XAU/USD) once fell below the 3,300 US dollar mark, a significant correction from the previous historical high of nearly 3,500 US dollars. The market's risk appetite has increased, making the attractiveness of safe-haven assets weakened in the short term. However, repeated news about the direction of US policy and the Fed Chairman's movements may still affect the market in the medium and long term.
📊Comment Analysis
From the perspective of market sentiment, the strong rise in gold prices in the early stage mainly relied on safe-haven demand and speculation about subsequent monetary easing. However, the short-term trend has led to some profit-taking in safe-haven assets due to the recovery of the equity market. This change in sentiment reflects the current market's optimism and caution about the US macroeconomic environment: once risk appetite weakens again, gold may be supported again; if risk appetite continues to rise, gold prices may continue to retreat.
Overall, the market is in a state of repeated game, and sudden news can easily lead to large fluctuations in gold prices, and we need to continue to pay attention to the evolution of risk sentiment.
✅ Outlook for the future
Short-term outlook: In the case of short-term technical continuation signals, gold prices may remain weak, and the support around $3,300 and $3,230.00 is worth paying attention to. If volatility further increases, it is not ruled out that prices will rebound quickly or bottom out rapidly.
Medium- and long-term outlook: The upward structure at the daily level has not been completely destroyed. If the uncertainty of US policies increases or economic data is weak in the future, it will once again drive the recovery of safe-haven demand. Gold prices may still regain their upward momentum and hit $3,500 or even higher. On the contrary, if the equity market continues to strengthen, gold prices will face deeper correction pressure.
⭐️ Note: Labaron hopes that traders can properly manage their funds
- Choose a lot size that matches your funds
- Profit is 4-7% of the fund account
- Stop loss is 1-3% of the fund account

GOLD DAILY CHART MID/LONG TERM UPDATEHey Everyone,
After updating our 1H and 4h chart idea last two days, please see update on our daily chart idea also playing out perfectly.
On our last update we stated that we were seeing price break out of the channel but will need ema5 to lock outside of the channel to confirm the breakout into the next level.
We got the candle body above 3297 and ema5 lock opening 3433 - This was hit perfectly completing this target. No further close above this level confirmed the rejection.
We are now looking for support above the channel top for a continuation or a ema5 lock inside the channel will see price play back into the channel levels.
This is the beauty of our Goldturn channels, which we draw in our unique way, using averages rather than price. This enables us to identify fake-outs and breakouts clearly, as minimal noise in the way our channels are drawn.
We will use our smaller timeframe analysis on the 1H and 4H chart to buy dips from the weighted Goldturns for 30 to 40 pips clean. Ranging markets are perfectly suited for this type of trading, instead of trying to hold longer positions and getting chopped up in the swings up and down in the range.
We will keep the above in mind when taking buys from dips. Our updated levels and weighted levels will allow us to track the movement down and then catch bounces up using our smaller timeframe ideas.
Our long term bias is Bullish and therefore we look forward to drops from rejections, which allows us to continue to use our smaller timeframes to buy dips using our levels and setups.
Buying dips allows us to safely manage any swings rather then chasing the bull from the top.
Thank you all for your likes, comments and follows, we really appreciate it!
Mr Gold
GoldViewFX

Gold Traders Pay AttentionA Major Buying Opportunity is Emerging for GOLD ( XAUUSD )
In this analysis, we highlight an upcoming potential buy zone on GOLD ( XAUUSD ) that could present a significant trading setup. We’ll break down recent price action, key support zones, and technical signals that traders should keep on their radar.
Whether you're focused on intraday strategies or swing trading, these insights can help you position effectively for the next major move.
Don't miss out—watch the full breakdown for complete details.
Share your GOLD trade strategy in the comments below.

Gold "skydived" from $3,500, where will the landing price be?Fundamental analysis: the game between policy signals and safe-haven demand
From a fundamental perspective, Trump's moderate statement is the core driving factor of this round of gold correction. However, as tariff expectations cool, investors are beginning to reassess the attractiveness of risky assets. The three major U.S. stock indexes closed higher on Tuesday, and the 10-year U.S. Treasury yield fell slightly, indicating that the market's confidence in the economic outlook has recovered. Against this background, the safe-haven premium of gold has been weakened, and profit-taking has accelerated.
In addition, the Fed's policy expectations are still an important variable affecting gold. At present, the market generally expects the Fed to continue to cut interest rates in 2025, but the pace and magnitude depend on inflation data and economic performance. If the expectation of interest rate cuts further heats up, the US dollar index may be under pressure, thereby providing some support for gold.
Technical analysis: pullback pressure and key support
The gold price fell below the support of $3,300, and the next key level points to $3,282, which coincides with the low point on April 17. If the decline continues, $3,150, as the pivot point in early April, will become an important defensive line for bulls. On the contrary, if the price stabilizes and rebounds, the pivot point of $3,415 will be the first resistance level, and further upward movement needs to pay attention to the higher resistance of $3,464. It is worth noting that the current price is far away from the resistance level of $3,415, and the rebound momentum may be limited in the short term, unless new fundamental catalysts appear to push the RSI back to the overbought area.
Quaid's comprehensive analysis:
The gold market has entered a consolidation phase after a rapid rise, and short-term correction pressure still exists, but in the long run, safe-haven demand and fundamental support remain solid. Quaid recommends that traders pay close attention to US policy trends, the trend of the US dollar, and the performance of key technical levels to grasp the market rhythm.
At the same time, Quaid will always pay attention to international news so as to make timely analysis and suggestions for traders; to help traders get out of the current predicament.

Gold shorts are rampant! Can the 3300 mark be maintained?Yesterday, the international gold price fell from 3,500 USD/ounce to 130 USD, breaking through several important support levels. As of today, the lowest price reached 0.328, around 3291, which has given up all the gains this week. Focus on 0.382, 3291, within the day. If there is no break, the bulls will resist. After the break, the bears will continue to attack and look at around 3243-3228.
Spot gold today's operation strategy and key points analysis
Core view: The daily pressure adjustment continues, pay attention to the effectiveness of 3293 support in the short term, and the 3228-3240 area may become the end point of the adjustment;
The rebound is mainly high-altitude, pay attention to the 3340-3356 resistance area, and maintain a bearish outlook before stabilization;
1. Spot gold intraday operation plan
Resistance and short-selling area
Rebound: 3340-3356-3471 (4-hour middle track and MA5 daily resistance golden section 0.236)
Strategy: If the rebound is under pressure near 3340 (hourly chart K-line closes negative or stagflation signal), try shorting with a light position, stop loss above 3358, and target 3293-3280.
Aggressive short order: If the rebound is unable to break through 3335 (MA10 hourly moving average), you can enter the market in advance.
Support and potential bottom-picking area
First support: 3291 (Daily MA10 382 retracement)
Observation signal: If it rebounds and recovers 3291 after a rapid decline, you can short (light position), stop loss 3285, target 3340.
Strong support area: 3228-3240 (50% retracement, previous starting point)
Strategy: When it touches around 3228 for the first time, combined with bottom divergence or long lower shadow, try long with light position, stop loss 3210, target 3280-3300.
Breakthrough market response
Unexpectedly break through 3358: If the hourly chart closes at 3358, short orders will be temporarily exited, pay attention to the counter-pressure of 3380 (4-hour middle track), and short orders can still be tried.
Potential opportunities for bottom-picking in the market: focus on 3240-3228-3167
IV. Summary
Main idea: rebound high and high, focus on 3340-3356-3371*, if it does not break, continue to adjust;
Bottom-picking opportunity: wait for the stabilization signal in the 3228-3240-3167 area, and it is safer to trade on the right side;
Short-term trading depends on the system, and the market depends on the level. Short-term trading is high frequency, fast in and fast out. It is obviously impossible to pursue a high success rate in this model. Therefore, it can only rely on the system to win. There is a clear trading system, stop loss and stop profit system and risk control system. As long as these are done well, short-term trading can also make money. Moreover, short-term trading is a compulsory course for every trader. The market is the core of the real path to profitability, leapfrogging and successful trading, which requires considerable accumulation and precipitation, including the accumulation of mentality, funds, and technical level, and the market is also the path that every trader must reach and must eventually reach and move towards.

Gold continues to pull back to the turning point!!!In the 4-hour chart, the price found support near the 3284 area (the recent swing low) and rebounded. Buyers stepped in at this position and set risk below this support level in an attempt to push prices higher again. Sellers hope that the price will fall below this level to push the price further down to the 3167 area.
1-hour chart
On the 1-hour chart, a short-term downward trend line can be seen, which is currently limiting the market's bullish sentiment. Sellers may establish positions near this trend line and set stops above the trend line with a target of 3167.

Gold is falling wildly, is a key position coming?As of press time, spot gold has fallen wildly to below the support level of $3,300, having hit a record high of $3,500.05 the previous trading day.
At present, gold has fallen more than 5% from its historical high, and the fundamentals seem to be changing.
Quaid believes that gold has reached a key "turning point". After a strong rebound, the precious metal not only gave up all its gains, but also fell to a new low.
The sharp rise in gold prices is mainly due to the market pricing of "stagflation" risks, but as this risk is gradually eliminated, gold may experience a significant correction, especially considering that "long gold" has become one of the most crowded trades in the market, and its parabolic rise is an obvious signal. From a larger cycle perspective, gold is still in an upward trend, because the real yield may continue to decline against the backdrop of the Fed's easing policy. But in the short term, if good news about tariffs continues to be released, gold prices may fall further, and the market will adjust according to the new environment.
Daily chart analysis
From the daily chart, gold has given up all of Monday's gains. From a risk management perspective, buyers may look for a more cost-effective entry position at 3290 in the hope of further gains, while sellers hope that prices can break further down, thereby increasing bearish bets.
4-hour chart analysis
In the 4-hour chart, prices found support around 3300 and rebounded. Buyers intervened at this position and set risks below this support level in an attempt to push prices higher again. Sellers hope that prices fall below this level to push prices further down.
Quaid's analysis:
The current market is crazy. If it can fluctuate and adjust around the 3300 support level, the downward trend will stop and it may rise to 3400.
If this support level fluctuates and falls, it may plummet to around 3150.
Traders can wait and see for a short period of time before trading.
I hope Quid's analysis can help you get out of your current predicament. I also wish that all traders can fight for their own money waves in the market and achieve financial freedom under Quaid’s advice and analysis.

3280 becomes the key for bulls!The previous surge in gold prices was mainly due to the market pricing of "stagflation" risks, but as this risk is gradually eliminated, gold may experience a significant correction, especially considering that "long gold" has become one of the most crowded trades in the market, and its parabolic rise is an obvious signal.
From a larger cycle perspective, gold is still in an upward trend, because the actual yield may continue to decline under the background of the Fed's easing policy. But in the short term, if the good news about tariffs continues to be released, the price of gold may fall further, and the market will adjust according to the new environment.
Views on gold tonight!
In fact, the market has a warning for today's retracement. After all, yesterday's closing line was a big negative line, so there must be a continuation in the trend of gold. Moreover, after yesterday's gold rose to the 3500 line, the trend weakened, and the market fell all the way to break the 3400 mark and the 3300 mark, and fell to the lowest 3290 line! To be honest, this round of decline is still quite strong. After breaking the continuous positive, the market ushered in the suppression of the market retracement, and at present, there is still a trend of continuation! In my opinion, the key entry point for long orders today is the previous starting point of 3280. The short-term retracement of gold is obviously continuing, and in the medium and long term, gold is still bullish. So our entry point is actually relatively simple. When it retreats to 3280, we can directly enter the market. There are still many opportunities for long orders. The retracement is not the peak!

GOLD UPDATEHello friends
As you can see in the picture, everything is clearly defined.
After a strong rise, we see a double top pattern at the top of the channel, which indicates that we should gradually wait for a correction.
Now, how far will the correction continue? In the picture, we have identified the support levels that the price can reach.
*Trade safely with us*
