Gold Price Analysis April 1D1 candle is still showing a remarkable increase of Gold. Signaling that the uptrend will continue for another half.
The wave in the h4 frame is still continuing a strong uptrend and no correction wave has appeared.
H1 is trading in the border zone of 3126 and 3142. The trading plan for GOLD to close below 3032 shows a clear downtrend to 3106. On the contrary, if the candle closes above, wait for the 3142 zone to confirm that it does not break the price, then SELL to 3106. 3163-3165 is the Target for the BUY signal to break the ATH when the candle confirms above 3143
Goldprediction

Gold price plunges $50! Gold price profit-taking!Market news:
In the early Asian session on Wednesday (April 2), spot gold fluctuated in a narrow range and is currently trading around $3,130/ounce. The London gold price rose and fell on Tuesday. Spot gold rose to around the 3,150 mark earlier, and suddenly fell sharply after hitting a record high, falling nearly $50 from the high point. This is mainly attributed to investors choosing to take profits before US President Trump announced a series of tariffs. International gold has traditionally been a safe-haven asset in times of geopolitical and economic uncertainty. On Monday, the international gold price ended the first quarter with the strongest single-quarter performance since 1986, closing above $3,100/ounce. This is one of the most volatile periods in gold history. This trading day will also release the US ADP employment changes in March and the US factory orders monthly rate in February. Federal Reserve Board member Kugler will also deliver a speech, which investors need to pay attention to. In addition, it is necessary to focus on the details of the reciprocal tariffs and industry-specific tariffs announced by US President Trump, and be wary of the "boots landing" market.
Technical Review:
Gold ended its consecutive positive structure, and the daily chart closed with a long upper shadow and a negative K-line, and fell back to 3100 in the late trading. Technically, the gold price is still above the MA7 and 5-day moving averages at 3078/95, while the MA10/7-day moving averages still remain open upward, and the price is running on the upper track of the Bollinger Band.The short-term four-hour moving average closed, and the price was running below the MA10-day moving average at 3123. The price retreated to the middle track of the Bollinger Band at 3101/04. The RSI indicator turned downward after touching the overbought value above 80 yesterday. The hourly moving averages are glued together, and the price returns to the middle and lower tracks of the Bollinger Band. Gold is expected to continue to expand its volatility adjustment range during the day. It is recommended to wait for a correction before buying low and be cautious in chasing long positions at historical highs. Key resistance levels or historical highs participate in high-altitude coordination. Once the special tariff policy is implemented, there is a high probability that the situation of buying expectations and selling facts will occur. Pay attention to the sharp decline in the gold and silver market prices. On the contrary, if the new tariff policy is announced on the basis of the original tariff policy, gold needs to pay attention again to trigger risk aversion and usher in a sharp rise or set a new record high again.
Today's analysis:
Gold rose and fell back in the US market yesterday, and the bulls may enter an adjustment cycle under short-term pressure. In the short term, gold is expected to adjust! Yesterday, gold rose first and then fell, rising to 3148 before falling and adjusting. The European market fluctuated narrowly. From the technical indicators, the 2-hour moving average has formed a dead cross, MACD dead cross and large volume, Bollinger band closed, and the US market continued to decline after the shock. It has now fallen below the 3120 intraday watershed. In the short term, it means that the bulls have temporarily come to an end and started to retreat and adjust. From the 1-hour chart of gold, the rising volume at the tail end of the wave is usually not sustainable, accompanied by a step-by-step wash-out. After yesterday's retracement, today's Asian session quickly rose and rushed high, accompanied by a big negative line in the hourly chart, and retreated to the local high of 3150. The fluctuation base is large and the adjustment space can be large or small. It is not easy to chase high at the current position. Although short selling is against the trend, the technical overbought tariff implementation will also be realized, and the adjustment space should not be underestimated. Ultra-short-term combined with medium and long-term shorts to deal with short-term short adjustments.
Operation ideas:
Buy short-term gold at 3110-3113, stop loss at 3102, target at 3140-3150;
Sell short-term gold at 3143-3145, stop loss at 3154, target at 3120-3110;
Key points:
First support level: 3115, second support level: 3102, third support level: 3093
First resistance level: 3130, second resistance level: 3138, third resistance level: 3150

XAU/USD(20250402) Today's AnalysisToday's buying and selling boundaries:
3121
Support and resistance levels
3168
3151
3139
3102
3091
3073
Trading strategy:
If the price breaks through 3121, consider buying, the first target price is 3139
If the price breaks through 3102, consider selling, the first target price is 3091

3100 Danger? Has a short trend emerged after gold’s sharp fall?If you persist in doing something for three days, it is just a whim! If you persist in doing it for three months, it is just a start! If you persist in doing it for 10 years, it can be considered a career! Whether in life or trading, if you want to succeed, it is like sailing against the current. If you don’t advance, you will retreat. Only by working hard, persisting, moving forward bravely, and overcoming obstacles can you reap your own "success"! A new day begins, and every step of the strategy is the beginning of a battle. Execute the operation, if you don’t move, you will be fine, but if you move, you will be thunderous! 1-5 current price transactions per day make the operation easier!
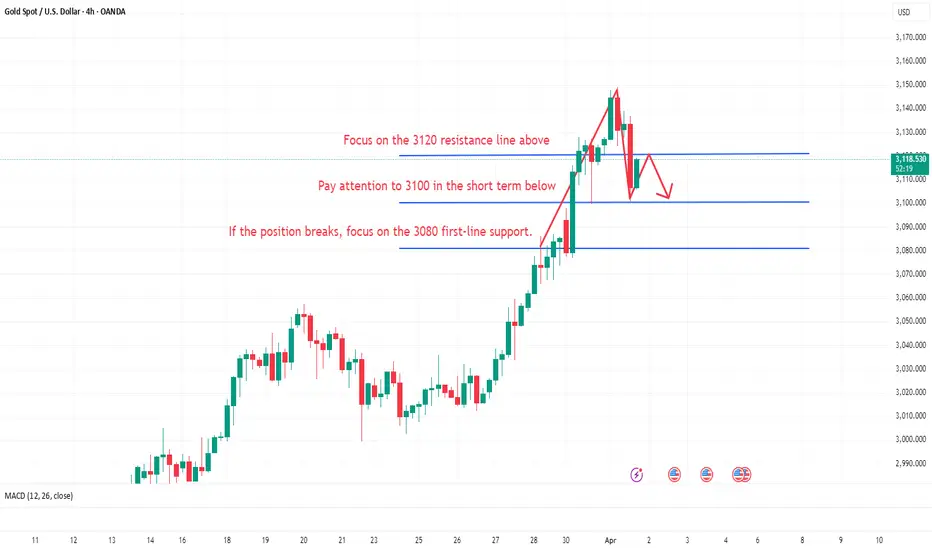
Gold technical analysis: After the gold surged, it appeared under pressure. The price reached 3149 and then retreated. The US market continued to decline after the shock. Don’t do more if it falls below 3120 in the evening, and be alert to the possibility of retreating to 3100. The short-term means that the bulls have temporarily come to an end and began to retreat and adjust the trend.
In addition to Trump’s announcement of tariffs this week, there will also be non-agricultural data, so this week is destined to be extraordinary. This is also the risk that has been repeatedly reminded. Don't be blindly overwhelmed by bulls. You need to respect the market at all times. After falling below 3120, there is room for a retracement, but whether the overall trend has turned is still uncertain. This week is very critical. There are important fundamental news. It is necessary to confirm whether it will change the fundamentals. Only when there is a change will the trend turn. Pay attention to the 3120 first-line resistance on the top of the 4-hour chart, and pay attention to the 3100 support on the bottom in the short term. It is recommended to operate in the range. Gold operation suggestion: short selling near 3115-3119, stop loss 3130, target 3105-3100
Trading discipline: 1. Don't blindly follow the trend: Don't be swayed by market sentiment and other people's opinions, operate according to your own operation plan, market information is complicated, and blindly following the trend is easy to fall into the dilemma of chasing ups and downs.
2. In gold trading, we will continue to pay attention to news and technical changes, inform you in time if there are changes, strictly implement trading strategies and trading disciplines, move forward steadily in the volatile market, and achieve stable asset appreciation.
GOLD DAILY CHART MID/LONG TERM UPDATEGOLD Daily Chart Update: 24th FEB 2025
Hi Everyone,
Here’s the latest update on the GOLD daily chart, which we've been closely monitoring and trading. Below, we break down recent price movements, updated key levels, and provide actionable insights for the days ahead.
Recap of Recent Chart Success!
Gold recently achieved a record high of $2,954.80. Our analysis has consistently highlighted that after reaching each target level, prices tend to reverse by over 40+ pips to the GoldTurn level. This pattern was evident when, after hitting TP3 at $2,933, the price retraced more than 40+ pips to the GoldTurn level at 2870, which acted as a support, before rebounding bullishly to surpass resistance and reach the all-time high of $2,954.81.
Current Outlook: Bullish or Bearish?
Presently, gold's price is oscillating between a resistance gap at $2,990 and a support gap at $2,933. The $2,990 level serves as a key resistance, while $2,933 acts as support. Additionally, the Fair Value Gap (FVG) offers support at $2,920.
In summary, while the long-term outlook remains bullish due to factors like central bank demand and economic uncertainties, short-term fluctuations between the $2,933 support and $2,990 resistance levels are expected. Traders should monitor these key levels and indicators closely to inform their strategies.
KEY LEVEL: 2870
Resistance Levels: 2990, 3052
Support Levels (GoldTurn Levels): 2933, 2870, 2801, 2744, 2671, 2595
EMA5 Behavior:
* Or If EMA5 crosses and locks above 2933, it strengthens the bullish case.
* If EMA5 fails to hold above 2933, cross and lock below this level 2933, expect a pullback to key GOLDTURN levels below.
Recommendations:
* Capitalize on Dip Opportunities: Use smaller timeframes (1H, 4H) to trade around GOLDTURN levels, targeting 30–40 pips per trade.
* Stay focused on shorter trades in this range-bound market to manage volatility effectively.
Long-Term Bias:
Maintain a bullish outlook while viewing pullbacks as buying opportunities.
Accumulate positions near key support levels for a safer approach instead of chasing highs.
Final Note:
Trade with confidence and precision. Our analysis ensures you’re well-prepared to navigate the evolving market landscape. Stay updated with our daily insights across multiple timeframes for deeper clarity.
Thank you for your continued trust! Don’t forget to like, share, and comment to support our work.
Best regards,
The Quantum Trading Mastery Team

GOLD XAUUSD – SNIPER PLAN 2 APRIL 2025👇
🦁 GOLD XAUUSD – SNIPER PLAN 2 APRIL 2025 📆
📍 Macro & Political Context
🗞️ Geopolitical Tension: Ongoing war in Ukraine + fresh tariff threats from Trump are sparking investor fear. Safe-haven flows into gold continue.
💰 Fundamentals: Inflationary fears remain strong. Market eyes the US NFP later this week. Fed is silent... too silent. 👀
🌍 Central banks are still buying gold – clear sign of institutional appetite.
🔍 Market Structure Overview
Trend: Bullish HTF ✅
Current Price: $3,113
All-Time High: $3,148 (Reached recently – likely liquidity swept!)
Last Valid BOS: H1 and H4 both show bullish structure, but a correction is brewing. 🍃
📊 Key Technical Zones & Confluences
🔻 Sell-Side Liquidity Below
📌 $3,100 – Clear liquidity pool (equal lows + psychological level)
🔥 Below $3,100 to $3,085 – Strong imbalance zone + unmitigated FVG
🧲 Expectation: Price may grab liquidity here before next leg up
🔷 Imbalance + Discount Zone
📉 $3,085–$3,095 – Massive H1/H4 imbalance. Could be a POI if price breaks $3,100
🧱 Valid Demand OB (H1) inside this zone + FIBO 61.8% retracement from last impulse
🔺 Premium Rejection
🧱 H1/H4 OB near $3,135–$3,145 = Price sharply rejected = probable redistribution zone
✂️ This was also the weekly high, which got swept = liquidity taken
🎯 Plan of Action
🟢 Scenario 1: Long Entry from Discount Zone
"Let them take the liquidity, we take the reversal!" 💸
Entry Zone: $3,085 – $3,095
Confluence:
Valid H1 OB (confirmed with PA)
Imbalance zone
FIBO 61.8% + structure break
Sell-side liquidity sweep from $3,100
Confirmation: M15 CHoCH + Bullish engulfing or low volume sweep
SL: Below $3,078
TP1: $3,130
TP2: $3,145
TP3: $3,150 (liquidity magnet again)
🔴 Scenario 2: Short if Price Pushes Back to $3,140+
Catch the premium short 🧨
Entry Zone: $3,140 – $3,148
Confluence:
All-time high sweep (liquidity trap)
HTF OB rejection
Weakness shown on M15
Confirmation: M5-M15 CHoCH + engulfing
SL: Above $3,155
TP1: $3,125
TP2: $3,100
TP3: $3,085
🧠 Final Notes
📌 Be reactive, not predictive – wait for PA confirmation at POIs
📰 Watch news – especially unexpected geopolitical catalysts or Fed surprise
🧘♂️ Stick to risk management. At ATHs, volatility is high and manipulation common.
👉 If this breakdown helped you, don’t forget to FOLLOW for more sniper setups and smash that ❤️ LIKE button to show some love!
Your support keeps this 🔥 content coming!

The bulls continue to reach new highsEarly layout plan for gold: As mentioned in our previous article, we decisively laid out gold short positions when entering the market at key points in the early stage, strictly implemented the fast-in-fast-out trading strategy mentioned in our article, perfectly hit the stop-profit target TP, and successfully made profits.
Gold technical analysis: Gold bulls dominate the screen, continuously breaking new historical highs. The current highest has reached 3149. The daily line has also closed positively, galloping in the market, invincible, and also let the bears flee. The current trend is basically in a regular form. The bullish trend is still strong. The early opening sprint broke through the 3130 line. We directly went long in the real market and successfully reached the target 3140-3145. Yesterday, the technical side of gold ushered in an accelerated rise in the Asian market. In the afternoon, the bulls in the European market continued to break through and stand above the 3100 integer mark to reach 3120 and continue to fluctuate strongly. Last night, the US market retreated twice to confirm that it stabilized at the 3100 mark and further continued to break through the 3127 mark and closed strongly. Our real market and the analysis of the article before the US market last night also successfully entered the long order at the 3103 line. I believe that friends who follow me can see that if your current gold operation is not ideal, I hope I can help you avoid detours in your investment. Welcome to communicate!
From the 4-hour analysis, today's short-term support is around 3117-3124, with a focus on the 3100-3106 line. Intraday operations follow the retracement and continue to be long. The short-term bullish strong dividing line focuses on the 3096-3100 line. The daily level stabilizes above this position and continues to maintain a low-long rhythm. Short selling can only enter the market at key points, and enter and exit quickly, without fighting. I will remind you of the specific operation strategy during the session, so pay attention to it in time.
Gold operation strategy: 1. Gold retracement 3117-3124 line long, retracement 3100-3106 line long, stop loss 3097, target 3145-3150 line, break and continue to hold;
Trading discipline: 1. Don't blindly follow the trend: Don't be swayed by market sentiment and other people's opinions, operate according to your own operation plan, market information is complicated, blindly following the trend is easy to fall into the dilemma of chasing ups and downs.
2. In gold trading, we will continue to pay attention to news and technological changes, notify you in a timely manner if there are any changes, strictly implement trading strategies and trading disciplines, move forward steadily in the volatile market, and achieve steady asset appreciation.

Monthly closing line, gold is alert to pull higher and fall backAt the end of March, the monthly and quarterly lines of gold and silver closed with saturated strong positive lines. The first trading day of the month has broken the high by inertia, which is consistent with expectations. Next, the focus should be on guarding against the potential scenario of pulling up shipments in the first half of the month, and the possibility of extreme volatility.
There are a lot of heavy news data from the 2nd to the 4th. I think there is a high probability that there will be an obvious turning point. However, given that the global political and economic situation has not cooled down significantly, even if there is a turning point and a correction, or even a sharp correction, it is still difficult to make a real judgment of a reversal of the big cycle trend. Therefore, I think the general idea of the short and medium-term line should be to maintain short first and then long.
The small resistance is around 3145--3155, and the important support during the week is around 3050. Given the recent volatility, it is obviously necessary to continue to be prepared to deal with continued large fluctuations.
The above strategy is based on current market analysis, and specific operations need to be combined with real-time data!

GOLD - single supporting area , holds or not??#GOLD. well guys now we have 3112 as immediate supporting area and upside we have 3125 as immediate resistance area so keep close and if market hold 3112 then we can expect another bounce towards upside next targets.
keep in mind that 3112 is our single supporting area so if market clear that level then we will go for short means cut n reverse but on confirmation.
good luck
trade wisely

Gold (XAUUSD) 15-Minute Chart Analysis: Bullish Setup with Key SGold (XAUUSD) 15-Minute Chart Analysis
Key Technical Indicators:
Current Price: $3,122.28
30 EMA (Red Line): $3,115.90 (Short-term trend indicator)
200 EMA (Blue Line): $3,081.17 (Long-term trend indicator)
Support Zone: Around $3,106.62
Target Point: $3,154.02
Analysis:
Trend:
The price is in an uptrend, as it is trading above both the 30 EMA and 200 EMA.
The 30 EMA is acting as dynamic support, showing strong buying interest at pullbacks.
Key Levels:
Support: $3,106.62 (marked in blue) is expected to hold as a key support level.
Resistance Zone (Previous Supply Area): Around $3,090-$3,100 (shaded purple) was previously a resistance zone but has now turned into support.
Target Level: $3,154.02 is the expected bullish target if the price respects the support zone.
Trade Setup:
Bullish Scenario: The price may pull back to the support zone (~$3,106.62) before bouncing higher towards the target.
Stop Loss: Below $3,106.62 to minimize risk.
Entry Point: A retest of the support area with bullish confirmation could provide an optimal entry for a long trade.
Risk Management:
Stop Loss: Set just below the support zone.
Reward-to-Risk Ratio: Favorable if targeting $3,154.02 with a stop at $3,106.62.
Conclusion:
The chart suggests a bullish outlook, with price expected to continue its upward momentum if support holds.
A breakout above $3,123 could further confirm bullish strength.
Caution: If the price breaks below $3,106, further downside movement toward the 200 EMA ($3,081.17) is possible.

GOLD(UPDATE)Hello friends
Given the good and strong growth, gold is now engaged with an important resistance area, which if reached and the price trend weakens, it can correct to the specified areas.
*Trade safely with us*

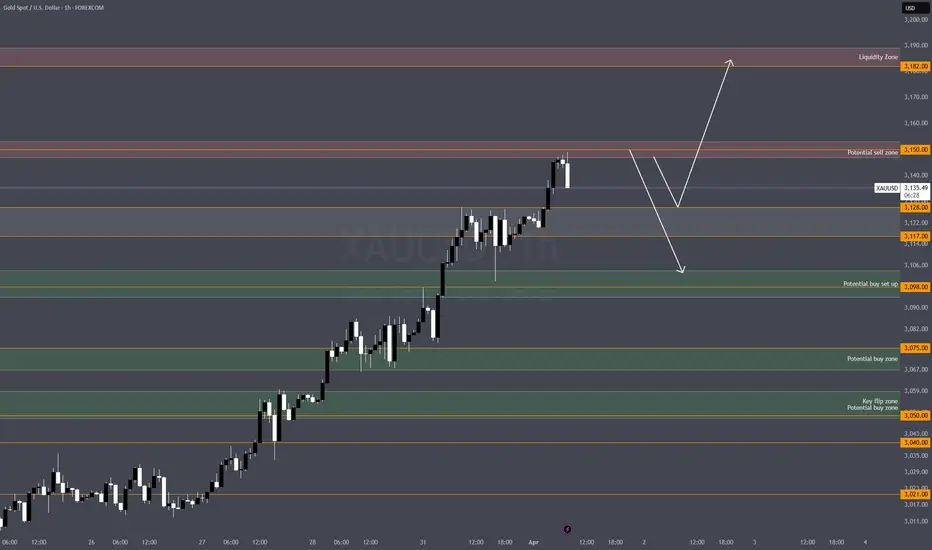
Gold extended higher, look for signs of exhaustionGold is extending higher, tapping into untested liquidity above. However, signs of exhaustion are creeping in. Watch for potential liquidity sweeps before reversals.
Key Untapped Liquidity Zones
Upside: $3,182 - $3,189
Downside: $3,103 - $3,094
🔴 Sell Setups (Short)
1️⃣ Intraday Reversal Short
Entry Zone: $3,182 - $3,189
Stop Loss (SL): Above $3,193
Take Profit (TP) Levels:
TP1: $3,150 (First reaction)
TP2: $3,128 (Key liquidity)
TP3: $3,103 (Imbalance fill)
📌 Reasoning:
Untested supply at $3,182-$3,189
Price may sweep liquidity above $3,180 before a sharp rejection
2️⃣ Aggressive Short (Scalp)
Entry Zone: $3,150 - $3,153
Stop Loss (SL): Above $3,157
Take Profit (TP) Levels:
TP1: $3,128
TP2: $3,117
TP3: $3,103
📌 Reasoning:
Liquidity grab before a possible retrace
Strong momentum-based rejection expected
🟢 Buy Setups (Long)
3️⃣ Safe Long (Key Demand Zone)
Entry Zone: $3,103 - $3,094
Stop Loss (SL): Below $3,089
Take Profit (TP) Levels:
TP1: $3,128
TP2: $3,150
TP3: $3,182
📌 Reasoning:
Untested demand at $3,103-$3,094
Imbalance below $3,103 should act as a magnet
Liquidity sitting at $3,094
4️⃣ Deep Liquidity Sweep Buy
Entry Zone: $3,074 - $3,067
Stop Loss (SL): Below $3,060
Take Profit (TP) Levels:
TP1: $3,103
TP2: $3,128
TP3: $3,150
📌 Reasoning:
Liquidity sweep target at $3,074-$3,067
If price taps this zone, a high-probability reversal could follow
Heavy imbalance would need correction
👀 Keep an Eye On:
1️⃣ DXY movements—if the dollar strengthens, gold may struggle to break higher.
2️⃣ News events—major economic data could trigger liquidity grabs before reversals.
3️⃣ Reactions at key levels—watch for wicks, aggressive rejections, and volume spikes.
📌 Important Notice!!!
The above analysis is for educational purposes only and does not constitute financial advice. Always compare with your own plan and wait for confirmation before taking action.
Good luck on the market today.
GOLD ROUTE MAP UPDATEHey Everyone,
Another great day on the Markets today, with our analysis playing out perfectly completing our 1h chart idea.
After completing 3090, 3103 and 3117, we stated that the lock above opened 3128 and just fell short and we were looking to buy dips to complete this target. This played out perfectly hitting this target and completing the chart idea.
We will update a new 1h chart idea later this week and in the mean time, please refer to our multi time frame chart ideas (weekly), that we shared Sunday, which are still in play.
BULLISH TARGET
3090 - DONE
EMA5 CROSS AND LOCK ABOVE 3090 WILL OPEN THE FOLLOWING BULLISH TARGET
3103 - DONE
EMA5 CROSS AND LOCK ABOVE 3103 WILL OPEN THE FOLLOWING BULLISH TARGET
3117 - DONE
EMA5 CROSS AND LOCK ABOVE 3117 WILL OPEN THE FOLLOWING BULLISH TARGET
3128 - DONE
As always, we will keep you all updated with regular updates throughout the week and how we manage the active ideas and setups. Thank you all for your likes, comments and follows, we really appreciate it!
Mr Gold
GoldViewFX

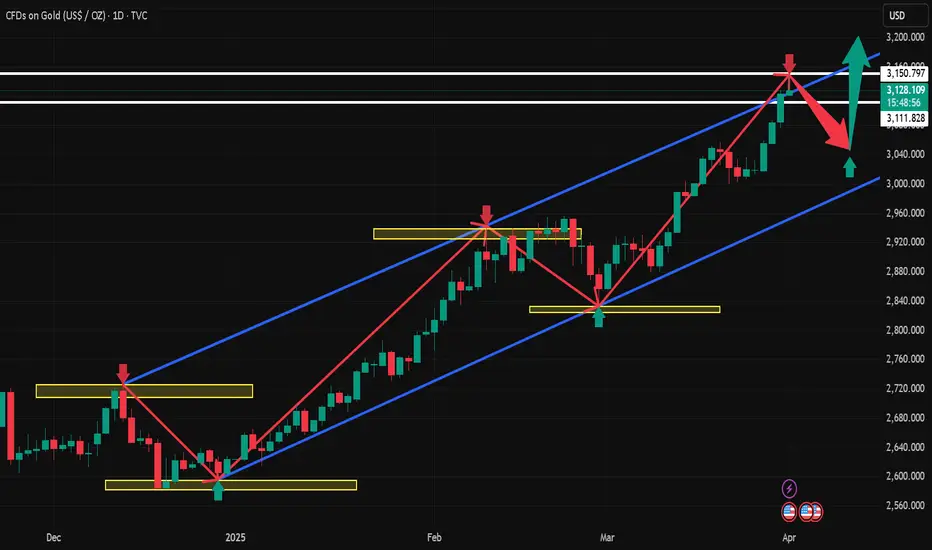
Short gold, profit target: 500pipsAfter reaching a fresh high of 3150, gold pulled back and has since been consolidating in a narrow range around 3132. While there is no denying that gold remains in a strong bullish trend, I believe it is now at its peak and could top out at any moment. This is why I continue to look for shorting opportunities rather than blindly chasing long positions—because I must first evaluate whether I have the risk tolerance to withstand a potential long-side drawdown.
Currently, gold is showing signs of exhaustion, retreating from 3150 and stalling near its ascending trend channel resistance. There is a strong possibility that this marks the end of the parabolic uptrend, leading to a rounded top correction, similar to the previous price cycle. A potential retracement zone aligns with a $50 pullback.
From a risk management perspective, going long at elevated levels presents significant challenges in setting a stop-loss (SL). A tight SL increases the probability of being stopped out due to market volatility, while a wider SL or no SL at all could expose long positions to severe drawdowns or liquidation if the market collapses.
On the contrary, short positions allow for better-defined SL placement, and gold tends to correct sharply after an extended rally, offering favorable exit opportunities. The worst-case scenario for short sellers is missing out on further upside gains, but in return, we significantly reduce the risk of capital destruction. This is the primary reason why I remain firmly bearish on gold at current levels!
Gold has retreated from its 3150 high, showing signs of momentum exhaustion. Given this price action, traders can consider initiating short positions within the 3135-3145 zone, aiming for a pullback toward the 3100 level. This setup offers a potential $50 profit per trade.

Gold is in the Bullish DirectionHello Traders
In This Chart GOLD HOURLY Forex Forecast By FOREX PLANET
today Gold analysis 👆
🟢This Chart includes_ (GOLD market update)
🟢What is The Next Opportunity on GOLD Market
🟢how to Enter to the Valid Entry With Assurance Profit
This CHART is For Trader's that Want to Improve Their Technical Analysis Skills and Their Trading By Understanding How To Analyze The Market Using Multiple Timeframes and Understanding The Bigger Picture on the Charts

Gold (XAUUSD) Bullish Trade Setup: Demand Zone Entry & Target PrThis is a gold (XAUUSD) trading chart from TradingView, showing a technical analysis setup on the 1-hour timeframe.
Key Observations:
Uptrend: The chart shows a strong bullish trend, with price making higher highs and higher lows.
Demand Zone (Entry Point):
A highlighted yellow zone around $3,121.38 indicates a demand area where price is expected to bounce.
This could be a support level or a key order block.
Stop Loss: Placed at $3,112.40, below the demand zone, to minimize risk in case the trade fails.
Target Point:
Set at $3,177.94, which is 1.69% above the entry point.
The expected reward is 52.77 points.
Risk-Reward Ratio: This setup follows a risk-reward strategy, aiming for a potential gain significantly higher than the risk taken.
Trading Strategy:
If the price retraces into the demand zone, a long position (buy) is expected.
A bounce from this zone could lead to a price surge towards the target.
If price falls below the stop-loss level, the trade is invalidated.
Conclusion:
This is a bullish setup relying on a pullback to a key support zone before continuation. Traders may monitor price action in the yellow zone for confirmation before entering a trade

4.1 Analysis and Suggestions on Gold US Market Operation IdeasGold intraday interpretation
Gold failed to hit 3150 in the morning session. How will the subsequent market evolve?
It hit a high in the morning and then fell back to 3125-3130 to stop the decline and enter consolidation. If it fails to break through 3150 on Thursday, it will have a chance to enter a high-level adjustment, and the decline may reach 30-50 points!
Market sentiment has been brewing for a long enough time. Everyone should look at tariffs rationally. Even if there is no tax increase, there is no need to be too surprised.
Currently entering the triangle consolidation pattern, which is a type of relay pattern. The pattern is usually accompanied by a reduction in trading volume and resumes the original trend after breaking through.
Focus: 3150 key resistance. Don't chase north above 3140. If the intermediate form is used, the probability of breaking through 3150 during the day is not high. Mainly look at the ADP employment number on Wednesday. Beware of the US market retreating from 3113 to 3117 and then rebounding quickly.
Lower support: 3125 3113 3105
Upper pressure: 3150 3165

Verified again, bulls continue to hit new highsGold technical analysis: Gold opened at 3130 in the morning. Yesterday, gold technically accelerated in the Asian session. The European session bulls continued to break through and stood above the 3100 integer mark to reach 3120 and continued to fluctuate strongly. The US session stepped back twice to confirm the stabilization of the 3100 mark and further continued to break through the 3127 mark and closed strongly. Friends who follow me can see that our real-time analysis and the analysis of the article before the US session also successfully entered the long order at the 3103 line. This also verifies the 3127-3130 line suppression given in my article last night. The daily K-line closed with a shock and broke through the high-middle Yang. The overall gold price ushered in the rhythm of bulls accelerating the rise after breaking through the 3050 mark. The daily level closed with a strong medium-yang for three consecutive trading days. If your current gold operation is not ideal, I hope I can help you avoid detours in your investment. Welcome to communicate!
From the 4-hour analysis, today's short-term support is around 3118-3124, with a focus on the 3100-3106 line. Intraday operations follow the retracement and continue to be long. The short-term bullish strong dividing line focuses on the 3096-3100 line. The daily level stabilizes above this position and continues to maintain a low-long rhythm. Short selling can only enter the market at key points, and enter and exit quickly, and do not fight. I will remind you of the specific operation strategy during the session, so please pay attention to it in time.
Gold operation strategy: 1. Gold retracement 3116-3124 line long, retracement 3100-3106 line continue to cover long positions, stop loss 3097, target 3145-3150 line, and continue to hold if it breaks.
Trading discipline: 1. Do not blindly follow the trend: Do not be swayed by market sentiment and other people's opinions, operate according to your own operation plan, market information is complicated, and blindly following the trend can easily fall into the dilemma of chasing ups and downs.
2. In gold trading, we will continue to pay attention to news and technical changes, inform you in a timely manner if there are any changes, strictly implement trading strategies and trading disciplines, move forward steadily in volatile markets, and achieve steady asset appreciation.

XAUUSD Analysis todayHello traders, this is a complete multiple timeframe analysis of this pair. We see could find significant trading opportunities as per analysis upon price action confirmation we may take this trade. Smash the like button if you find value in this analysis and drop a comment if you have any questions or let me know which pair to cover in my next analysis.

XAU/USD 01 April 2025 Intraday AnalysisH4 Analysis:
-> Swing: Bullish.
-> Internal: Bullish.
Since last analysis price has continued extremely bullish. This is most likely due to market jitters caused by Trump's tariff policy which is driving up the price of gold.
This solidifies gold as a safe haven asset and could lead to repricing.
You will note a further bullish iBOS marked in red. This is due to the fact the price did not trade down to either discount of internal 50% or a demand level.
Intraday Expectation:
Due to the bullish nature of the market, with very minimal pullback I will continue to visually map until price pulls back enough to plot structure.
Note:
With the Federal Reserve's dovish stance and persisting geopolitical uncertainties, heightened volatility in Gold is expected to continue. Traders should proceed with caution and adjust risk management strategies in this high-volatility environment.
Price could also be driven by President Trump's policies, geopolitical moves and economic decisions which are sparking uncertainty.
H4 Chart:
M15 Analysis:
-> Swing: Bullish.
-> Internal: Bullish.
Since last analysis price has continued extremely bullish. This is most likely due to market jitters caused by the trump tariffs.
This solidifies gold as a safe haven asset and could lead to repricing.
You will note price has printed a bearish CHoCH which indicates, but does not confirm, bearish pullback phase initiation. I will however continue to monitor price.
Intraday Expectation:
Price to trade down to either discount of 50% internal EQ or M15 demand zone before targeting weak internal high, priced at 3,149.090.
Note:
With the Federal Reserve maintaining a dovish stance and ongoing geopolitical tensions, volatility in Gold prices is expected to remain elevated. Traders should exercise caution, adjust risk management strategies, and stay prepared for potential price whipsaws in this high-volatility environment.
M15 Chart:

Happy New Month: -1-APRIL-2025Good morning Traders! Happy New Month! Improve your trading strategy with our Gold zones. Understand market dynamics and make informed decisions.

Monthly line saturated big positive line, gold and silver swordsYesterday, the gold market opened slightly higher at 3088 in the morning, and then fell back. The daily line reached a low of 3076.5, and then the market rose strongly. After breaking the 3100 integer mark, the daily line rose strongly. The daily line reached a high of 3128, and then the market consolidated widely. The daily line finally closed at 3123.8, and then the market closed with a long lower shadow. After this pattern ended, today's market still has technical bullish demand. In terms of points, after the breakout of 2940 and 2958, the stop loss followed up at 2990. Today, the stop loss of 3110 is 3105, and the target is 3128 and 3132. The breakout is 3140 and 3150-3152.
We will update regularly every day to introduce how we manage active ideas and settings. Thank you for your likes, comments and attention. Thank you very much
Gold Price Analysis March 31Fundamental Analysis
Gold price attracts safe-haven flows for the third straight day amid rising trade tensions.
Fed rate cut bets weigh on the USD and also lend support to the non-yielding yellow metal.
Overbought conditions on the daily chart now warrant some caution for bullish traders.
Technical Analysis
Gold continues to hit ATH levels and is very difficult to trade with a large amount of Fomo BUY. The important point to retest the BUY signal today is at 3100-3098. And 3145 is the target level for the ATH peak of Gold today.
What do you think of the above analysis? Please leave your comments.
