GOLDWe are expecting Gold to finish this wave we are in very soon and then give us a drop for correction before any upside further reaction.
Disclosure: We are part of Trade Nation's Influencer program and receive a monthly fee for using their TradingView charts in our analysis.
Goldprediction

Analysis of gold price trend next week!Market news:
Gold prices in London hit a record high on Friday as U.S. President Trump's latest tariff policy sparked concerns about a global trade war, with investors flocking to safe-haven assets. Spot gold climbed 0.9% to its 18th record high of $3,086 this year. It rose 2.02% this week, rising for the fourth consecutive week.This round of international gold's rise is driven by market concerns that President Trump's new round of reciprocal tariffs, which will take effect on April 2, will push up inflation and undermine the stability of global trade. Gold prices have risen 2% this week and are expected to rise for the fourth consecutive week as investors turn to safe-haven assets amid growing uncertainty about the direction of U.S. policy.Next week will be Trump's tariff week, and countries are currently relatively tough. According to CCTV, Mexican President Sheinbaum said on March 28 local time that he opposed the United States' unilateral imposition of a 25% auto tariff. Mexico is developing comprehensive responses to strengthen the national economy and respond to unilateral behavior, while the negotiation process with the United States continues, striving to ensure stable employment and maintain investment while avoiding damage to U.S. and Canadian interests.
Technical Review: Gold has a high probability of rising overall on Friday due to the combined effect of market sentiment and capital flows in the evening. However, the market feedback after the release of PCE inflation data was poor, and the data was bearish. Gold failed to break through the high point and set a new high. Although the gold price rose and broke through the high point during the ten o'clock period, it was just a puncture! In the current market, perhaps the market needs further adjustment! Gold broke through the new high in the US market and fell back. It is not meaningful to chase high again on Friday night. It may rise and fall at any time. After all, gold may start to adjust at any time after rising today. The one-hour line rose twice to touch the high point of 3086, which will be the key resistance level. It is obvious that the gold price did not stand above 3086. Both times it fell rapidly after touching it. Before the gold price stood above 3086, it looked for adjustments during the session. The range was 3066-3086. Gold may have a double top starting from 30 minutes. Don't chase more for the time being. If you want to go long, wait patiently for a fall, otherwise the adjustment range at the high level may also be large.
Analysis for next week:
Gold is still just adjusting for now. Gold started to rise again in the second half of the night. Gold bulls are still relatively strong. There will be more gold if it falls back next week. After all, gold bulls are strong now. However, don’t chase more at high levels. Wait for it to fall back before buying more. Gold is still arranged with a golden cross upward bullish divergence in 1 hour. After the adjustment, gold bulls did not weaken, but continued to be strong. Then the decline of gold is just an adjustment. Gold will continue to buy after the adjustment next week. Gold hit the bottom of 3067 in the US market on Friday and then rose again. The gold moving average now supports the line around 3072. In this range, gold is still in the support area. So buy on dips when it falls back to 3070 next week.
Operation ideas:
Buy short-term gold at 3070-3073, stop loss at 3062, target at 3090-3100;
Sell short-term gold at 3103-3105, stop loss at 3114, target at 3080-3070;
Key points:
First support level: 3072, second support level: 3065, third support level: 3055
First resistance level: 3092, second resistance level: 3105, third resistance level: 3118
GOLD 4H CHART ROUTE MAP UPDATE & TRADING PLAN FOR THE WEEKHey Everyone,
This is a continuation update from last week, which is playing out perfectly clearing first our Bearish target followed with all our Bullish targets with ema5 lock confirmations.
We are now seeing a gap left open at 3089 and will need ema5 to cross and lock above this level for a continuation into the next level. Failure to lock will see price reject into the lower Goldturns for bounces or further cross and locks below the levels to open the levels below.
We will see levels tested side by side until one of the weighted levels break and lock to confirm direction for the next range.
We will keep the above in mind when taking buys from dips. Our updated levels and weighted levels will allow us to track the movement down and then catch bounces up.
We will continue to buy dips using our support levels taking 30 to 40 pips. As stated before each of our level structures give 20 to 40 pip bounces, which is enough for a nice entry and exit. If you back test the levels we shared every week for the past 24 months, you can see how effectively they were used to trade with or against short/mid term swings and trends.
BULLISH TARGET
3045 - DONE
EMA5 CROSS AND LOCK ABOVE 3045 WILL OPEN THE FOLLOWING BULLISH TARGET
3067 - DONE
EMA5 CROSS AND LOCK ABOVE 3067 WILL OPEN THE FOLLOWING BULLISH TARGET
3089
EMA5 CROSS AND LOCK ABOVE 3089 WILL OPEN THE FOLLOWING BULLISH TARGET
3114
BEARISH TARGETS
3018
EMA5 CROSS AND LOCK BELOW 3018 WILL OPEN THE FOLLOWING BEARISH TARGET
2985
EMA5 CROSS AND LOCK BELOW 2985 WILL OPEN THE SWING RANGE
SWING RANGE
2947 - 2918
As always, we will keep you all updated with regular updates throughout the week and how we manage the active ideas and setups. Thank you all for your likes, comments and follows, we really appreciate it!
Mr Gold
GoldViewFX

GOLD DAILY CHART MID/LONG TERM UPDATEHey Everyone,
This is an update on our daily chart idea that we are now tracking for a while now. If you have only started following us, please read the updates below at the bottom from previous weeks to see how effectively we have been tracking this.
Now after completing the target to the channel top we stated that if we see ema5 lock outside the channel then we will look for support outside the channel on the channel top for a continuation, which played out perfectly, as the channel top after the breakout provided support for a continuation.
We then stated and expected price to play between 3052 and 3007 until we see a break to confirm our next range. We got the test on 3007 with no body close or ema5 lock, which confirmed the rejection and the bounce perfectly into 3052, which then followed with the body close above 3052 opening the range above, giving a nice clean run of over 300 pips. Gap remains open and ema5 lock will only further confirm this but we are happy with the run already and will now continue to buy from dops only.
This is the beauty of our Goldturn channels, which we draw in our unique way, using averages rather than price. This enables us to identify fake-outs and breakouts clearly, as minimal noise in the way our channels are drawn.
We will use our smaller timeframe analysis on the 1H and 4H chart to buy dips from the weighted Goldturns for 30 to 40 pips clean. Ranging markets are perfectly suited for this type of trading, instead of trying to hold longer positions and getting chopped up in the swings up and down in the range.
We will keep the above in mind when taking buys from dips. Our updated levels and weighted levels will allow us to track the movement down and then catch bounces up using our smaller timeframe ideas.
Our long term bias is Bullish and therefore we look forward to drops from rejections, which allows us to continue to use our smaller timeframes to buy dips using our levels and setups.
Buying dips allows us to safely manage any swings rather then chasing the bull from the top.
Thank you all for your likes, comments and follows, we really appreciate it!
Mr Gold
GoldViewFX
OLD UPDATES ON THIS CHART IDEA
MARCH 23RD WEEK UPDATE
The half line of our unique channel gave the perfect bounce into the next axis target at 2904, inline with our plans to buy dips just like we stated. We now have a body close once again with ema5 cross and lock above 2904 leaving the range above open. We will continue to look for support at the ascending half-line of the channel, as we climb into the range.
PREVIOUS WEEKS UPDATE
After completing our Bullish targets we stated that the channel top will act as resistance confirmed with ema5 rejection. A break of the channel top with ema5 would confirm a continuation and failure would confirm rejection. This allowed us to identify true breakouts against fake outs.
We also stated that we need to keep in mind the channel half line below to establish floor to provide support for the range, should we continue to track further up. A break below the half line will open the lower part of the channel to establish floor on the channel bottom. The safest way to track this movement is by buying dips.
- Once again this played out perfectly as we got the rejection on the channel top followed with the channel half line test, which gave the perfect bounce like we stated. We will now either look for a continuation from this bounce or a cross and lock below the half line for a break into the lower channel floor.

GOLD WEEKLY CHART MID/LONG TERM ROUTE MAPHey Everyone,
Please see update on our weekly chart idea, that we have been tracking from last week since completing our previous long range/term weekly chart idea.
Last week we stated that we were seeing a candle break above the channel half-line and will need ema5 to follow to confirm the break out for a continuation above. We got the cross and breakout, which gave a nice push up now heading towards 3094 and just fell short leaving this gap open.
We have a small detachment to ema5 lagging also potentially due for a correction. The play range on the weekly chart is 2943 below and 3094 above. We will look for ema5 lock or body close above or below to confirm the next mid to long term range.
This is the beauty of our channels, which we draw in our unique way, using averages rather than price. This enables us to identify fake-outs and breakouts clearly, as minimal noise in the way our channels are drawn.
Thank you all for your likes, comments and follows, we really appreciate it!
Mr Gold
GoldViewFX

Gold swing trade with buy and sell levelsThis week we are looking to sell Gold down to previous resistance which aligns with Fibonacci 0.382 level for a sell total pips of 309.
When we reach our take profit we will go back into a buy at 2994 and a take profit target of 3053 for an additional pip count of 588 pips.
Trade idea is based on higher time frame and uses trend lines as well as support and resistance and Fibonacci levels.
With these type of trades expect to go into some drawdown that's why I recommend using small lots and securing profit along the way .
Check out my weekly gold forecast with both buy and sell entries posted below.

Gold weekly forecast with buy and sell levelsGold weekly forecast with both buy and sell entries.
Friday Gold sold off from 2334 all the way to 2300 for a drop of 334 pips before retracing up to where we are now at 3024.
What can we expect for the coming week ?.
My plan is as follows.
For a buy I would look at entering at 3032 expecting first resistance (marked in red on chart ) to be 3038 to 3040 area.
If we break these then next target would be 3048 to 3052 (200 pip from entry) this is high resistance level , if gold continues to be bullish expect 3078 to be the next area.
For a sell I would enter at 3018 expecting 3010 to 3008 as first support, next level is 3000 to 2998 and if broken we can expect gold to fall to 2880 and 2840 levels.
As always wait for levels, take profit along the way and don't over leverage .
Ill update this as the week goes on.
Check out my other trade idea for a gold swing trade below.
Trade safe

USDJPY analysis week 14🌐Fundamental Analysis
The Federal Reserve (Fed) kept interest rates unchanged in the 4.25% - 4.50% range and forecast core PCE inflation to average 2.8% by year-end. The higher-than-expected inflation data reinforced expectations that the Fed will maintain current interest rates for an extended period. Investors are concerned that these tariffs could add to global inflationary pressures and trigger a recession.
In Japan, the Tokyo CPI rose sharply in March, boosting expectations that the Bank of Japan (BoJ) will continue to raise interest rates this year. The hot inflation data also supported the Yen's appreciation against other currencies.
🕯Technical Analysis
USDJPY is still in a bullish recovery. The pair is facing support at 149.200, preventing further declines. The weekly high around 151.100 is still acting as key resistance before the pair breaks out to 152.000. Conversely, if the trend breaks at 149.200, weekly support is seen at 148.300.
📈📉Trading Signals
SELL USDJPY 151.300-151.100 SL 150.500
SELL USDJPY 152.000-152.200 SL 152.400
BUY USDJPY 149.300-149.100 SL 148.900

GOLD Long opportunity from 3,050 or 3,020 back to ATH'sThis week, my outlook on gold remains strongly bullish. Price has once again reached its all-time high (ATH) and broken structure to the upside, leaving behind new demand zones that present potential buying opportunities.
The first key area of interest is the nearby 6-hour demand zone. While not the most ideal setup, I will be monitoring how price reacts once it mitigates this level.
Additionally, there is a 15-hour demand zone positioned lower, offering a more favorable entry at a discounted price. This zone was responsible for the break of structure to the upside, making it a strong area of interest. If price reaches this level, I expect a slowdown followed by a buildup of bullish momentum.
Confluences for XAU/USD Buys:
Price has broken structure to the upside on the higher timeframes.
Clean 6-hour and 15-hour demand zones remain unmitigated.
Gold has been consistently bullish across both lower and higher timeframes.
DXY is trending bearish, reinforcing gold’s bullish bias due to their inverse correlation.
Note: There is some liquidity resting below in the form of an equal low and a small trendline. I will wait for confirmation in these areas before making any decisions.

Summary of this weekThis week, the gold market continued its bull market, breaking through the historical high of 84 and closing. The gold price broke through the psychological barrier of 3,000. The market sentiment continued to be optimistic.
In this week's trading, we took the main approach of going long, holding long positions, buying back, and making significant profits, achieving the expected goals.
Next week, we will continue to make steady progress and formulate a more efficient profit plan.
If you also want to learn gold trading skills and profits in the market, then join my team.
Wish you all: Have a good weekend

Gold breaks new high again, the market waits for a pullback to gFundamentals: Gold hits a new record high today, and the market continues to hold a bullish view after the decline.
Gold is currently maintaining a relatively strong oscillating trend in the large-scale cycle trend, and the upward space in the large-scale cycle trend is likely to have not yet been completed. The daily level trend continues to maintain a relatively strong oscillating trend along the short-term moving average. The wave of decline before and after the European session has completed the repair of the technical form to a certain extent. The oscillating repair temporarily maintained at a high level in the hourly level trend currently has no particularly obvious trend. The range in the short-term trend may be compressed to the oscillating repair trend between 3060-85. Although there are some rebounds in the small-scale cycle trend, the strength and continuity are not too large. Pay attention to the short-term adjustment and repair.
Operation suggestions:
Short near 3080-7, stop loss 3085.2,
Long near 3059-60, stop loss 3053.1.
Real-time market intraday guidance.

Gold (XAU/USD) Trade Setup & Analysis – March 28, 2025Gold (XAU/USD) Trade Analysis – March 28, 2025
Current Market Overview:
Price: $3,073.77
Recent High: $3,074.00
Recent Low: $3,070.29
EMA (30): $3,073.71 (Short-term trend)
EMA (200): $3,047.40 (Long-term trend)
Technical Analysis:
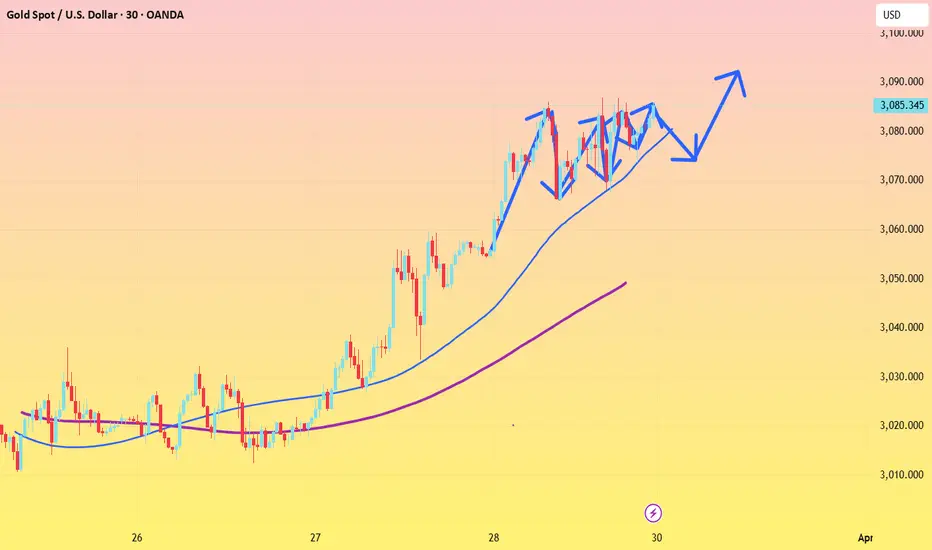
Support & Demand Zone:
The highlighted purple area represents a strong support zone around $3,050 - $3,058, where buyers may step in.
The price is currently pulling back into this area, indicating a potential bullish reversal opportunity.
Bullish Projection:
The chart suggests a retracement to the demand zone, followed by a strong bullish continuation.
A breakout from the minor resistance zone around $3,073 - $3,075 would confirm the uptrend.
Target & Stop Loss:
Entry Zone: Around $3,058.86 (near the demand zone).
Stop Loss: Below $3,047.40 (under the key support and EMA 200).
Target: $3,109.54 (significant resistance level and profit-taking point).
Trade Strategy:
Wait for confirmation of a bullish rejection at the support zone before entering.
If price breaks above the minor resistance, it could indicate momentum toward the target.
Risk-to-reward ratio looks favorable with a potential upside move of +50 points if the trend continues.
Conclusion:
The setup favors a bullish continuation after a pullback.
Key Levels to Watch: $3,058 (entry), $3,047 (stop loss), and $3,109 (target).
Traders should monitor price action at the demand zone before entering a long position.

GOLD ROUTE MAP UPDATEHey Everyone,
Another awesome finish to the week with our charts idea playing out to perfection!!!
After completing our 3050 target yesterday, we got our cross and lock above 3050 opening 3065, followed with a further cross and lock above 3065 opening 3080, Both 3065 and 3080 were completed today for a perfect finish.
We will now need a cross and lock above 3080 for a continuation into the next Goldturn or failure to lock will see rejections into the lower Goldturns.
BULLISH TARGET
3032 - DONE
EMA5 CROSS AND LOCK ABOVE 3032 WILL OPEN THE FOLLOWING BULLISH TARGET
3050 - DONE
EMA5 CROSS AND LOCK ABOVE 3050 WILL OPEN THE FOLLOWING BULLISH TARGET
3065 - DONE
EMA5 CROSS AND LOCK ABOVE 3065 WILL OPEN THE FOLLOWING BULLISH TARGET
3080 - DONE
EMA5 CROSS AND LOCK ABOVE 3080 WILL OPEN THE FOLLOWING BULLISH TARGET
3097
BEARISH TARGETS
3015 - DONE
We will now come back Sunday with our updated Multi time-frame analysis, Gold route map and trading plans for the week ahead and also a new Daily chart long term chart idea, now that this one is complete.
Have a smashing weekend!! And once again, thank you all for your likes, comments and follows, we really appreciate it!
Mr Gold
GoldViewFX

A real correction for gold could be comingGold 30-minute chart is beginning to have the possibility of a double top, so don't chase long for now. If you want to go long, wait patiently for a pullback, otherwise the high adjustment may also be large. Gold can be shorted on rallies. If gold falls below 3060, then the real adjustment of gold may come.
The market is changing rapidly. Since the strength of gold has been insufficient after breaking through new highs, don't chase too much.

3.28 Gold breaks new high again, holding on is the keyGold price hits a new record high of 3086, and today's low is the key
Gold price hits a new record high of 3086, which is in line with our bullish thinking of restarting strength since Tuesday
Now the price has also broken through the upper track of the green channel line. The next focus is on keeping low. Keeping low and breaking high will accelerate. Breaking the low point will easily return to sweeping
Today's low point defense position has two, the first is the early trading low of 3054, because it is a direct rise in the early trading to break the new high, and the afternoon continues to break the new high. In this case, it is particularly important to hold the early trading low ;
The second is the position along the green channel line, 3063-3061, which is also the position of the acceleration starting point
Then, next, hold the position along the green channel line, and switch upwards for at least 50-70 US dollars, corresponding to the resistance of the 3100-3115 area
The key point is to hold low, hold low and break high to see acceleration, and break the low point to turn to sweep
As shown in the figure, this wave of confirmed support began to rise, starting from breaking through the green dotted line suppression. After the breakthrough, repeatedly stepping back to confirm the 3015 upper and lower areas Support, then stand up and stabilize in the 3033-3030 area, and start an upward breakthrough
In the process, it is accompanied by a deep squat of 18-20 US dollars. After the leverage is completed, it will rise by more than 40 US dollars to break the new high
For the market that directly rose in the morning, there was a second sprint to break the high in the afternoon, so refer to 3068-3066 as support to continue to layout the bullish sprint to the 3080-3082 area
The price also accelerated the sprint and rose, and slightly exceeded the range of 3086
: Suppression line Under pressure, enter adjustment, squat 18-20 US dollars, confirm the support and continue to pull up more than 40 US dollars (what needs to be considered and verified at this moment)
For this pressure position, the focus is on the 3082-3085 area (now the excess range has reached 3086), using this as a suppression to find a space range of 18-20 US dollars, corresponding to the 3062-3060 range
The short position in the 3082 area fell to 3072-3070 as expected
Verify the conjecture step by step, time is the best verification tool!
Today is Friday, still the old rules, only provide information reminders for cooperative friends, if you need, you can find us, looking forward to the good news you have received!

Gold Approaches 3100, Short Opportunity EmergesGold has reached a high of around 3085, now just a step away from the 3100 level. However, for short-term trading, I view the 3085-3105 range as an ideal zone to consider short positions on gold.
📍Short-Term Trading Strategy:
Consider scaling into short positions within the 3085-3105 range. Pay close attention to position sizing and risk management when setting up trades.
📍Key Support Levels to Watch:
-First target: 3065-3055
-Second target: 3045-3040
The trading strategy verification accuracy rate is more than 90%; one step ahead, exclusive access to trading strategies and real-time trading settings

Gold Price Analysis March 28Fundamental Analysis
Gold (XAU/USD) continued its upward trend, hitting a record high of $3,086 during the European session on Friday. Global risk sentiment weakened due to concerns over US President Donald Trump's auto tariffs and uncertainty over upcoming tariffs, boosting safe-haven demand for gold.
In addition, expectations of an early Fed rate cut due to concerns over Trump's trade policies affecting US economic growth also supported gold's gains. Although the USD recovered slightly ahead of the US personal consumption expenditure (PCE) price index report, this did not reduce the appeal of XAU/USD.
Technical Analysis
Gold is quite difficult to trade around the ATH zone today. Note that the lower boundary zone of 3060 is converging with the EMA 34 zone and the SELL zone around the 3100 round-trip barrier. The basic trading strategy requires your patience as the market is not easy to trade at the moment.
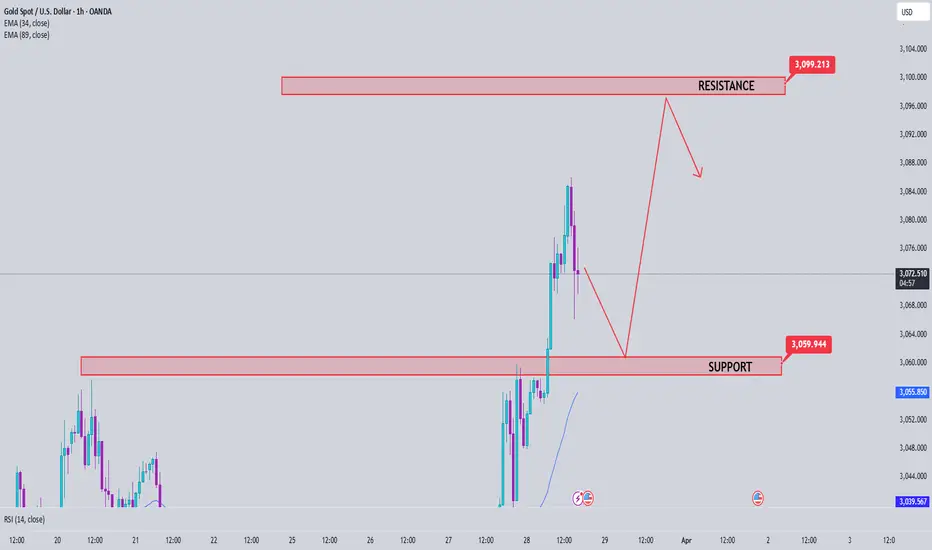
Gold short setup from resistance area for short term only!Hello Traders,
Gold has reached a key historical resistance level and is showing signs of rejection with pin bars on the 2-hour timeframe. This suggests that bullish momentum may be weakening, potentially leading to a pullback. I’m closely watching the current 2-hour candle to see if it closes bearish, ideally engulfing the previous two bullish candles.
Three pin bars formed at the resistance area suggesting that the bullish trend may be weaking for a short term
With the month coming to an end, large investors might start closing their portfolios, which could trigger a 20%-30% pullback on the monthly candle. This aligns with our support level around 3030. For a trading setup, I’ll wait for the current 2-hour candle to close bearish and look for a slight retracement to 3075 as a potential shorting opportunity.
20%-30% retracement may be possible due to investors closing their monthly portfolios
If you find this analysis helpful, a boost would be greatly appreciated! 🚀

XAU/USD(20250328) Today's AnalysisToday's buying and selling boundaries:
3044.62
Support and resistance levels
3086.39
3070.78
3060.65
3028.58
3018.45
3002.84
Trading strategy:
If it breaks through 3060.65, consider buying, the first target price is 3070
If it breaks through 3044.62, consider selling, the first target price is 3028

Gold trading zones: 28-MAR-2025Today’s Gold trading zones: For educational purposes only, use at your own risk.

GOLD 4H ROUTE MAP TRADING PLAN / READ CAPTION CAREFULLYGOLD 4H Chart Analysis – 12th Feb 2025
Dear Traders,
Here’s the latest update on our 4H chart. It’s been a productive week! If you reviewed our previous chart on the 11th of February, today’s analysis should help guide your trading plan for the week.
Chart Color Codes:
* Red boxes (right): Support levels labeled as GOLDTURN LEVELS. A small red circle marks activation after short reversals.
* White GOLDTURN LEVELS (top): Not yet activated.
* Green boxes on the top(left): New Take Profit Targets.
* Green boxes with red outlines: Achieved targets.
* Grey button: Entry point from the 11th of February.
Review of Previous Chart:
Entry Level: 2814
Take Profit 1: 2850.15 ✅ (Hit)
Take Profit 2: 2876.95 ✅ (Hit)
Take Profit 3: 2903.76 ✅ (Hit)
Take Profit 4: 2925.85 ✅ (Hit)
We observed three reversals of 20–40 pips, highlighted with red circles.
New Take Profit Levels Added: TP5, TP6, TP7, and TP8
Key Focus Areas:
Identify Key Levels, Resistance, Support, and watch EMA5 closely. EMA5 behavior will determine the next price direction.
Key Levels:
Key Level: 2900
Resistance Levels: 2925, 2952, 2984, 3017, 3052
Support Levels: 2876, 2852, 2828, 2803, 2776, 2747
EMA5 Status:
Current EMA5: 2898.14
Bullish Targets
EMA5 cross and hold above 2900, will open the following bullish target 2925 again
EMA5 cross and lock Above 2925, will open the following bullish target 2952
EMA5 cross and lock Above 2952, will open the following bullish target 2984
EMA5 cross and lock Above 2984, will open the following bullish target 3017
EMA5 cross and lock Above 3017, will open the following bullish target 3052
Bearish Targets
EMA5 hold and cross Below 2900: will open the following bearish target 2876
EMA5 cross and lock Below 2876: will open the following bearish target 2852
EMA5 cross and lock Below 2852: will open the following bearish target 2828
EMA5 cross and lock Below 2828: will open the following bearish target 2803(Retracement Range)
EMA5 cross and lock Below 2803: will open the following bearish target 2747 (Swing Range)
Trading Plan:
* Stay bullish and buy pullbacks from key levels.
* Avoid chasing tops—focus on buying dips.
* Use smaller timeframes for entries at Goldturn levels.
* Aim for 30–40 pips per trade for optimal risk management.
* Each level can yield 20–40+ pips reversals.
Trade with confidence and discipline. Stay tuned for our daily updates! Please support us with likes, comments, and follows to keep these insights coming.
📉💰 The Quantum Trading Mastery

GOLD 1H CHAR ROUTE MAP & TRADING PLAN FOR THE WEEKGOLD 1H Chart – 12th Feb 2025
Dear Traders,
Here’s the latest 1H chart analysis, outlining key levels and targets for the week.
Gold is currently trading between two critical levels, with a gap above 2905 and below 2883. A confirmed EMA5 crossover and lock above or below these levels will indicate the next price direction. Until then, expect price fluctuations as these levels are tested repeatedly.
Keep in mind that Inflation and CPI data are due today and tomorrow. While fundamental analysis plays a role in predicting gold's movement, our advanced technical analysis is essential for precise entry and exit points during these volatile geopolitical times.
Our strategy remains focused on buying dips and monitoring key levels to identify potential bounce opportunities. Stay sharp!
Resistance Levels: 2905, 2920, 2942, 2963, 2982, 3001, 3021, 3043
Support Levels: Gold Turn Levels : 2883, 2852, 2837, 2817,
Retracement Range: 2802 - 2817
Swing Range: 2747
EMA5 (Red Line) Analysis:
* Currently fluctuating between 2886 and 2905
* EMA5 positioning will be crucial in determining the next trading direction.
Bullish Targets:
EMA5 cross and lock Above 2905 → will open the following bullish Target 2920 ✅Done
EMA5 cross and lock Above 2920 → will open the following bullish Target 2942 ✅Done
EMA5 cross and lock Above 2942 → will open the following bullish Target 2963
EMA5 cross and lock Above 2963 → will open the following bullish Target 2982
EMA5 cross and lock Above 2982 → will open the following bullish Target 3001
EMA5 cross and lock Above 3001 → will open the following bullish Target 3021
EMA5 cross and lock Above 3021 → will open the following bullish Target 3043
Bearish Targets:
EMA5 cross and lock Below 2883 → will open the following bearish Target 2852
EMA5 cross and lock Below 2852 → will open the following bearish Target 2837
EMA5 cross and lock Below 2837 → will open the following bearish Target 2817
EMA5 cross and lock Below 2817 → will open the following bearish Target 2802 (Retracement Range)
EMA5 cross and lock Below 2802 → will open the following bearish Target 2747 (Swing Range)
Trading Plan:
* Stay bullish and buy pullbacks from key levels.
* Avoid chasing tops—focus on buying dips.
* Use smaller timeframes for entries at Goldturn levels.
* Aim for 30–40 pips per trade for optimal risk management.
* Each level can yield 20–40+ pips reversals.
Trade with confidence and discipline. Stay tuned for our daily updates! Please support us with likes, comments, and follows to keep these insights coming.
📉💰 The Quantum Trading Mastery

GOLD DAILY CHART MID/LONG TERM UPDATEGOLD Daily Chart Update: 17the FEB 2025
Hello Traders,
Here’s the latest update on the GOLD daily chart, which we've been closely monitoring and trading. Below, we break down recent price movements, updated key levels, and provide actionable insights for the days ahead.
Recap of Recent Chart Success!
Our recent analysis has proven highly accurate:
ENTRY LEVEL 2744: ✅ Achieved
TARGET TP1 (2807): ✅ Achieved
TARGET TP2 (2870): ✅ Achieved
TARGET TP3 (2933): ✅ Achieved
What’s Next for GOLD? Bullish or Bearish?
Last week, GOLD reached an all-time high of 2942.59. Currently, the price is fluctuating between the gap above 2933 and the gap below 2870. 2933 is acting as a key resistance level, and an FVG (Fair Value Gap) has formed to reinforce this resistance. As a result, our GoldTurn levels are now activated as key support zones.
KEY LEVEL: 2870
Resistance Levels: 2933, 2990, 3051
Support Levels (GoldTurn Levels): 2870, 2801, 2744, 2671, 2595
EMA5 Behavior:
* Or If EMA5 crosses and locks above 2933, it strengthens the bullish case.
* If EMA5 fails to hold above 2870, cross and lock below this level 2870, expect a pullback to key GOLDTURN levels below.
Recommendations:
* Capitalize on Dip Opportunities: Use smaller timeframes (1H, 4H) to trade around GOLDTURN levels, targeting 30–40 pips per trade.
* Stay focused on shorter trades in this range-bound market to manage volatility effectively.
Long-Term Bias:
Maintain a bullish outlook while viewing pullbacks as buying opportunities.
Accumulate positions near key support levels for a safer approach instead of chasing highs.
Final Note:
Trade with confidence and precision. Our analysis ensures you’re well-prepared to navigate the evolving market landscape. Stay updated with our daily insights across multiple timeframes for deeper clarity.
Thank you for your continued trust! Don’t forget to like, share, and comment to support our work.
Best regards,
The Quantum Trading Mastery Team
