3.27 Technical Analysis of Gold Short-term OperationsOn Thursday (March 27) in the Asian weekly session, the gold price (XAU/USD) was still consolidating around the $3,020 level, and the overall market sentiment was cautious.
Fundamental analysis:
US economy and Fed trends
Geopolitical and tariff uncertainties
Technical analysis:
Gold prices continued to consolidate at high levels after breaking through $3,000, and are still above the short-term moving average, with an overall bullish trend.
Moving average and trend: The moving average is in a bullish arrangement, indicating that the short-term and medium-term upward momentum has not been destroyed. The price fluctuates repeatedly between MA14 (3021) and MA200 (3017). If the market can stay above these two moving averages in the future, the upward momentum is expected to continue.
Key resistance and Fibonacci retracement: Fibonacci retracement 0.236 corresponds to around $3038, which also coincides with the high point formed in the previous period. If the price falls below the Fibonacci 0.618 position (about $3,000), we need to be alert to the risk of technical adjustments to find $3,000 or even deeper support.
Goldprediction

GOLD ROUTE MAP UPDATEHey Everyone,
Another great day on the markets today, allowing us to bounce between the Goldturns, inline with our plans to buy dips. Not much to report as we are seeing Gold range sideways consolidating ready for a breakout.
We still have the gap left open at 2999, which fell short by a few pips. We will continue to use the lower Goldturns to buy dips until we see the weighted levels cross and lock to confirm the next range. Failure to break 3032 will keep seeing rejections into the lower Goldturns for the bounces.
We will keep the above in mind when taking buys from dips. Our updated levels and weighted levels will allow us to track the movement down and then catch bounces up.
We will continue to buy dips using our support levels taking 30 to 40 pips. As stated before each of our level structures give 20 to 40 pip bounces, which is enough for a nice entry and exit. If you back test the levels we shared every week for the past 24 months, you can see how effectively they were used to trade with or against short/mid term swings and trends.
BULLISH TARGET
3032 - DONE
EMA5 CROSS AND LOCK ABOVE 3032 WILL OPEN THE FOLLOWING BULLISH TARGET
3050
EMA5 CROSS AND LOCK ABOVE 3050 WILL OPEN THE FOLLOWING BULLISH TARGET
3065
EMA5 CROSS AND LOCK ABOVE 3065 WILL OPEN THE FOLLOWING BULLISH TARGET
3080
EMA5 CROSS AND LOCK ABOVE 3080 WILL OPEN THE FOLLOWING BULLISH TARGET
3097
BEARISH TARGETS
3015 - DONE
EMA5 CROSS AND LOCK BELOW 3015 WILL OPEN THE FOLLOWING BEARISH TARGET
2999
EMA5 CROSS AND LOCK BELOW 2999 WILL OPEN THE FOLLOWING BEARISH TARGET
2978
EMA5 CROSS AND LOCK BELOW 2978 WILL OPEN THE SWING RANGE
SWING RANGE
2950 - 2927
As always, we will keep you all updated with regular updates throughout the week and how we manage the active ideas and setups. Thank you all for your likes, comments and follows, we really appreciate it!
Mr Gold
GoldViewFX

Short Position Targeting Below $3,000🔍 Market Analysis After Durable Goods Orders Release
The latest Durable Goods Orders (MoM) for February 2025 were released today, showing a surprising 0.9% increase, while economists had expected a 1.0% decline. However, core capital goods orders fell by 0.3%, indicating weaker business investment.
These mixed figures create uncertainty in the markets. The strong durable goods orders support the U.S. dollar, while the drop in business investment may signal economic concerns. In the short term, the expectation that the Federal Reserve (Fed) will not rush to cut interest rates could put pressure on gold prices.
📉 Trading Idea: Short Gold from $3,025 to Below $3,000
Entry: $3,025 (already opened)
Gold is currently trading around $3,025, showing signs of weakness near resistance levels.
Why This Short Trade Makes Sense:
1️⃣ U.S. Economic Data Supports the Dollar
The unexpected rise in durable goods orders suggests economic resilience.
A stronger U.S. dollar typically weighs on gold prices.
2️⃣ Lower Expectations for Fed Rate Cuts
These data points may reduce expectations for imminent Fed rate cuts.
Higher rates increase the opportunity cost of holding gold, which is bearish for gold.
3️⃣ Technical Resistance & Downward Momentum
Gold has struggled to break above $3,025 - $3,035 multiple times.
If this level holds, we could see a drop below $3,000 soon.
📊 Price Targets & Stop-Loss
🎯 First Target: $3,000 (psychological support level)
🎯 Second Target: $2,985 - $2,975 (next key technical support zone)
📌 Risk-Reward Ratio (RRR):
Entry: $3,025
Target: at least $3,000
RRR = 1.66 : 1 – a solid setup for a short-term trade.
🧐 Potential Risks to the Trade
⚠ If the U.S. Dollar Weakens:
If markets interpret weak core capital goods orders as a sign of economic slowdown, the Fed might shift to a more dovish stance, weakening the dollar and boosting gold.
⚠ If Geopolitical Tensions Increase:
Rising geopolitical risks (e.g., China, Middle East) could drive safe-haven demand for gold, pushing prices higher.
📌 Conclusion: Bearish Setup for Gold
Today’s Durable Goods Orders release supports a stronger U.S. dollar, while gold is struggling to break resistance at $3,025 - $3,035. As long as this zone holds, the probability of a correction below $3,000 remains high.
🟢 Plan:
Short at $3,025 is active.
Target: Below $3,000.
Gold remains volatile – keep an eye on the U.S. dollar, Fed policy, and market sentiment for further confirmation! 🔥🚀
-------------------------------------------------------------------------
This is just my personal market idea and not financial advice! 📢 Trading gold and other financial instruments carries risks – only invest what you can afford to lose. Always do your own analysis, use solid risk management, and trade responsibly.
Good luck and safe trading! 🚀📊

Gold has been in a good range recently, which is perfect!Congratulations to everyone for realizing the range idea again。It should be noted here that since the bulls rose strongly in the early stage, the market turned to bearish, or the rhythm of bullish adjustment will not be so fast. Therefore, yesterday's daily line turned positive, not the return of bulls, but a correction in the process of decline. On the one hand, the adjustment of bulls is not enough, and the indicators show that there is still further exploration. On the other hand, although the current shock has rebounded, the strength is not strong and the continuity is poor. It is a shock upward trend and may fall at any time. Be cautious when looking at bullish. Only by matching the market and the time point can you get the correct direction. Trading focuses on ideas and planning, and doing yourself well is more important than anything else.If your current gold operation is not ideal, I hope to help you avoid detours in your investment. The information I recently shared about the gold market has received a lot of feedback, and everyone said it was very helpful! If you don’t know when to enter the market, you can follow me 🌐, I will release specific signals in real time, remember to pay attention to the bottom 🌐 signal in time.
Gold hourly line pattern chart;
Gold once touched the 3002 line to stabilize, and the daily line level fell back three times in a row. There is still room for decline in the short term. Pay attention to the obvious support of the 3000 mark below. If it does not break, it will still be a repeated trend. On the contrary, there will be a continuous decline. In terms of operation, continue to go short on the rebound! Operation suggestion: short at 3025-3030. The target is 3016-3010. On the contrary, if it falls back to 3010-3005, go long and the target is 3020-3025.

So amazing! Accurate again, follow-up strategyToday, the first wave of gold price retreated from around 3026 to around 3013 in the Asian session. The lower support is obviously moving up gradually. Yesterday's white session also started to rise from above 2310. The two retracements before the US session only reached 3014 before rebounding quickly. At present, the focus on the upper side is the suppression of 3030-35. The hourly line of gold is now oscillating in the range box. Only after gold breaks through the box, will the gold market appear. Gold hit the 3035 line on Tuesday, but gold quickly fell back after hitting the high. We actually shorted at the 3032 line. The perfect harvest was harvested after stepping back. Gold did not break through the 3030-35 line suppression we mentioned above. If it breaks through the 3035 line and stands firm, then the bulls will rise and hit a new high. Our operation of stepping back to do more ideas remains unchanged, but we should not chase more directly, otherwise the adjustment of stepping back will be more uncomfortable. Be a steady hunter and wait quietly for the appearance of prey.
From the 4-hour trend, the upper short-term resistance focuses on 3030-35, and the lower support focuses on 3000-3005. Relying on this range, the layout of the long and short oscillation range is maintained. In the middle position, watch more and move less and chase orders cautiously, and wait patiently for key points to enter the market. I will inform you of the specific operation strategy in time. Gold operation strategy: 1. Go long when gold falls back to 3010-3000. If the subsequent market breaks through the 3035-3040 resistance line, we will adjust whether to go short based on the technical and news aspects and notify everyone in time.If your current gold operation is not ideal, I hope to help you avoid detours in your investment. The information I recently shared about the gold market has received a lot of feedback, and everyone said it was very helpful! If you don’t know when to enter the market, you can follow me 🌐, I will release specific signals in real time, remember to pay attention to the bottom 🌐 signal in time.

Gold’s rebound is an opportunity for short sellingGold is still oscillating, and a rebound is an opportunity for short selling. Since gold is still oscillating within the box, you can go short if it rebounds to a high level. Gold is still oscillating within a large range for 1 hour. Since gold has not effectively broken through, you can continue to short after rebounding. If it breaks through the box shock, then gold will consider taking advantage of the trend and go long.

XAUUSD sell signal* zone at 3039 - 3044.5
_SL: 30 pips above the entry zone (3048)_
* tp1 - 3031
* tp2 - 3027
* tp2 - 3021
* tp4 - open
*take entry with proper confirmation M15/M5/M1 📊*

3.26 Technical analysis suggestions for short-term gold operatioIn the early European trading on Wednesday (March 26), spot gold continued to rebound in the short term, and the current gold price is around $3027/ounce.
Gold technical analysis, how to operate in the evening? ——
The daily chart of gold shows that gold prices are rising above all bullish moving averages, while setting higher highs and higher lows. The 20-day simple moving average (SMA) has gained upward momentum and currently provides dynamic support around 2954.70. At the same time, after correcting the extreme overbought conditions, technical indicators resumed their upward trend within the positive level. From the 4-hour line, gold prices are fighting against the mildly bearish 20-period SMA, but are still well above the bullish 100-period SMA and 200-period SMA. At the same time, technical indicators are retreating from the midline and slightly lower within the neutral level. Overall, it is recommended to treat gold operations with a wide range of fluctuations today!
Gold operation strategy at night:
Short order strategy: short near 3031 above, stop loss 3040, target near 3010;
We will update regularly every day and introduce to you how we manage active ideas and settings. Thank you for your likes, comments and attention, we are very grateful

XAUUSD Bull or Bear? This is what i get (i hope so)Need to reach resistant then go down again, thanks me later

Interval oscillation, opportunities are within your graspMy dear friends, the gold range idea has been fulfilled again. Do you still remember the batch shorting gold strategy we laid out before? Facts have proved that our vision and judgment are extremely accurate! At present, the gold price has successfully reached the target area. Congratulations to everyone for making a profit again. This wave of operations is simply beautiful. I am honored to be recognized and encouraged by everyone. We set sail on the road of trading. I will bring my trading strategy plan, and you will bring your execution discipline. I believe we will definitely have good results.
But investment is never a one-shot deal. The current profit is only a phased result. The gold market has always been turbulent, and the subsequent trend is full of uncertainty. The operation strategy plan can first refer to the unchanged range thinking method I mentioned earlier, the high-altitude and low-multiple operation strategy, and conduct in-depth technical and news analysis. Gold will temporarily maintain a volatile thinking approach. The large range focuses on 3035-3000, and is in horizontal consolidation. In the 4H cycle, the Bollinger Bands are also in a closed state, and the K-line is interlaced at the middle track. In the short-term sideways consolidation and accumulation stage, the operation relies on 3035 as the critical point of adjustment. Below this position, continue to look at the callback, recover and stabilize, and then adjust the thinking. Pay attention to the support of 3012 and 3000 below. Maintain high-altitude and low-multiple operations as a whole, and follow up after the breakthrough. The specific operation is combined with the short-term pattern. Once there is a new change, I will inform you as soon as possible. Operation suggestion: Gold is short near 3030-35, and the target is 3020 and 3015! It is long near 3010-3000. The target is 3015 and 3026!If your current gold operation is not ideal, I hope to help you avoid detours in your investment. The information I recently shared about the gold market has received a lot of feedback, and everyone said it was very helpful! If you don’t know when to enter the market, you can follow me 🌐, I will release specific signals in real time, remember to pay attention to the bottom 🌐 signal in time.

Gold Faces Repeated Rejections, Bearish Outlook RemainsAlthough gold has yet to confirm a significant downtrend, it has faced multiple rejections around the 3030-3040 resistance zone in recent sessions. Notably, after touching 3036 yesterday, gold experienced a sharp pullback, forming a long upper shadow on the candlestick chart. This price action has diminished the supportive effect of the underlying W-bottom structure.
If gold continues to struggle to break above the 3030-3040 zone, the current seemingly strong price action may prove to be a false signal, merely a setup for a subsequent decline. Additionally, with geopolitical risks easing and no significant fundamental drivers supporting further upside, I remain optimistic about a bearish continuation in gold.
We can consider scaling into short positions within the 3028-3038 range, patiently targeting a retest of the 3010-3000 zone. A confirmed break below 3000 could accelerate further downside toward the 2995-2985 region.
I would make more detailed trading plans and trading signals every day according to the real-time market situation, which is also the testimony of every successful transaction and profit of mine; the article has a certain lag, if you want to copy the trading signals to make a profit, or master independent trading skills and thinking, you can choose to join the channel at the bottom of the article

Gold is expected to rise to the 3030-3040 zone againGold encountered a clear rejection signal after reaching around 3036, indicating the presence of resistance and a technical need to retest support. Currently, gold is undergoing this support retest.
Within the current structure, gold has established a notable W-bottom pattern, with key support formed around the 3000 and 3003 levels. This structural support remains relatively strong. If gold manages to hold above the 3015-3005 support zone during the retest, a renewed upward move is likely. In that scenario, gold could resume its ascent, potentially retesting the 3030-3040 resistance range.
So in terms of short-term trading, if gold pulls back to the 3015-3005 zone, we can consider going long on gold in moderation.I would make more detailed trading plans and trading signals every day according to the real-time market situation, which is also the testimony of every successful transaction and profit of mine; the article has a certain lag, if you want to copy the trading signals to make a profit, or master independent trading skills and thinking, you can choose to join the channel at the bottom of the article

Gold hit 3300 , why not ? The Conference Board (a non-profit research organization in the United States, specializing in providing reports and analysis on economic issues, jobs, labor markets and long-term trends) announced on Tuesday that the US consumer confidence index fell to 92.9, down from a revised 100 in February.
This data was weaker than expected, as economists had predicted a smaller decline, only falling to 94.2.
Société Générale (SocGen - a large multinational bank based in France) has just announced its multi-asset portfolio strategy for the second quarter. The bank still holds 7% of its portfolio in gold and forecasts that the price of gold could reach $4,000/ounce.
At 7%, gold remains the largest commodity position in SocGen’s portfolio. “Gold remains a strong asset amid the geopolitical reshaping of the US, which has triggered strong policy responses,” the analysts said.
Although gold prices are currently hovering above $3,000 an ounce, SocGen expects gold prices to continue to rise. The French bank forecasts gold prices to average around $3,300 an ounce in the fourth quarter.
Geopolitical uncertainty continues to support gold as an important global currency, the analysts said. They also pointed to conditions that could push prices to $4,000 an ounce.

Gold------Buy near 3013, target 3030-3040Gold market analysis:
Gold has been fluctuating this week, and daily buying and selling have begun to compete. I estimate that this week will fluctuate first, and the direction will begin in the second half of the week. Today has entered the end of the fluctuation. We will follow up with new ideas if it breaks through. The current large fluctuation range is 3000-3037. Yesterday, the daily line closed with a small positive, but the upper shadow line was relatively high. The daily line now has no obvious direction. The 5-day line and the 10-day line of the daily line have begun to merge. Today's Asian session will maintain a small range of fluctuations to treat both long and short opportunities. If it breaks through 3000-3037 at night, either side should actively follow. The current small fluctuations have not changed the buying trend of the large cycle, but the top is still very obvious.
In the Asian session, gold should first focus on the space between 3013 and 3035. If the Asian session falls back to 2013 first, look for buying opportunities. The low point of the Asian session is 3016. The support of the Asian session is around 3016-3013. The suppression position is the high point of yesterday. The volatile market must be controlled well, otherwise it is easy to get on the train midway and it is difficult to catch profits.
Support 3016-3013. Strong support 3000, suppression 3035-3037, the watershed of strength and weakness of the market is 3020.
Operation suggestion:
Gold------Buy near 3013, target 3030-3040

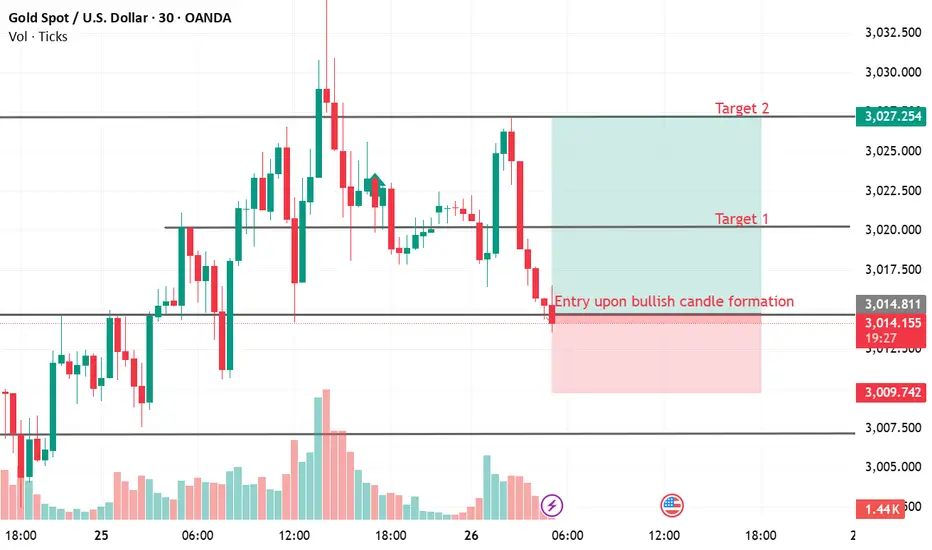
GoldGold (XAU/USD) Technical Analysis – March 26, 2025
📊 Current Price: $3,015
📈 Entry Zone: Waiting for a bullish candle confirmation at support
🎯 Target 1: $3,020
🎯 Target 2: $3,027
🛑 Stop Loss: Below $3,009
Analysis Summary:
Gold is testing support around $3,015 with a possible bullish reversal.
A bullish candle confirmation may indicate a move towards $3,020 and $3,027.
Risk management: Stop loss placed below $3,009 to limit downside.
Analysis of the latest gold price trends!Market news:
In the early Asian session on Wednesday (March 26), spot gold fluctuated in a narrow range and is currently trading around $3,017/ounce. London gold prices rose slightly on Tuesday, temporarily staying above the 3,000 integer mark. On the one hand, tariff concerns still provide safe-haven support, and on the other hand, the poor performance of US consumer confidence data dragged down the trend of the US dollar and US bond yields, providing support for international gold prices! There is uncertainty about Trump's tariff plan to be announced next week. Investors are worried about the world situation, especially US policies, so they buy gold investment as an alternative asset because they are worried that the US government may plunge the world into a global recession. Supported by safe-haven demand, gold prices rose. It is generally expected that Trump's tariff policy will drag down economic growth, trigger further trade tensions, and push up inflation. Currently waiting for the US personal consumption expenditures (PCE) price index to be released on Friday to look for hints about the Fed's further policy moves. In addition, investors need to pay attention to the performance of the initial monthly rate of durable goods orders in the United States in February on this trading day. Meanwhile, the United States said it had reached agreements with Ukraine and Russia to ensure safe navigation in the Black Sea and prohibit strikes on energy facilities in both countries. Investors need to pay attention to changes in risk aversion in the market.
Technical Review:
Technically, the gold daily line closed with a small positive repair yesterday, and the price closed within the range of MA10-7-day moving average. The Bollinger bands of the hourly chart and the four-hour chart were all closed, and the early price of 3020 was in the middle track of the Bollinger band adjustment! The upper track of the four-hour chart suppressed the 3038 line, the lower track supported the 3003 line, the MA10/7-day moving average was glued, and the RSI indicator was flat. It is expected that the gold price will continue to fluctuate in a wide range, and the trading idea will still be based on high-altitude swing trading, and low-multiple auxiliary short-term participation.
Today's analysis:
Gold is currently temporarily maintaining a high level of shock repair in the daily trend. In the 4-hour level trend, after continuous shocks, the technical pattern has gradually been repaired. The short-term moving average has gradually turned upward and diverged. The K line has slowly stood on the short-term moving average. In the short-term trend, it is maintained in a stronger trend. The current price is temporarily under pressure around 3035. However, the overall market is still volatile. The US market reached 3036 at the highest and fell back under pressure. This position is the 618 resistance of the decline and rebound. At the same time, it has risen three times. Note that more positions are required. Today, you can pay attention to the 3005/3008 support to buy. In the short-term, the shock market can be seen. Both buying and selling can participate. In the hourly level trend of gold, the price has fallen back after touching the previous pressure zone. In the short-term trend, the technical pattern has also begun to weaken. It tends to have a certain adjustment space in the short term, but the strength needs to be considered. At present, the bottom divergence pattern has formed on the hourly chart. At the same time, the short-term moving average has turned upward. It is expected that gold will still have a rebound demand in the short term. If the gold price stabilizes above $3,010, the short-term target will be in the $3,035-3,045 range, and further breakthroughs are expected to test the $3,050 line.
Operation ideas:
Buy short-term gold at 3005-3008, stop loss at 2996, target at 3020-3030;
Sell short-term gold at 3033-3035, stop loss at 3044, target at 3000-3010;
Key points:
First support level: 3013, second support level: 3005, third support level: 2992
First resistance level: 3032, second resistance level: 3038, third resistance level: 3046

XAU/USD(20250326) Today's AnalysisToday's buying and selling boundaries:
3021.00
Support and resistance levels
3049
3038
3031
3010
3003
2992
Trading strategy:
If the price breaks through 3031, consider buying, the first target price is 3038
If the price breaks through 3021, consider selling, the first target price is 3010

3.26 Technical analysis of short-term gold operationsGold is still supported by risk aversion, but it quickly fell back after rising. In fact, the support of safe-haven gold is not surprising. However, since the gold bulls did not continue, it means that the space for gold bulls is also limited. Gold rose and fell in the US market. Gold was directly short at 3032. Gold fell as expected. The US market rebounded high and was still short.
Gold's 1-hour moving average is still in a downward dead cross. Gold bulls cannot reverse the situation. Gold fell directly to 3035 in the US market under pressure.
Support level: 3018 3005 3000
We will update regularly every day and introduce to you how we manage active ideas and settings. Thank you for your likes, comments and attention, we are very grateful

XAUUSD The ultimate Sniper Entry Plan for 25 March 2025XAU/USD - Daily Review & Sniper Entry Plan - March 25th, 2025
✨ Overall Bias:
Monthly: Bullish, but with a candle showing exhaustion, potential pullback towards discount.
Weekly: Indecision, but we have a small CHoCH on the structure - possible correction towards the 2980 zone.
Daily: Clear bearish candle on Friday, followed by a mild correction on Monday. Liquidity grab below 3000, but close above.
🌐 Timeframe Breakdown:
D1:
Last confirmed CHoCH.
Imbalance and FVG in the 3022-3035 zone.
Potential bearish OB between 3031-3036.
RSI below 50, momentum fading.
H4:
Lower highs / lower lows structure.
Bearish confirmation: BOS + rejection from OB.
Imbalance 3016-3026.
EMA 21 and 50 acting as dynamic resistance.
H1:
Last CHoCH in the 3024 zone.
Bearish engulfing confirmation.
Unfilled FVG: 3016-3020.
RSI < 40, increasing volume on bearish candles.
M30 / M15:
BOS on M15 and retest in the area of interest.
Last swing high at 3018.13.
Liquidity above 3018 and 3024 (EQH), below 3000 (EQL).
🔹 Sniper Entry Scenarios
Scenario 1 (Short)
Entry: 3018 - 3022 (FVG zone + OB + 61.8% Fibonacci)
Confirmation: M15 bearish engulfing or BOS + retest.
SL: above 3028
TP1: 3000
TP2: 2985 (discount zone + liquidity)
Scenario 2 (Long - Countertrend/Scalp)
Entry: 2985 - 2990 (liquidity zone )
Confirmation: M15 BOS + bullish pattern (engulfing/pin)
SL: below 2979
TP1: 3000
TP2: 3015
🔹 POI (Key Zones):
3022-3028: FVG + OB + 61.8% Fibonacci - potential short zone
3018.13: EQH - liquidity inducement
2985: Daily OB + 78.6% Fibonacci - potential buy zone
🌍 EMA Guide:
EMA 5 < 21 on H1 and M30: bearish momentum
EMA 50 acting as dynamic resistance (on H1: 3022)
🔹 Conclusion: Favorable short on retracement to the 3018-3022 zone with confirmation. Target remains the 2985 zone for liquidity. Market response around 2985 will give clarity for potential buy/scalp.
⏳ Expectations: After the Daily close, we can expect liquidity inducement towards 3020+, followed by a dump towards 2990-2985.
🔔 Don't forget to Like, Share, and Follow for more updates! Let's hit that target together! 💰📈
👉 Like if you found this helpful and follow for future setups!

GOLD ROUTE MAP UPDATEHey Everyone,
Another great day on the markets today with out plans to buy dips playing out perfectly. We had the gap left open at 2999 yesterday, which had the move down but just fell short of the full gap. We were able to use the dip to ride back up to our bullish target 3032 once again.
No further lock above 3032 confirmed the rejection again. We are looking for this level to break to confirm a continuation. Failure to break this level will keep seeing rejections into the lower Goldturns for the bounces. We also need to keep in mind the full gap at 2999, inline with our plans to buy dips.
We will keep the above in mind when taking buys from dips. Our updated levels and weighted levels will allow us to track the movement down and then catch bounces up.
We will continue to buy dips using our support levels taking 30 to 40 pips. As stated before each of our level structures give 20 to 40 pip bounces, which is enough for a nice entry and exit. If you back test the levels we shared every week for the past 24 months, you can see how effectively they were used to trade with or against short/mid term swings and trends.
BULLISH TARGET
3032 - DONE
EMA5 CROSS AND LOCK ABOVE 3032 WILL OPEN THE FOLLOWING BULLISH TARGET
3050
EMA5 CROSS AND LOCK ABOVE 3050 WILL OPEN THE FOLLOWING BULLISH TARGET
3065
EMA5 CROSS AND LOCK ABOVE 3065 WILL OPEN THE FOLLOWING BULLISH TARGET
3080
EMA5 CROSS AND LOCK ABOVE 3080 WILL OPEN THE FOLLOWING BULLISH TARGET
3097
BEARISH TARGETS
3015 - DONE
EMA5 CROSS AND LOCK BELOW 3015 WILL OPEN THE FOLLOWING BEARISH TARGET
2999
EMA5 CROSS AND LOCK BELOW 2999 WILL OPEN THE FOLLOWING BEARISH TARGET
2978
EMA5 CROSS AND LOCK BELOW 2978 WILL OPEN THE SWING RANGE
SWING RANGE
2950 - 2927
As always, we will keep you all updated with regular updates throughout the week and how we manage the active ideas and setups. Thank you all for your likes, comments and follows, we really appreciate it!
Mr Gold
GoldViewFX

Gold Likely to Extend Decline Toward the 2995-2985 ZoneGold encountered resistance and pulled back after reaching around 3026 during the rebound, failing to break the descending channel effectively. In the short term, bearish momentum remains dominant. On the daily chart, gold has closed with three consecutive bearish candlesticks, it weakens rebound expectations and suggests further downside remains possible.
The key short-term level to watch is around 3010. If gold breaks below this level during the pullback, the downtrend structure will become more pronounced. This would likely lead to another test of the 3000 level, with further downside potential extending toward the 2995-2985 range.
I remain committed to shorting gold on rebounds. My primary plan is to enter short positions within the 3020-3030 range. I will make more detailed trading plans and trading signals every day according to the real-time market situation, which is also the testimony of every successful transaction and profit of mine; the article has a certain lag, if you want to copy the trading signals to make a profit, or master independent trading skills and thinking, you can choose to join the channel at the bottom of the article

Go long and win, then go short on the reboundToday, the layout of gold is to go long in batches near 3005-3008, and 3020 is a successful profit. Now the rebound continues to go short.
In terms of the daily line structure, yesterday's rebound of gold first touched the pressure of the 5-day line, and then the market retreated to the vicinity of the 10-day line. The overall trend is in line with expectations, fluctuating within the daily average range, and the rhythm of rising first and then falling also increases the expectation of the continuation of the short-term market adjustment. The pressure of the 10-day line can continue to be paid attention to on the upper side of gold during the day, but the 10-day line has now moved down to the vicinity of 3027, and today's market opened near the 5-day line 3012. Combined with the trend of the hourly chart, gold fell again to the vicinity of 3000 overnight, indicating that the short-term trend still follows the technical trend, but the main sentiment of the market is still controlled by the bulls. If the fundamentals unexpectedly break out with good news, the bulls' sentiment may go crazy at any time. In the day, we can pay attention to the pressure near the short-term trend line 3025 on the upper side of gold, and continue to pay attention to the competition around 3005-00 on the lower side. If 3000 is lost, we will look for a larger space to retrace. If the market has been fluctuating above 3000 today, the risk of short-term market variables will increase.
For specific operations, it is recommended to be short at 3020-3025, and look at 3015-3005.
If your current gold operation is not ideal, I hope to help you avoid detours in your investment. The information I recently shared about the gold market has received a lot of feedback, and everyone said it was very helpful! If you don’t know when to enter the market, you can follow me 🌐, I will release specific signals in real time, remember to pay attention to the bottom 🌐 signal in time.

Gold - Short Term Sell Idea Update!!!Hi Traders, on March 20th I shared this idea "Gold - Expecting Retraces and Further Continuation Lower"
We expected to see retraces and further continuation lower. You can read the full post using the link above.
The bearish move delivered, as expected!!!
If you enjoy this idea, don’t forget to LIKE 👍, FOLLOW ✅, SHARE 🙌, and COMMENT ✍! Drop your thoughts and charts below to keep the discussion going. Your support helps keep this content free and reach more people! 🚀
-------------------------------------------------------------------------------------------------------------------
Disclosure: I am part of Trade Nation's Influencer program and receive a monthly fee for using their TradingView charts in my analysis.
