GOLD WEEKLY CHART MID/LONG TERM ROUTE MAPHey Everyone,
Please see update on the weekly chart idea that we have been tracking for over a while now and now fully complete.
After completing 2856 target, we were left with candle body close above 2856 leaving a gap to 2976 but needed ema5 lock to further confirm this. We then had the ema5 lock last week to further confirm the long range gap above. This gap was completed last week completing this chart idea and with plenty of time for us to get in for the action, just perfect!!!
This is the beauty of our channels, which we draw in our unique way, using averages rather than price. This enables us to identify fake-outs and breakouts clearly, as minimal noise in the way our channels are drawn.
We will now update a new weekly chart idea for our long term analysis, targets and gaps next week. Please keep an eye out for it.
Thank you all for your likes, comments and follows, we really appreciate it!
Mr Gold
GoldViewFX
Goldprediction

Gold the possible next move on a bullish trend The Gold on H4 Possible next move,
On 4H timefirame the Gold is still bullish but to validate the trend must respect the 2955-50 zone.
This is the outlook for next weekend; we will wait for the levels to be traded.
1. Put a sell order if gold breaks the 2978 zone with strong momentum and make sure that the real breakout happened.
2. Put buy at the 2955-50 zone with proper confirmations. If the price tests the 2955-50 zone and you will identify any pullback indications and some strong price rejections in M30 and H1, then put a buy order with a proper stop loss.
*Note*
*Here is the possible trades after the confirmations*
Gold Selling Zone: 2978-77
Stop loss: 2983
Take Profit: 2955
*Gold Buying Zone: 2955-50*
Stop Loss: 2945
Take Profit: 2990-3000
*Please read the information and possible directions listed above.*

Very good price setup for Gold spot16 March 2025
There are 2 setups for xauusd which will bring good return / risk.
Buy 1: entry as photo, exit at rr. 13
Buy 2: incase of buy 1 failure, enter buy 2 order rr 14

GOLDHello friends
Given the high price growth, we are now witnessing a trend continuation pattern, but we also need a price correction.
So we have identified important ranges for you, which if reached can be traded with capital and risk management...
*Trade safely with us*

Gold swing trade week 16/03/25Last week he had a trade from 2880 that ran for 1244 pips congragulations if you took it.
This week we are looking for a sell then leading into a buy at previous resistance.
Current Price Action:
Gold is trading near $2,984, slightly rejecting resistance.
The price is respecting the ascending channel with higher highs and higher lows.
Support & Resistance Levels:
Immediate Resistance: Around $2,998 - $3,000, psychological and technical resistance.
Key Support: 2,961 - $2,965 (potential buy zone).
Next Major Resistance: 3,021 - 3,030 (Fibonacci extension + trendline target).
Fibonacci Levels:
The 0.618 Fibonacci retracement around 2,964 aligns with a potential buy entry.
The 0.382 retracement at 2,996 acts as immediate resistance.
Trendlines & Channel:
Price is respecting the bullish channel.
A break above 3,000 could push XAU/USD toward 3,021 - 3,050.
If price breaks below 2,961, a retracement to 2,930 - 2,900 is possible.
Moving Averages:
Short-term EMA (White) is above the Green MA, signaling continued bullishness.
If the price holds above 2,965, bulls remain in control.

Gold weekly chart with buy and sell levels 15/03/25Gold has achieved new all-time highs this week, breaking the 3000 level before retreating to 2982. As we look ahead to the coming week, I've outlined key buy and sell levels on this 4-hour Gold chart, along with potential entries.
For a buy, consider entering at 2988, targeting 2990 as the first resistance. If this level is surpassed, the next resistance range could be around 3000 to 3005. It's important to follow the chart levels closely and secure profits along the way.
For a sell, an entry at 2977 could aim for a move down to 2970, with subsequent targets around 2962 to 2960 as resistance levels. Stick to the marked entries on the chart for better clarity and control.
As always use proper risk management , take profit along the way and dont overleverage

Expect a strong pull back on Gold next week!Hello traders,
We have seen that Gold experienced a significant bullish trend last week, culminating in surpassing the $3,000 per ounce milestone for the first time on March 14, 2025.
Several factors contributed to this surge:
1. Market Uncertainty Driving Safe-Haven Demand – With ongoing global economic tensions, particularly due to U.S. trade policies, investors are turning to gold as a reliable hedge against instability.
2. Central Banks Boosting Gold Reserves – Many central banks are increasing their gold holdings, adding steady buying pressure that supports rising prices.
3. Speculation on Interest Rate Cuts – Expectations that major central banks, especially the Federal Reserve, may lower interest rates have made gold more attractive, as it benefits from a low-rate environment.
4. Inflation Concerns Fueling Demand – With fears of rising inflation, investors see gold as a traditional store of value that can help preserve wealth over time.
For a long time, many investors expected gold to hit the $3000 mark. Gold broke through that level on Friday, but it ended the day below it. We can anticipate a significant pullback in gold by next week based on recent price action. And these are my thoughts: We will be looking for shorting possibilities below 2978.620, with an initial target of 2961.524 and an overall objective of 2931.979. On the other hand, we can disregard the initial assumptions and assume that the price will continue to grow if we observe that it keeps rising and closes above Friday's high.
How do you plan to trade gold next week traders? Let me know your thoughts in the comment section.

XAU/EUR "The Gold vs Euro" Metal Market Heist Plan🌟Hi! Hola! Ola! Bonjour! Hallo! Marhaba!🌟
Dear Money Makers & Thieves, 🤑 💰🐱👤🐱🏍
Based on 🔥Thief Trading style technical and fundamental analysis🔥, here is our master plan to heist the XAU/EUR "The Gold vs Euro" Metal Market. Please adhere to the strategy I've outlined in the chart, which emphasizes short entry. Our aim is the high-risk Green Zone. Risky level, oversold market, consolidation, trend reversal, trap at the level where traders and bullish thieves are getting stronger. 🏆💸Book Profits Be wealthy and safe trade.💪🏆🎉
Entry 📈 : "The vault is wide open! Swipe the Bearish loot at any price - the heist is on!
however I advise placing Sell Stop Orders below the breakout MA or Place Sell limit orders within a 15 or 30 minute timeframe. Entry from the most recent or closest low or high level should be in retest. I Highly recommended you to put alert in your chart.
Stop Loss 🛑: Thief SL placed at 2800 (swing Trade Basis) Using the 1H period, the recent / swing high or low level.
SL is based on your risk of the trade, lot size and how many multiple orders you have to take.
Target 🎯: 2680 (or) Escape Before the Target
🧲Scalpers, take note 👀 : only scalp on the Short side. If you have a lot of money, you can go straight away; if not, you can join swing traders and carry out the robbery plan. Use trailing SL to safeguard your money 💰.
📰🗞️Fundamental, Macro, COT, Sentimental, Positioning, Overall Outlook:
╰┈➤XAU/EUR "The Gold vs Euro" Metal Market is currently experiencing a bearish trend,., driven by several key factors.
╰┈➤Fundamental Analysis
Interest Rates: Fed at 3-3.5%, ECB at 2.5%—U.S. yield advantage pressures gold, ECB easing weakens EUR—neutral.
Inflation: U.S. PCE 2.6%, Eurozone 2.8%, Japan 2.5%—global inflation boosts gold’s hedge appeal—bullish.
Demand: Central banks (e.g., China, Russia) buy ~8M oz. in 2025; European ETF inflows up—bullish.
Geopolitics: U.S.-China tariffs, Russia-Ukraine tensions—safe-haven demand rises—bullish.
EUR Strength: ECB dovishness vs. Fed stability weakens EUR—bullish for XAU/EUR.
╰┈➤Macroeconomic Factors
U.S.: PMI 50.4, jobless claims up—USD softens, gold gains—bullish.
Eurozone: PMI 46.2, growth stagnant—EUR weakens—bullish.
Global: China 4.5%, Japan 1%—slow growth, risk-off favors gold—bullish.
Commodities: Oil $70.44 (U.S./OPEC)—stable, neutral.
Trump Policies: Tariffs (25% Mexico/Canada, 10% China)—EUR weakens, gold rises—bullish.
╰┈➤Commitments of Traders (COT) Data
Speculators: Net long ~50,000 contracts (global futures, down from 60,000)—cautious bullishness.
Hedgers: Net short ~60,000—stable, locking in highs.
Open Interest: ~120,000 contracts—sustained global interest, mildly bullish.
╰┈➤Market Sentiment Analysis
Retail: 55% short (global X posts)—contrarian upside risk—bullish.
Institutional: Bullish long-term (e.g., $3,000 XAU/USD targets), short-term caution—neutral.
Corporate: Global miners hedge at 2,750-2,800 EUR—neutral.
Social Media Trends: Mixed—bearish to 2,650 EUR, some see buy zone—neutral.
╰┈➤Positioning Analysis
Speculative: Longs target 2,750-2,800, shorts aim for 2,650-2,600 (global consensus).
Retail: Shorts at 2,710-2,720—squeeze risk if price rises.
Institutional: Balanced, favoring inflation-driven gold gains.
╰┈➤Quantitative Analysis
SMAs: 50-day ~2,650, 200-day ~2,500—price above both, bullish.
RSI: 52 (daily)—neutral, flexible for moves.
Bollinger: 2,670-2,730—price near upper band, breakout potential.
Fibonacci: 61.8% from 2,800-2,400 at 2,686—support holds.
Volatility: 1-month IV 11%—±30 EUR daily range.
╰┈➤Intermarket Analysis
EUR/USD: Below 1.0500—EUR weakness boosts XAU/EUR—bullish.
DXY: 106.00, softening—supports gold—bullish.
XAU/USD: 2910—aligned with XAU/EUR rise—bullish.
Equities: SPX500 5990, stable—neutral.
Bonds: U.S. 3.8% vs. Eurozone 2.2%—yield gap weakens EUR—bullish.
╰┈➤News and Events Analysis
Recent: Trump tariffs (Feb 23-25) and Russia-Ukraine talks—risk-off lifts gold—bullish.
Upcoming: U.S. PCE (Feb 28)—hot data could lift USD/EUR, pressuring XAU/EUR; soft data boosts gold—mixed.
Impact: Bullish short-term, PCE reaction pivotal.
╰┈➤Next Trend Move
Technical: Support 2,686-2,650, resistance 2,750-2,800. Below 2,686 targets 2,600; above 2,750 aims for 2,850.
Short-Term (1-2 Weeks): Dip to 2,650 if PCE strengthens USD/EUR; up to 2,800 if risk-off persists.
Medium-Term (1-3 Months): Range 2,600-2,900, driven by tariffs/inflation.
╰┈➤Future Prediction
Bullish: 2,850-2,900 by Q2 2025 if EUR weakens further (EUR/USD to 1.03), tariffs escalate, or PCE softens.
Bearish: 2,600-2,550 if PCE boosts USD/EUR (DXY to 107) or risk-on emerges.
Prediction: Mildly bearish short-term to 2,650, then bullish to 2,850 by mid-2025
╰┈➤Overall Summary Outlook
XAU/EUR at 2,700.00 benefits from bullish drivers (global inflation, geopolitics, EUR weakness) but faces short-term risks from USD/EUR strength (PCE). COT and sentiment suggest consolidation, with quant signals favoring upside if support holds. Short-term dip to 2,650 possible, medium-term rise to 2,900 likely with risk-off momentum.
📌Keep in mind that these factors can change rapidly, and it's essential to stay up-to-date with market developments and adjust your analysis accordingly.
⚠️Trading Alert : News Releases and Position Management 📰 🗞️ 🚫🚏
As a reminder, news releases can have a significant impact on market prices and volatility. To minimize potential losses and protect your running positions,
we recommend the following:
Avoid taking new trades during news releases
Use trailing stop-loss orders to protect your running positions and lock in profits
💖Supporting our robbery plan 💥Hit the Boost Button💥 will enable us to effortlessly make and steal money 💰💵. Boost the strength of our robbery team. Every day in this market make money with ease by using the Thief Trading Style.🏆💪🤝❤️🎉🚀
I'll see you soon with another heist plan, so stay tuned 🤑🐱👤🤗🤩

XAU/USD "The Gold vs U.S Dollar" Metal Market Heist Plan🌟Hi! Hola! Ola! Bonjour! Hallo! Marhaba!🌟
Dear Money Makers & Robbers, 🤑💰🐱👤🐱🏍
Based on 🔥Thief Trading style technical and fundamental analysis🔥, here is our master plan to heist the XAU/USD "The Gold vs U.S Dollar" Metal market. Please adhere to the strategy I've outlined in the chart, which emphasizes long entry and short entry. 🏆💸Book Profits, Be wealthy and safe trade.💪🏆🎉
Entry 📈 :
"The loot's within reach! Wait for the breakout, then grab your share - whether you're a Bullish thief or a Bearish bandit!"
Buy entry above 2960.00
Sell Entry below 2925.00
However, I recommended to place buy stop for bullish side and sell stop for bearish side.
Stop Loss 🛑:
-Thief SL placed at 2920.00 for Bullish Trade
-Thief SL placed at 2955.00 for Bearish Trade
Using the 30min period, the recent / swing low or high level.
SL is based on your risk of the trade, lot size and how many multiple orders you have to take.
Target 🎯:
-Bullish Robbers TP 3030.00 (or) Escape Before the Target
-Bearish Robbers TP 2880.00 (or) Escape Before the Target
📰🗞️Fundamental, Macro Economics, COT data, Sentimental Outlook:
XAU/USD "The Gold vs U.S Dollar" Metal market is currently experiencing a Neutral trend (there is a higher chance for Bullishness)., driven by several key factors.
⭐Fundamental Analysis
The current price of XAU/USD is 2940.00, indicating a strong bullish trend. The gold market is driven by various fundamental factors, including:
Inflation concerns: Rising inflation expectations and a potential decline in the US dollar may boost gold prices.
Interest rate policies: The US Federal Reserve's interest rate decisions may impact gold prices.
Global economic uncertainty: Ongoing trade tensions, Brexit uncertainty, and geopolitical risks may drive safe-haven demand for gold.
⭐Macro Economics
The global economic outlook is uncertain, with:
Recession concerns: Weak economic data and trade tensions have raised concerns about a potential global recession.
Central bank rate hikes: The US Federal Reserve and other central banks may continue to raise interest rates, impacting currency markets.
Inflation expectations: Rising inflation expectations may boost gold prices.
⭐COT Data
Commercial Traders: Net short 143,000 contracts (a decrease of 11,000 contracts from the previous week)
Non-Commercial Traders: Net long 104,000 contracts (an increase of 8,000 contracts from the previous week)
Non-Reportable Positions: Net long 39,000 contracts (an increase of 3,000 contracts from the previous week)
Open Interest: 544,000 contracts (a decrease of 10,000 contracts from the previous week)
⭐Market Sentimental Analysis
Market sentiment for XAU/USD is:
Bullish: 62% of investors expect gold prices to rise, driven by inflation concerns and global economic uncertainty.
Bearish: 21% of investors expect gold prices to fall, driven by potential US dollar strength and interest rate hikes.
Neutral: 17% of investors remain neutral, awaiting further market developments.
⭐Intermarket Analysis
The XAU/USD pair is highly correlated with:
USD Index: A weaker US dollar may boost gold prices.
10-Year Treasury Yield: Lower yields may increase demand for gold.
S&P 500: A decline in the S&P 500 may drive safe-haven demand for gold.
⭐News and Events
Upcoming events that may impact the XAU/USD pair include:
US Federal Reserve Interest Rate Decision: March 15, 2025
US GDP Growth Rate: March 25, 2025
US Inflation Rate: March 29, 2025
⭐Seasonality
Gold prices tend to be:
Stronger during the winter months: Due to increased demand for jewelry and coins.
Weaker during the summer months: Due to decreased demand for jewelry and coins.
⭐Positioning Analysis
Traders are advised to:
Consider long-term investments: As gold prices are expected to rise due to inflation concerns and global economic uncertainty.
Monitor market volatility: As interest rate hikes and US dollar strength may impact gold prices.
Diversify portfolios: By investing in other assets, such as currencies, stocks, or bonds.
⭐Next Trend Move
The XAU/USD pair may experience a:
Bullish move: Driven by inflation concerns and the US Federal Reserve's potential interest rate hikes.
Bearish move: If the US dollar strengthens or global economic uncertainty increases.
⭐Overall Summary Outlook
The XAU/USD pair is expected to experience volatility due to:
Global economic uncertainty: Ongoing trade tensions, Brexit uncertainty, and geopolitical risks.
Inflation concerns: Rising inflation expectations and a potential decline in the US dollar.
Central bank rate hikes: The US Federal Reserve and other central banks may continue to raise interest rates.
⚠️Trading Alert : News Releases and Position Management 📰 🗞️ 🚫🚏
As a reminder, news releases can have a significant impact on market prices and volatility. To minimize potential losses and protect your running positions,
we recommend the following:
Avoid taking new trades during news releases
Use trailing stop-loss orders to protect your running positions and lock in profits
💖Supporting our robbery plan will enable us to effortlessly make and steal money 💰💵 Tell your friends, Colleagues and family to follow, like, and share. Boost the strength of our robbery team. Every day in this market make money with ease by using the Thief Trading Style.🏆💪🤝❤️🎉🚀
I'll see you soon with another heist plan, so stay tuned 🤑🐱👤🤗🤩

Gold Head & Shoulder Pattern, Possible shorting opportunities.Gold has recently formed a head and shoulders pattern on the chart, a classic bearish reversal signal that could indicate a potential decline in price. If the neckline is broken with strong volume, it may present a shorting opportunity for traders looking to capitalize on downside momentum.
Also showing bearish on 2 indicators ( RSI and MACD).
Also, in downward channels.
However, confirmation and risk management are essential before making any trading decisions.
Note :- This is not financial advice.

Gold Surges Past $3,000 Amid Trump, Economic FearsThe glint of gold has intensified, piercing the $3,000 per ounce threshold, a symbolic milestone that echoes through centuries of economic and political upheaval.1 This surge, fueled by a potent cocktail of market anxieties and, notably, the amplified rhetoric of a potential Trump return, underscores gold's enduring role as a safe-haven asset and a barometer of global uncertainty.2 The psychological significance of breaching this key level cannot be overstated, solidifying gold's position as a timeless store of value in an increasingly volatile world.
The current rally, while rooted in broader economic anxieties, has received a significant jolt from the political landscape. The prospect of a second Trump presidency has injected a fresh wave of uncertainty into markets. His often-unconventional policy pronouncements, coupled with the potential for trade disputes and geopolitical tensions, have created a climate ripe for gold's ascent. Investors, seeking to mitigate potential risks, are flocking to the precious metal, driving its price to unprecedented heights.3
Beyond the political sphere, persistent economic concerns are also playing a crucial role. Inflation, despite recent efforts to tame it, remains a lurking threat. Global debt levels continue to climb, and concerns about a potential recession linger. These factors, combined with the inherent instability of fiat currencies, have bolstered gold's appeal as a hedge against economic turbulence.4 Gold, unlike paper money, cannot be printed at will, offering a sense of stability in an uncertain financial landscape.5
Furthermore, geopolitical instability is a perennial driver of gold prices. Ongoing conflicts, simmering tensions between major powers, and the ever-present threat of terrorism contribute to a sense of unease that pushes investors towards safe-haven assets. The perception of gold as a reliable store of value during times of crisis has been reinforced throughout history, and the current global climate is no exception.
The $3,000 milestone also serves as a potent reminder of gold's role as a gauge of fear in the markets.6 When investors are anxious, they tend to seek out safe havens, and gold has consistently proven to be a popular choice. The current surge in gold prices reflects a growing sense of unease about the future, both economically and politically.7 This fear, whether justified or not, is a powerful force driving market behavior.
The technical aspects of the gold market are also contributing to the rally. The break above $3,000 has triggered a wave of buying, as traders and investors seek to capitalize on the momentum. This technical breakout could lead to further gains in the short term, as the market tests new highs. The sheer psychological importance of the $3,000 level also draws in investors who were previously hesitant to participate.
However, it is crucial to recognize that gold prices are not immune to volatility. While the long-term outlook for gold remains positive, short-term fluctuations are inevitable.8 Factors such as changes in interest rates, shifts in investor sentiment, and unexpected geopolitical events can all impact gold prices.9 Investors considering gold as part of their portfolio should be prepared for potential price swings.
The current rally also raises questions about the long-term sustainability of these high prices. While gold's fundamental drivers remain strong, it is important to consider the potential for a correction. Historically, periods of rapid price appreciation have often been followed by periods of consolidation or decline. However, the unique confluence of factors currently supporting gold prices suggests that the rally may have further room to run.
In conclusion, the breach of the $3,000 per ounce mark is a significant milestone for gold, reflecting a confluence of economic, political, and psychological factors. The potential return of Trump, coupled with persistent economic anxieties and geopolitical instability, has created a perfect storm for gold's ascent. This surge underscores gold's enduring role as a safe-haven asset and a gauge of fear in the markets.10 While the future remains uncertain, gold's historical performance suggests that it will continue to play a crucial role in investor portfolios, offering a sense of stability in an increasingly turbulent world. The breaking of such a psychological barrier will also inevitably drive more speculative investment, and thus, drive the market further, at least in the short term. Investors should continue to monitor the global landscape and adjust their strategies accordingly, while recognizing the inherent volatility of the precious metals market. The allure of gold, however, remains strong, a testament to its enduring appeal as a timeless store of value.

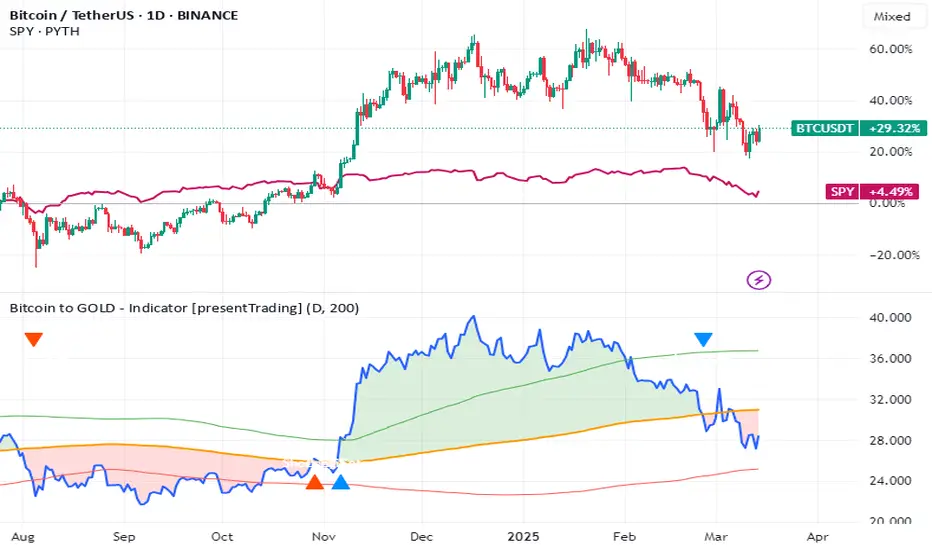
Bitcoin, S&P, Gold: Market Decline & DivergenceThe intricate dance of financial assets often reveals hidden correlations and predictive patterns. Recently, the synchronized decline of Bitcoin and the S&P 500 has raised concerns, while gold's historic rally has left Bitcoin trailing. However, a deeper dive into the data suggests a potential turnaround, hinting at a shift in market dynamics.
For much of the past few years, Bitcoin has exhibited a strong correlation with the S&P 500, behaving as a risk-on asset.1 When the stock market surged, Bitcoin often followed suit, and conversely, market downturns typically coincided with Bitcoin's price depreciation. This correlation stems from shared macroeconomic drivers, such as interest rate expectations, inflation concerns, and overall investor sentiment. The recent parallel decline reflects anxieties surrounding persistent inflation, potential interest rate hikes, and geopolitical uncertainties.
However, this synchronized movement doesn't tell the whole story. While Bitcoin and the S&P 500 have been grappling with downward pressure, gold has embarked on a remarkable rally, reaching unprecedented heights. This surge is fueled by several factors, including substantial inflows into gold ETFs, escalating geopolitical tensions, and heightened market volatility. Gold's traditional role as a safe-haven asset has been reaffirmed, as investors seek refuge from the turbulence in equity and cryptocurrency markets.
The divergence between Bitcoin and gold is particularly striking. The Bitcoin-to-gold ratio, a metric that reflects the relative value of Bitcoin compared to gold, has broken a 12-year support level. This breach signals a significant shift in investor preference, with gold emerging as the dominant asset. The recent climb of gold to a hypothetical $3,000 mark (or equivalent in other currencies) further underscores this trend, demonstrating its resilience in the face of economic uncertainty.
The observed pattern of Bitcoin breaking its multiyear uptrend against gold bears a striking resemblance to the market behavior witnessed between March 2021 and March 2022. During that period, Bitcoin experienced a similar decline relative to gold, ultimately leading to a substantial drop in its dollar value. This fractal pattern suggests that Bitcoin may be poised for further depreciation, potentially falling below the $65,000 mark.
However, it's crucial to acknowledge that historical patterns are not infallible predictors of future performance. Market dynamics are constantly evolving, and unforeseen events can significantly alter the trajectory of asset prices. While the current data points towards a potential decline for Bitcoin, there are countervailing factors that could trigger a reversal.
One such factor is the increasing institutional adoption of Bitcoin. As more institutional investors allocate a portion of their portfolios to cryptocurrencies, the market may become less susceptible to short-term fluctuations driven by retail sentiment. Moreover, the long-term potential of Bitcoin as a decentralized store of value remains a compelling narrative for many investors.
Additionally, the regulatory landscape surrounding cryptocurrencies is gradually becoming clearer. As governments and regulatory bodies establish frameworks for the operation of digital asset markets, investor confidence may improve, leading to renewed interest in Bitcoin. The upcoming Bitcoin halving is also anticipated to reduce the supply of new Bitcoin entering the market, which could potentially drive up its price.
While the current correlation between Bitcoin and the S&P 500 may persist in the short term, the underlying fundamentals of Bitcoin suggest a potential decoupling in the long run. As the cryptocurrency market matures and gains wider acceptance, its correlation with traditional asset classes may weaken.
The recent divergence between Bitcoin and gold highlights the importance of diversifying investment portfolios. While gold has proven its resilience in times of uncertainty, Bitcoin offers the potential for substantial returns in the long term. Investors should carefully consider their risk tolerance and investment objectives when allocating capital to these assets.
The breakdown of the Bitcoin to gold ratio is a concerning indicator, however, the cryptocurrency world moves quickly. The market is driven by new innovation, and adoption. The market has been known to have large pullbacks, followed by even larger rallies. The current market may be pricing in a large amount of fear, and a simple change in the news cycle could cause a large change in the price of bitcoin.
In conclusion, the current market dynamics present a complex picture. The synchronized decline of Bitcoin and the S&P 500, coupled with gold's historic rally, suggests a potential downturn for Bitcoin. However, the long-term potential of Bitcoin, coupled with increasing institutional adoption and a maturing regulatory landscape, could trigger a reversal. Investors should remain vigilant, monitor market trends, and make informed decisions based on a comprehensive understanding of the underlying fundamentals. The data suggests a potential turn around, but only time will tell if the market will comply.
Gold is on a relentless hunt for the $2,720 levelGold is on a relentless hunt for the $2,720 level, navigating through a well-defined ascending channel where the upper boundary has acted as long-term resistance and the lower boundary as dynamic support. The price has respected this structure, with multiple touches reinforcing its integrity. However, a recent double top near the upper boundary signals potential bullish exhaustion, increasing the probability of a downside move. If the price remains below this key level, further declines are likely, with $2,720 emerging as a crucial support zone—aligned with the golden pocket on the Fibonacci retracement, making it a prime area for a reaction.
The Alternative Scenario: The New Economy's Bullish Case
Despite the bearish structure, gold in the new economy presents an alternative bullish outlook. A smaller bullish channel has formed between $2,789 and $2,855, suggesting that buyers are still in control within this range. If this mini uptrend holds, it could fuel another breakout attempt above recent highs, invalidating the bearish scenario and positioning gold for a renewed push toward higher levels.
For now, gold is at a crossroads, with $2,720 as the primary target on the downside—but if buyers defend this level or sustain the new bullish channel, the uptrend may persist in the evolving economic landscape.

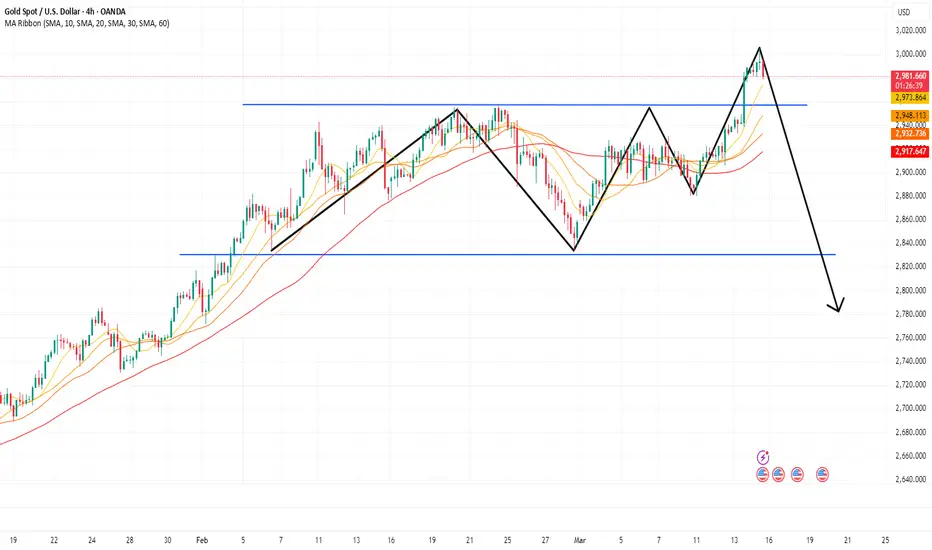
Gold (XAUUSD) 15-Minute Chart Analysis – Bullish Trade SetupGold (XAUUSD) 15-Minute Chart Analysis
Key Observations:
Price Action:
The price is currently at $2,981.96.
The price has been in an uptrend, forming higher highs and higher lows.
Moving Averages:
EMA 30 (red line): At $2,965.00, acting as a dynamic support level.
EMA 200 (blue line): At $2,935.17, indicating a long-term bullish trend.
Trade Setup:
Entry Level: Around $2,981.96.
Stop Loss: Placed at $2,966.81.
Take Profit Targets:
TP1: $2,985.86
TP2: $2,992.23
TP3: $2,998.08
Final Target: $3,005.50
Risk-Reward Ratio:
The risk is defined by the distance between the entry price and the stop loss.
The reward is defined by the distance between the entry price and each take-profit level.
Given the setup, the trader is aiming for a favorable risk-to-reward ratio.
Trading Perspective:
Bullish Bias: The trend is strongly bullish, supported by the EMA 30 and EMA 200.
Confirmation Needed:
If the price sustains above $2,985, it increases the probability of hitting higher targets.
A break below $2,970 could invalidate the trade setup.
Would you like a deeper analysis with Fibonacci levels or volume data?

Unlock self-rescue guide hereNotice! The gold market has suddenly changed! Gold, which had been rising all the way, has now shown a peak signal, and a decline has become inevitable.
The current big Yinxian is falling straight, and the market is completely shrouded in a bearish atmosphere. From a technical perspective, the evening star pattern is significant, which is often a strong signal of trend reversal. At the same time, the gold price deviates seriously from the moving average. This deviation is difficult to maintain in the market for a long time, and returning to rationality is an observable rule.
Looking at the four-hour line again, the big Yinxian entity strongly engulfs the Yangxian, directly breaking through the support line, forming an extremely strong bearish engulfing pattern, which means that the space below has been opened, and a plunge may be just around the corner. Are you ready to meet this storm in the gold market? Opportunities always coexist with risks, and now is the time to test investors' decisiveness.
You can read bottom signals, interpret daily market trends, share real-time strategies, and no longer blindly follow the trend.
GOLD ROUTE MAP UPDATEHey Everyone,
What a PIPTASTIC finish to the week with our chart idea now complete with our final target at 3005 now done.
We started the week with our 2918 Bullish target hit, followed with cross and lock in each stage of the range, completing 2947 and 2978 and now today confirmed a further lock opening 3005, which was hit and completed perfectly!!
The power of our algo levels, even at a new range is being respected to perfection!!
BULLISH TARGET
2918 - DONE
EMA5 CROSS AND LOCK ABOVE 2918 WILL OPEN THE FOLLOWING BULLISH TARGET
2947 - DONE
EMA5 CROSS AND LOCK ABOVE 2947 WILL OPEN THE FOLLOWING BULLISH TARGET
2978 - DONE
BEARISH TARGETS
2889 - DONE
We will now come back Sunday with our updated Multi time-frame analysis, Gold route map and trading plans for the week ahead and also a new Daily chart long term chart idea, now that this one is complete.
Have a smashing weekend!! And once again, thank you all for your likes, comments and follows, we really appreciate it!
Mr Gold
GoldViewFX

Gold weekly chart with both buy and sell levels See latest update on Gold for the coming week.
For a buy am looking at entering at 2914 expecting 2920 as first resistance.
For a sell ill look at entering at 2904 and expecting a move to 2889 as firat resistance.
Short idea this week as have other commitments but ill update when i get a chance in the coming week.

Golden milestone moment, about to fall!Gold hit a new all-time high on Friday, reaching the psychologically critical $3,000 mark, with the precious metal up nearly 15% since the start of the year, fueled by trade war fears and expectations of a rate cut by the Federal Reserve. Trump's tariffs have been a key driver of safe-haven buying in gold. The global trade war has roiled financial markets, sparking recession fears, and Trump threatened on Thursday to impose a 200% tariff on imported alcohol from Europe, a trade war that is escalating. But in the short term, there is absolutely no reason to chase gold higher. Reaching $3,000 today is clearly a long position in the market to pull up shipments. What happens when the longs are exhausted? That could usher in a wave of retracements, so don't chase the highs now. Gold is about to plunge.
You can read bottom signals, interpret daily market trends, share real-time strategies, and no longer blindly follow the trend.

Gold 4 hour swing trade buy 2880Back this week with another swing trade.
Looking to buy at 2880 , this was previous support structure.
My conformations for this is based on wekly, daily and 4 hour trend lines plus the fibanocci level of 0,382 is right on my entry point.
I do these trades up based on technical analasis and my advice as always is go small be prepared for some drawdown and use proper risk management.
These trades are not meant to be finincial advice but mearly my own take on market structure.
Trade safe thei coming week.

Gold is about to fall, maybe even plummet!In the morning, gold rose above 2990 as expected and then fell back, but it stopped falling again at 2980 in the European session and rose again. The current market is rising again to test above 3000. From the current hourly chart, the pressure of 3005 is obvious. Today is the last trading day of this week. It is still optimistic about the decline in the evening, and even more optimistic about the plunge!!!
You can read bottom signals, interpret daily market trends, share real-time strategies, and no longer blindly follow the trend.

3.14 Gold breaks through historical high to 3000Yesterday, the gold market continued the risk-averse rally and broke through the historical high. After opening at 2933.4 in the morning, the market first rose to 2947.4 and then fell back. The daily line reached a low of 2932.4 and then rose strongly. After breaking through the previous historical high of 2957 during the US trading session, the market accelerated upward. The daily line reached a high of 2989.3 and then the market consolidated. The daily line finally closed at 2988.8 and the market closed with a basically saturated big positive line. After this pattern ended, the weekly line completed the N-shaped break. Today's market reached the 3000 mark and quickly pulled back to 2988 and then came to 2997.
Short-term recommended operations:
Resistance level: 3000 3010 3020
Support level: 2995 2985 2970

3.14 Risk aversion and interest rate cuts have pushed gold to thGold is supported by risk aversion and interest rate cut expectations, and the overall trend remains upward. Short-term technical aspects also show that the advantages of the bulls have been strengthened.
On the daily chart, gold has set a new record high and performed very strongly. For the support below gold, radicals pay attention to the upper rail position of the daily and weekly Bollinger bands at $2,983, which is also the low point of the gold price falling back in the morning. Secondly, the low point of the fall after the intraday high in the US market on Thursday was $2,976. The continued fall suggests that the gold price has the risk of adjustment. Pay attention to the previous historical high of $2,956; for the pressure above gold, pay attention to the breakthrough of the integer position of $3,000. If it breaks through and stands firm here, it will not guess the top. The 5-day moving average is golden cross upward, the KDJ and RSI indicators are golden cross upward, and the MACD indicator forms a dead cross, indicating that the advantages of the bulls in the short-term technical aspect are further strengthened.
Resistance points: 2,990, 3,000, 3,010
Support points: 80, 70, 56

Gold Price Analysis March 14⭐️Fundamental analysis
Optimistic comments from the White House and Canada, along with news that enough Democrats have voted to avoid a US government shutdown, have boosted investor sentiment. However, gold's gains were capped by a stronger US dollar, which was bought for the third consecutive session.
However, expectations that the Fed will cut interest rates multiple times this year could limit the strong recovery of the US dollar. In addition, concerns about former President Trump's tough trade policies and their impact on the global economy continue to support gold prices. This suggests that any correction in gold could be a buying opportunity, helping the precious metal maintain its upward trend for the second consecutive week.
⭐️Technical analysis
any pullback today is considered a reasonable buy 2970 is the area where the European session Gold can find deeper and 2953 are the two BUY zones today. The sell zone is still noticeable around the 3000 round resistance and the 3015 border is considered resistance today. When gold has ATH, the FOMO is very high, so this is a difficult time to trade. Pay attention to volume and good capital management.
