Gold Sniper Zones - XAUUSD May 12 Monday🔍 Key Intraday Demand Zones (Potential Bounce Areas)
🔵 3220–3200
Current area of interest with short-term absorption signs
May serve as temporary reaccumulation base if bulls defend this area
Ideal zone for intraday reaction → confirmation required before acting
🔵 3180-3165
Strong historical reaction level
Previously held structure before rally
If price breaks below 3209, this is likely where buyers will re-enter aggressively
🔺 First Major Intraday Resistance Zones
🔴 3240–3255
First clean lower high zone
Recent bearish pressure originated here
Any bounce toward this area may face sharp rejection
🔴 3275 - 3290
Former structure base, now flipped
Watch for potential NY spike into this region → rejection likely without a confirmed breakout
🧠 Final Words:
Gold isn’t in freefall. It’s moving between precision zones that traders either recognize — or get wrecked by.
At this stage:
Below 3209 = bearish pressure likely continues toward 3170s
Above 3255 = watch for liquidity sweeps and false confidence
🎯 Stay with structure. Ignore the noise. Let the market earn your entries.
Drop a 🚀 Follow, comment, and share with your trading crew — if this helps your trading; let’s build a sharp Gold team
📌 Important Notice!!!
The above analysis is for educational purposes only and does not constitute financial advice. Always compare with your plan and wait for confirmation before taking action.
Goldprice
XAUUSD H4 Outlook – Monday, May 12, 2025Short-Term Bias: Bullish retracement toward premium zones
Structure: CHoCH confirmed at 3284 → forming potential bullish leg inside retracement
🔍 Recent Price Action (H4 Insight):
Clear CHoCH on H4 above 3292 → short-term structure flipped bullish.
Last impulsive leg pushed price into the 3330–3345 zone before rejecting slightly — signs of near-term resistance.
EMA5 and EMA21 are crossing upward, with price trying to retest EMA21 for a bounce.
Next H4 candle closure is critical — either holds 3290 for continuation or re-tests deeper zone.
📌 Key H4 Zones
Zone / Level Description
3380–3395 🔺 H4 FVG + OB zone – major near-term premium resistance (also Daily level)
3340–3345 🔁 H4 internal resistance – Friday top, low-volume gap area
3314–3318 🔁 Micro H4 imbalance – intraday fill zone
3284–3292 ✅ H4 CHoCH + OB – current bullish base, critical to hold
3250–3265 🔵 Deep demand – final intraday bounce zone before HTF demand
These levels will be your H4 battle zones — where price is likely to bounce, reverse, or accelerate depending on confirmation.
🔁 Potential Flow on Monday:
Bullish scenario:
If price holds 3284–3292 → intraday targets = 3318 → 3340 → 3380.
Clean structure = higher low + EMA support confluence.
Bearish scenario:
If price loses 3284 → could test 3250–3265. Only below this would invalidate current H4 bullish flow.
⚠️ Confluence Check:
EMAs: EMA5 crossing up through EMA21 → short-term bullish momentum building
Liquidity: Buy-side above 3345 → price may attempt sweep if supported
FVGs: Still unfilled gaps between 3314 and 3380 → magnet zones for bullish flow
CHoCH: Valid on 3284 → first HL attempt happening now
🧠 H4 Summary (for May 12):
Type Zone Reaction Potential
Resistance 3380–3395 Strong rejection possible
3340–3345 May slow price if volume weak
Support 3284–3292 Critical bullish structure zone
3250–3265 Breaker block zone (last bounce before HTF demand)
💬 Final Word to the Community:
Gold may have paused its moon mission at 3500, but the engines are refueling. Monday’s battle will be all about 3284 — hold it, and bulls might just take flight toward 3380. Lose it, and we buckle in for a deeper dip.
🟡 Whether you’re team buy-the-dip or wait-for-the-fade… stay sharp, stay patient, and always follow structure.
Like what you see? Drop a comment, tag a gold friend, and follow GoldFxMinds to never miss the real flow. 🧠⚡

How to layout gold as Sino-US trade eases🗞News side:
1. China-US trade relations eased, suspending some tariffs and countermeasures
2. Russia and Ukraine suspended firing for 30 days, and the India-Pakistan conflict was temporarily mediated
📈Technical aspects:
Affected by the easing of Sino-US economic and trade relations, coupled with the fact that the Russian-Ukrainian negotiations are on the right track and India and Pakistan have suspended firing, the risk aversion sentiment in the gold market has eased, and the gold price has fallen sharply since the opening today. At present, the 3200 line has formed an important short-term support. If the support effect is strong at this point, the gold price may rebound further; if it falls below this key support, it will accelerate the opening of downward space. The upper 3250-3260 is the previous intensive trading area, which will pose a certain pressure in the short term. At the top of the European market, focus on the resistance range of 3250-3260, and at the bottom, the support range is 3210-3200.
🎁BUY 3200-3210
🎁TP 3250-3260
🎁 SELL 3260-3270
🎁 TP 3250-3230
If you agree with this view, or have a better idea, please leave a message in the comment area. I look forward to hearing different voices.
FOREXCOM:XAUUSD FXOPEN:XAUUSD TVC:GOLD FX:XAUUSD OANDA:XAUUSD

Gold is losing its shine as the US and China move closerGold price (XAU/USD) has dropped below $3,300 and is now trading around $3,275 in the Asian session on Monday, pressured by a stronger US Dollar and optimism from US-China trade talks. Both sides reported “substantial progress” after two days of negotiations in Switzerland, reducing safe-haven demand for gold. However, ongoing trade uncertainties and geopolitical tensions may still provide some support. While military activity between India and Pakistan has eased following a ceasefire, the risk of conflict remains.
🔮 Expected Short-Term Scenario:
This week, gold (XAU/USD) may continue to face downward pressure due to positive expectations surrounding the US-China trade process, which reduces demand for safe-haven assets. If the US releases more favorable trade details, risk sentiment could improve, causing capital to flow out of gold. A stronger US Dollar also adds pressure to the metal.
🧭 Suggested Trading Strategy:
• If the price rebounds to the $3,275–$3,300 zone but fails to break through, consider shorting with targets at $3,240 or $3,200.
• Conversely, if the price breaks above $3,300, wait for confirmation to open a long position.
💡 Short-Term Trade Scenarios:
SELL XAU/USD Zone: $3,275 – $3,295
• TP1: $3,240
• TP2: $3,200
🚨 SL: $3,310
BUY XAU/USD Zone: $3,305 – $3,315
• TP1: $3,325
• TP2: $3,350
🚨 SL: $3,290

Shorts were active at the beginning of this week, and prices fel
📌 Gold driving factors
The joint statement of the Sino-US Geneva economic and trade talks has just been released. This development has hit the safe-haven demand for gold and has become the fuse for a new round of gold selling.
Coupled with the hawkish "holding back" of the Federal Reserve, the dollar has remained stable near its multi-week high and put pressure on gold. The trend of gold prices seems quite fragile.
📊Commentary analysis
The next resistance for gold prices is the static barrier of $3360-3365/ounce. If it can be decisively overcome, it will eliminate the recent bearish tendency and lay the foundation for gold prices to regain the $3400/ounce mark.
💰Strategy Package
⭐️Set Gold Price:
🔥Sell Gold Zone: 3315-3317 SL 3322
TP1: $3300
TP2: $3290
TP3: $3280
🔥Buy Gold Zone: $3223 - $3225 SL $3218
TP1: $3238
TP2: $3245
TP3: $3260
⭐️ Note: Labaron hopes that traders can properly manage their funds
- Choose the number of lots that matches your funds
- Profit is 4-7% of the fund account
- Stop loss is 1-3% of the fund account

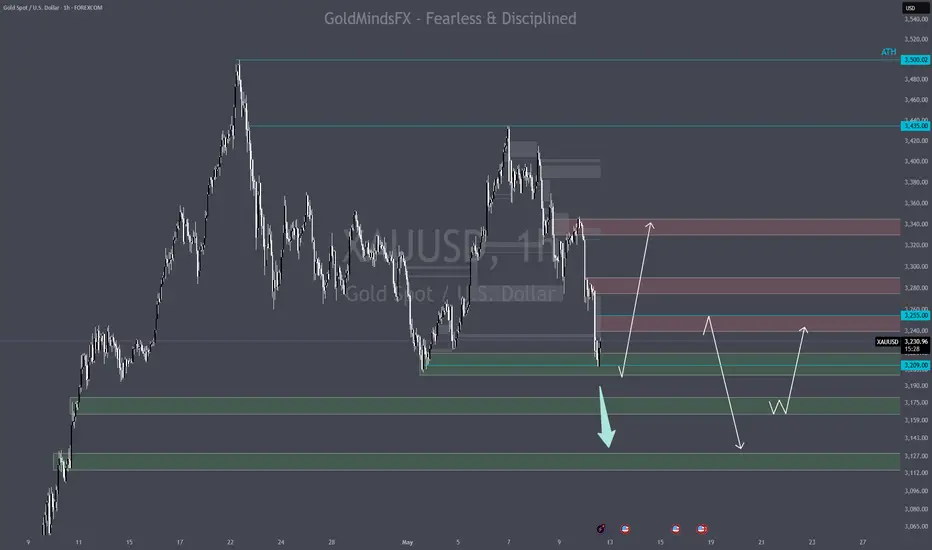
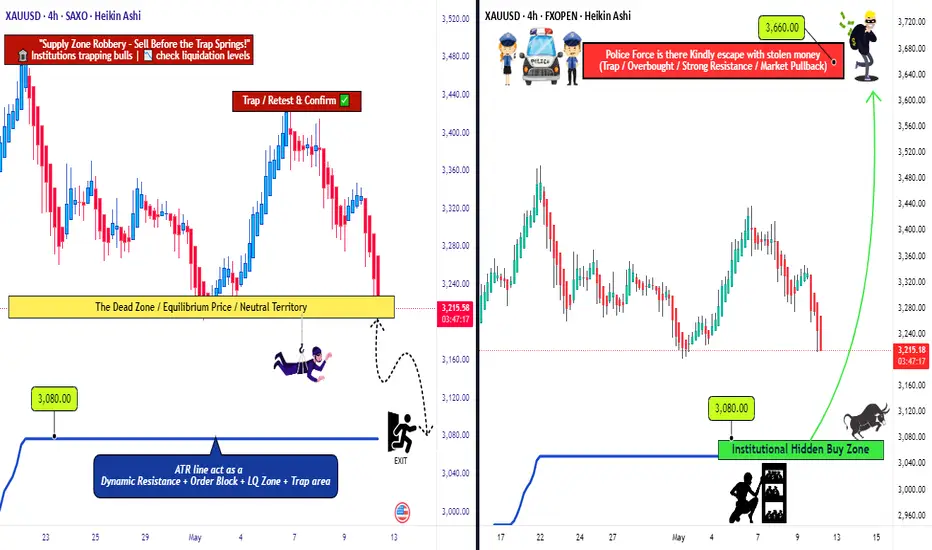
Golden Opportunity: XAU/USD’s Bull & Bear Heist Strategy!Hello Money Makers & Market Bandits! 🤑💰✈️
Get ready to raid the XAU/USD Gold Market with our cunning Thief Trading Style, blending sharp technicals and deep fundamental insights! 📊🔥 Our plan? Strike with precision on both bullish and bearish moves, grabbing profits before the market turns. Let’s outwit the charts and stack that gold! 🏆💸
📈 The Gold Heist Plan
Entry Points 🚪:
🏴☠️ Bullish Move: Wait for a pullback to the Institutional Hidden Buy Zone at 3080—your signal to jump in for bullish gains!
🏴☠️ Bearish Move: Watch for a breakout below the neutral level at 3200—time to ride the bearish wave!
Tip: Set alerts to catch these key levels! 🔔
Stop Loss (SL) 🛑:
Bullish Trade: Place SL at 2960 (4H swing low, Institutional Hidden Buy Zone).
Bearish Trade: Set SL at 3360 (4H swing high).
Adjust SL based on your risk, lot size, and number of orders. Stay sharp—this is your shield! ⚠️
Take Profit (TP) 🎯:
Bullish Robbers: Aim for 3660 or exit early if momentum fades.
Bearish Robbers: Target 3080 or slip out before the market flips.
Escape Plan: Watch for overbought/oversold signals to avoid traps! 🚨
📡 Why XAU/USD?
The Gold Market is in a bearish trend 🐻, driven by:
Fundamentals: USD strength from Fed policy, US growth, and tariffs.
Macroeconomics: US resilience vs. global economic weakness.
COT Data: Bearish speculative bets favor USD.
Intermarket: Rising US yields and equities boost USD, pressuring gold.
Quantitative: RSI and Fibonacci confirm bearish momentum.
🧠 Sentiment Outlook (May 12, 2025)
Retail Traders:
🟢 Bullish: 42% 😊 (Hoping for gold rebound on trade war fears)
🔴 Bearish: 45% 😟 (USD strength and improved US-China relations weigh)
⚪ Neutral: 13% 🤔
Source: Social sentiment & trading platform polls
Institutional Traders:
🟢 Bullish: 30% 💼 (Safe-haven demand amid geopolitical uncertainty)
🔴 Bearish: 60% ⚠️ (USD rally and higher concrete 5/12/2025)
🟢 Bullish: 30% 💼 (Safe-haven demand amid geopolitical uncertainty)
🔴 Bearish: 60% ⚠️ (USD rally and higher yields suppress gold)
⚪ Neutral: 10% 🧐
Source: COT reports & institutional flows
⚠️ Trading Alert: News & Risk Management 📰
News can shake the market like a storm! Protect your loot:
Skip new trades during major news releases.
Use trailing stop-loss to lock in profits and limit losses.
Stay vigilant—volatility is our playground, but only with a plan!
💪 Ride with the Thief Trading Team!
Hit the Boost Button to power up our Thief Trading Style and make this heist epic! 🚀 Each boost fuels our squad, helping us plunder profits daily. Let’s conquer the XAU/USD market together! 🤝
Stay tuned for the next heist! 🐱👤 Keep your charts ready, alerts on, and trading vibe high. Catch you in the profits, bandits! 🤑🎉
#ThiefTrading #XAUUSD #GoldHeist #TradingView #StackTheGold
XAU/USD) Bullish trand line analysis Read The ChaptianSMC Trading point update
Technical analysis of Gold Spot (XAUUSD) on the 4-hour timeframe, featuring key support and resistance levels, price action projections, and RSI for momentum evaluation. Here's a breakdown of the idea:
Key Points in the Analysis:
1. Support & Resistance Zones:
Big Support / Buying Zone: Around 3,222 – 3,240. This zone has seen previous bullish reversals and is supported by the 200 EMA.
Intermediate Support Level: Around 3,270–3,290, where price might bounce before attempting a breakout.
Key Resistance Level: Around 3,350–3,365. Price must break this area to move toward higher targets.
2. Price Action Projections:
The analysis shows two bullish potential scenarios:
Scenario 1: Price breaks above the resistance level directly and moves toward the target point at 3,535.83.
Scenario 2: A retracement to the lower support or even the big buying zone before a bullish rally to the same target.
3. RSI (Relative Strength Index):
Currently near the neutral zone (around 49), suggesting there's room for movement in either direction.
No extreme overbought/oversold signals right now.
4. EMA (200):
The price is currently hovering above the 200 EMA (3,222.01), which acts as a long-term support and trend indicator.
Mr SMC Trading point
Summary of the Trading Idea:
Bias: Bullish
Entry Zones: Look for long entries at either the support level (3,270–3,290) or lower buying zone (around 3,222).
Target: 3,435.05 initially, then 3,535.83.
Invalidation: A clear breakdown below the 3,222 support level could invalidate the bullish bias.
Pelas support boost 🚀 analysis follow)

An Unharmonious Outlook for the New WeekGold Bullish? Sure, go ahead, but let me explain where we are and so on... 🤔
1. Newswise 📰
Tariffwar:
Trade tensions between the U.S. and China have intensified following President Trump's tariff hikes. The U.S. increased tariffs on Chinese imports to 145%, while China retaliated with tariffs up to 125% on U.S. goods. Despite these escalations, both countries have engaged in high-level negotiations in Geneva, aiming to de-escalate the situation. However, a recent abrupt withdrawal by the Chinese delegation has cast doubt on the progress of these talks. Analysts caution that even if an agreement is reached, it may offer only temporary relief, leaving markets exposed to prolonged trade tensions.
Federal Reserve does not cut interest rates:
President Donald Trump has been vocal in his criticism of the Federal Reserve’s decision to keep interest rates unchanged, calling Fed Chair Jerome Powell a “fool” for not lowering them. 😡 Trump argues that with falling energy prices, stable employment, and low inflation, the Fed should cut rates to stimulate economic growth. 📉
The Federal Reserve, however, remains cautious. 🏦 Officials have expressed concerns that recent tariffs could increase inflation, making premature rate cuts risky. They emphasize the need for clearer economic data before making further policy adjustments. 🧐
In summary: While Trump pushes for immediate cuts to boost the economy, the Fed is taking a measured approach, prioritizing long-term stability over short-term political pressure. ⚖️
War in Ukraine remains tense:
Western leaders, alongside President Zelensky, are calling for a 30-day ceasefire starting May 12. Russia has shown a willingness to negotiate but demands an end to Western military aid — a condition firmly rejected. 🚨
Conclusion: The coming days will be critical. A ceasefire could open the door to new peace efforts. If rejected, expect tougher sanctions and further escalation. 💥
India–Pakistan Conflict:
Tensions between India and Pakistan have escalated sharply following a militant attack on Indian tourists in Kashmir on April 22, 2025. India responded with airstrikes, prompting mutual accusations of missile and drone attacks. 💣 Despite a U.S.-brokered ceasefire announced on May 10, violations followed within hours. Both countries, nuclear-armed, have mobilized troops along the Line of Control. ⚔️ Global powers — including the U.S., U.K., China, and G7 — have urged restraint and offered to mediate. 🌍
2. Technicalwise 📊
1h Timeframe – Bearish Anti-Gartley Pattern
15m Timeframe – Bearish Anti-Butterfly Pattern
That’s not a sign of gold being bullish in the short term. 🚫
Let’s take a look at RSI values across timeframes:
- 5m – 31 – Down ⬇️
- 15m – 37 – Down ⬇️
- 30m – 43 – Down ⬇️
- 1h – 45 – Down ⬇️
- 4h – 46 – Down ⬇️
- 1d – 55 – Up ⬆️
Interpretation of RSI Values 🧐
5m to 4h (31 to 46 – all “Down”)
→ These low RSI values (below 50) across short- to mid-term timeframes indicate ongoing selling pressure and downward momentum. Although not yet in oversold territory (<30), this still signals relative weakness. ⚠️
1d (55 – “Up”)
→ On the daily chart, the RSI is above 50 and rising, suggesting a possible trend reversal or early signs of recovery — a bullish signal over the longer term. 📈
Overall Meaning 🧠
This points to short-term weakness within a broader potential uptrend. The market is soft on lower timeframes — likely in correction or consolidation — while the daily chart begins to show strength. It's a classic pullback setup in an uptrend. 🔄
Possible Strategy Consideration 💡
If you're leaning bullish, look for reversal signals on the smaller timeframes to align entries with the daily trend — such as RSI divergences or breakouts above local resistance. 📊
My Bias 🤔
Bearish sentiment dominates in the short term. Over the next week, I aim to enter short positions targeting $3,200. 📉
If sentiment shifts or key news emerges, a target of $3,400 becomes more realistic. 🚀
-------------------------------------------------------------------------
This is just my personal market idea and not financial advice! 📢 Trading gold and other financial instruments carries risks – only invest what you can afford to lose. Always do your own analysis, use solid risk management, and trade responsibly.
Good luck and safe trading! 🚀📊

1-hour timeframe. Here's a breakdown of what it shows:🔍 Chart Overview
Instrument: Gold Spot against U.S. Dollar (XAU/USD)
Timeframe: 1-Hour (1h)
Current Price: Around $3,337.62
Date & Time: May 9, 2025
📊 Key Elements in the Chart
Support and Resistance Zones:
Support Zone (Green box around 3,320–3,330): Price has bounced from this area multiple times.
Resistance Zone (Green box around 3,390–3,405): Price previously stalled and reversed here.
Horizontal Blue Lines: Mark major levels (possibly historical support/resistance).
Bottom line: ~$3,304 – strong support area.
Middle line: ~$3,360 – potential breakout level.
Top line: ~$3,390 – resistance target.
Candlestick Patterns:
Bullish pressure appears to be building after a pullback into the support zone.
Forecast/Prediction Path (Blue Arrow):
Indicates expectation of a bullish move.
Forecast suggests a small pullback, then a breakout above the ~$3,360 zone, and continuation toward ~$3,405.
Risk/Reward Box:
Green Box = Target Profit Area
Red Box = Risk Area (Stop-loss region below ~$3,320, above strong support near $3,304)
📈 Analysis Summary
Bias: Bullish (indicated by the blue projection arrow and structure)
Setup:
Price has bounced from the support zone.
Potential long entry above ~$3,337 with a target near ~$3,405.
Stop-loss just below ~$3,320 to manage risk.
Confluence:
Support zone aligns with previous breakout zone.
Consolidation and recent rejection of lower levels support potential for upside continuation.

Is GOLD still rising star? XAUUSD AnalysisHello everyone!
i Want share my idea about gold price action.
End of April we had some correction but beginning of May it still has buyer and why? at global market we see still misunderstanding, America and China still talk about rates, final talk will be soon between that to giant country, Russia-Ukraine war plus we have very hard situation between India and Pakistan, everyone was expecting peace, after trump inauguration, but how we see we are still far, no one knows what will be next and for big investors gold is safest place to invest money. If we look at gold for long term we can see it has pretty strong bull run.
For me i have other view - China and America will deal about rates, which will give market better view, i think before it will happen, Gold will test new High, where it will find sellers and from there we will have 2 quarter Bearish trend. New high will be between 3500 - 3550, also if we look at Dollar index (DXY) at 1D chart it found buyers and slowly showing reversal, but don't forget 1W chart because there we had 1W consolidation from 2023 and the last fall was stronger than other falls, at technical it tested weekly Fair Value Gap, but i cant see any reason yet for fall.
I think Gold will show us new high which will be between 3500 - 3550 and then we will get bearish trend and we will see correlation with dollar and dollar will start bullish trend.
With technical i will use simple technic, gold tested today daily fair value gap and it got strong reaction, we have resistance + 2h FVG but for me it will be not hard for gold to brake it.
This analysis is from my experience, i am not financial advisor.
FOR COLLABORATION TEXT ME !
ALWAYS MAKE YOUR OWN RESEARCH !

Decisively start the short-selling layoutThe results of the China-US talks were significant and exceeded market expectations. China and the US issued a joint statement, the core of which was to end the tariff war and reduce the tariffs of both sides to 34%, of which 24% will be temporarily exempted within 90 days.
At present, there is still a demand for a rebound. For the US market, we should first look at the area around 3245-55. If the rebound is in place, continue to play short orders to look at the target position of 3200. If it breaks upward, find a new point layout. This week's data and news will have a further impact on gold.
Operation suggestion: Short gold when it rebounds to around 3245-3255, pay attention to 3220 and 3200

Gold plunged. Will it rebound?Market Summary:
Gold prices suddenly saw a new round of selling in Asian markets on Monday, and the price of gold just fell to $3,210/ounce, reaching today's low, a drop of nearly $110.
Gold prices weakened at the beginning of the new week as the latest optimism about the US-China trade agreement continued to weaken demand for traditional safe-haven assets.
At the same time, positive signals from the US-China negotiations eased market concerns about a US recession. This, coupled with the Fed's hawkish comments, helped the dollar stabilize near multi-week highs and put pressure on gold. The gold price trend seems quite fragile. Gold prices fell and broke below the main bullish trend line in the short term, which sent a bearish signal, indicating that the trend may change.
I think the US-China trade agreement will have an impact on gold prices for a period of time.
Technical Analysis:
Gold's 4-hour level oscillation downward trend is relatively obvious, and the shape is a step downward. After the gold gapped down, there was a large gap. The gold rebound was unable to continue to fall. It is not easy to cover it in the short term. It will be covered in the process of the market. On the whole, for the short-term operation of gold today, Quide suggested that the rebound should be shorted as the main strategy, and the retracement should be long as the auxiliary strategy. The short-term trading should focus on the upward resistance of 3240-3250 US dollars, and the downward resistance should focus on the support position of 3200-3190 US dollars.
Today's operation strategy:
Operation strategy 1: Short the price when it rebounds to around 3245 US dollars, stop loss at 3260 US dollars, and take profit near 3210.
Operation strategy 2: Long the price when it falls back to 3210 US dollars, stop loss at 3200 US dollars, and take profit near 3240.

GOLD (XAUUSD) – SELL SIGNAL READ DESCRIPTIONGOLD (XAU/USD) – SELL SIGNAL
Entry Zone: 3232 – 3236
Take Profits:
TP1: 3219
TP2: 3207
TP3: 3194
Stop Loss: 3246
DISCLAIMER:
This is NOT financial advice
Trade at your own risk. Always manage your risk properly.

The tariff storm has subsided and gold has plummeted!
The tariff storm has come to an end, and gold has plummeted. At 3 o'clock today, gold plummeted by more than 40 US dollars in 10 minutes in the short term, because the tariff storm has ended, and China and the United States will only impose a 10% base tariff. So the so-called tariff storm of more than 100 points by all parties has ended. At present, it is no longer good for gold in terms of the trade war, and the short-term plunge has been encountered long ago!
At the same time, this point, coupled with the hawkish "holding troops" of the Federal Reserve, helped the US dollar to stabilize near the highs of several weeks and put pressure on gold. It also became the fuse for a new round of gold price selling. In addition, the current situation in the Middle East countries has temporarily begun to mediate, and the difficulty of maintaining risk aversion makes it difficult for buyers to enter the market again!
How to enter the market after the plunge?
After the market plummeted across the board, from a technical point of view, the oscillator indicators on the hourly chart have been gaining negative traction and supporting the prospect of further declines in gold prices during the session. Coupled with the current continued selling of gold, a position that needs to be focused on in the European session is around 3200. If it falls below this position decisively, it will pave the way for the weekly retracement trend.
At present, since the mid-term short orders I have arranged have been profitable and exited, if I want to gamble again, I need to pay close attention to the position of 3200. Breaking down and rebounding from support will usher in different market crazes and long-short games. The market fluctuates violently, and real-time entry is mainly based on real trading!

XAU/USD 12 May 2025 Intraday AnalysisH4 Analysis:
-> Swing: Bullish.
-> Internal: Bullish.
Analysis and bias remains the same as analysis dated 23 April 2025
Price has now printed a bearish CHoCH according to my analysis yesterday.
Price is now trading within an established internal range.
Intraday Expectation:
Price to trade down to either discount of internal 50% EQ, or H4 demand zone before targeting weak internal high priced at 3,500.200.
Note:
With the Federal Reserve's dovish stance and persisting geopolitical uncertainties, heightened volatility in Gold is expected to continue. Traders should proceed with caution and adjust risk management strategies in this high-volatility environment.
Price could also be driven by President Trump's policies, geopolitical moves and economic decisions which are sparking uncertainty.
H4 Chart:
M15 Analysis:
-> Swing: Bullish.
-> Internal: Bullish.
As mentioned previously mentioned that I would continue to monitor price and depth of bearish pullback following previous bullish iBOS.
Price did not pull back with any significance, therefore, I will apply discretion and not mark the previous iBOS. I have however marked this in red.
Price continued bullish and subsequently printed a bearish iBOS to indicate, but not confirm bearish pullback phase initiation.
Price is now trading within an established internal range, however, I will continue to monitor depth of pullback.
Intraday Expectation:
Price to trade down to either discount of internal 50% EQ, or M15 supply zones before targeting weak internal high priced at 3,435.055.
Alternative scenario:
Price has this far failed to target to target weak internal high, as has H4 TF. This could be related to the fact that all higher timeframes remain in corrective bearish pullback phase initiation, therefore, it should not come as a surprise if price prints a bearish iBOS.
Note:
Gold price volatility is expected to remain heightened due to the Federal Reserve’s dovish approach and persistent geopolitical uncertainties. Traders should remain vigilant, fine-tune their risk management strategies, and be prepared for potential price fluctuations in this highly volatile market. Additionally, recent tariff announcements by former President Trump are likely to exacerbate market instability, leading to further price swings.
M15 Chart:

"XAU/USD Bullish Breakout Setup - Potential Recovery Ahead"
After a sharp drop, XAU/USD is showing signs of consolidation near a key support zone. The chart outlines a potential bullish reversal setup with expected higher lows and a breakout towards the 3338 level. A clean entry with a favorable risk-reward ratio is marked, following market structure logic. This setup avoids risky language and is purely educational.

Rebound or reversal? Analysis of gold trend on Monday🗞News side:
1. The India-Pakistan conflict escalates again
2. The progress of China-US negotiations
📈Technical aspects:
On Friday, we judged that the gold price trend may form a "head and shoulders bottom" pattern. Technically, the key support level below is still focused on the 3270 line, while the 3450 level above constitutes a significant double-top structure resistance level. At the daily level, the recent K-line combination has completed a deep retracement from the 3500 mark with two long negative lines, directly breaking through the important support platform. The K-line on the current day continues to adjust with a shadow line, and the oscillating rhythm of alternating yin and yang is in line with the characteristics of technical corrections. At the beginning of the week, it is recommended to maintain the operation idea of high altitude, low and long
1.🎁BUY 3320-3325, SL 3312, TP 3360-3380
2.🎁SELL 3355-3360, SL 3368, TP 3320-3300
If you agree with this view, or have a better idea, please leave a message in the comment area. I look forward to hearing different voices.
OANDA:XAUUSD FX:XAUUSD TVC:GOLD FXOPEN:XAUUSD FOREXCOM:XAUUSD

XAUUSD Daily Outlook – Monday, May 12, 2025🔍 Daily Structure Summary:
After rejecting from the ATH zone (3500), price formed a corrective wave, with a clean bullish reaction from 3284–3292, now confirmed on Daily.
Friday’s daily candle closed bullish, forming a strong wick rejection from demand, indicating buy-side interest around 3290.
EMAs show price still in a pullback phase, with EMA21 and EMA50 overhead acting as dynamic resistance (~3360–3380).
📌 Key Daily Zones & Levels
Zone / Level Description
3448–3500 🔺 Premium Supply Zone – major rejection area (same as Weekly top)
3380–3395 🔁 Daily FVG + EMA confluence – near-term resistance zone
3340–3360 🔁 Old support → new resistance – possible rejection if unconfirmed
3284–3292 ✅ Confirmed Demand – recent bounce and bullish PA
3250–3265 🔵 Last defense zone – if this breaks, 3220 may be exposed
3220–3235 🔵 Major Daily Demand – matches Weekly BOS and potential reversal zone
📈 Current Price Action Notes:
Price is pushing away from 3290, aiming toward 3340–3360, where we may see the first intraday test of resistance.
A clean break above 3360 would open space toward 3380–3395, where FVG and EMA50 could slow price.
If price fails to hold above 3290, it may revisit 3250–3265 for a deeper liquidity sweep.
🧠 Flow Outlook for Monday:
Bullish scenario:
Price holds above 3290 and forms higher low → potential to reach 3360–3380 intraday. If that breaks, we target 3395.
Bearish scenario:
If we reject below 3340 and lose 3290 again, price may head back toward 3250–3235 for stronger demand testing.
📌 Summary of Levels (For May 12):
Type Price Zones Notes
Resistance 3448–3500 Premium HTF rejection zone
3380–3395 FVG + EMA confluence
3340–3360 Near-term intraday resistance
Support 3284–3292 Daily demand, bullish reaction confirmed
3250–3265 Key intraday demand & bounce zone
3220–3235 HTF daily demand + structure base

Gold: Potential Bullish Reversal Setup on XAU/USD from QML ZoneHello guys!
What I see:
QML in Lower Time Frame:
Price is currently testing a QML zone from a lower timeframe (marked in light blue).
This area aligns with a significant reaction point, suggesting institutional interest.
QML in Higher Time Frame:
Below this lies a higher timeframe QML, acting as a secondary support.
This adds confluence for a potential strong bullish rejection if the price dips further.
Engulfed Level:
A previously engulfed resistance level has been marked, showing where sellers lost control.
Price returning toward this area with reduced momentum indicates possible accumulation.
Targets Identified:
Multiple target levels are projected with an ascending structure.
These align with liquidity pools above recent highs, suggesting buy-side liquidity engineering.
Market Structure:
Current price behavior suggests the formation of higher lows and potential bullish continuation.
A corrective move into the QML zone could spark a strong impulsive leg upward.

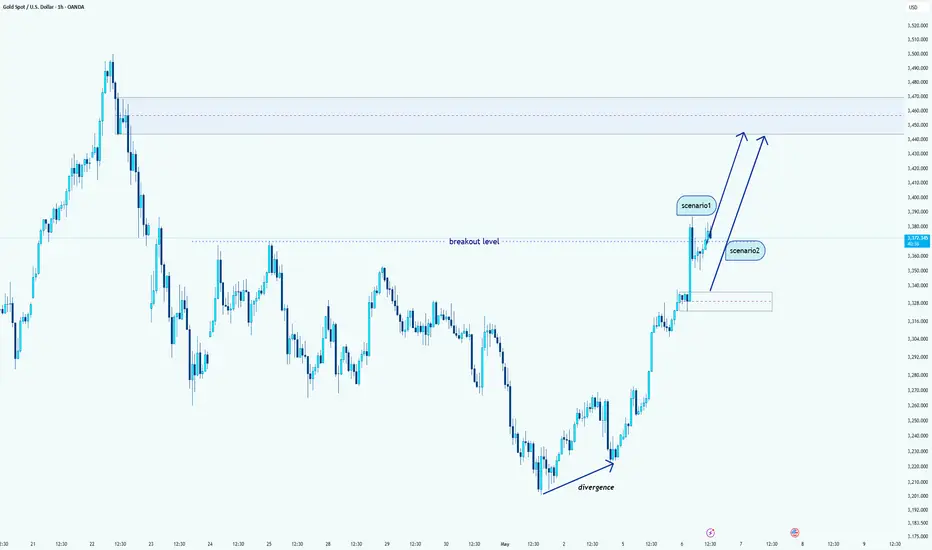
Gold (XAU/USD) Breakout Confirmed – Bulls Eye Higher TargetHello guys!
Gold has successfully broken above the key resistance level marked as the breakout level, confirming bullish momentum. This breakout follows a clear bullish divergence, indicating a reversal from the recent downtrend. The strong upward movement suggests increased buyer interest and continuation potential.
Two bullish scenarios are in play:
Scenario 1: Price continues upward from the current breakout zone without a retest, targeting the next resistance area around $3,440–$3,470.
Scenario 2: A pullback to the breakout level or the demand zone near $3,325–$3,340, followed by a bullish continuation.
What I see:
✅ Bullish divergence identified at the recent low
✅ Breakout from a significant resistance level
📈 Momentum favors continued upside
Will gold fall? Here comes the latest analysis.Technical analysis:
Gold fell rapidly in the morning and then bottomed out and rebounded. When the price broke through $3,324, it began to rise. The weak market will not rebound significantly. When the rebound that engulfed the decline appears, it will continue to rise. However, it should be noted that gold has been fluctuating at a high level for a week. It rose sharply on Monday and Tuesday, fell sharply on Wednesday and Thursday, and it is still fluctuating sharply today.
For the current trading market, I think the price of gold will continue to rise in the fluctuation. After the hourly cycle breaks through the $3,324 position, the market will gradually increase today, and there is room for further upward continuation. I think short-term trading is still mainly long; after the rebound high, you can choose a short strategy.
Action suggestions:
Long strategy: Go long at US$3330, stop loss at US$3320, and take profit at US$3360-3370.
Short strategy: short at $3,365, stop loss at $3,380, take profit at $3,300-3,310.

XAUUSD SHORT TRADE TECH AGAINST FUNDAMENTALSHighly valuable metal gold has lost its shine even after India Pakistan war tensions. Is tariff war more valuable than real war? Anyways let see how this short analysis go .

Gold head and shoulders bottom trend, bull market strong?🗞News side:
1. Tariffs push up inflation and slow down the economy, and the Federal Reserve may be in trouble
2. The situation between India and Pakistan escalates again
📈Technical aspects:
At the hourly level, today's Asian session continued the "wash-out" operation characteristics, quickly rising by 20 US dollars at the opening, and then stepped back to 3310 to confirm the top and bottom conversion support level. The two positive lines seemed to form a "yang-enclosing-yin" upward attack pattern, but suddenly reversed, not only breaking the trend support line of 3280, but also falling to 3274 before bottoming out and rebounding. This erratic trend has a significant long-short double kill effect for investors accustomed to trend continuation strategies. However, we can accurately find the right position in the market to trade and make profits.
At present, it is expected to form a "head and shoulders bottom" pattern from a morphological perspective, accumulating momentum for subsequent rises, and there is still room for upside in the short term. At present, any pullback is an opportunity for us to go long. Pay attention to the 3360-3370 line suppression on the top. If this resistance area is broken, it may open up a new round of upward space.
TVC:GOLD FOREXCOM:XAUUSD FXOPEN:XAUUSD TVC:GOLD FX:XAUUSD OANDA:XAUUSD
