Gold is down 100 points, but it still remains high and short.Technically speaking:
① Yesterday's daily line hit a high and fell back to close with a hanging neck line with a long upper shadow, which represents a short-term peak signal. Today's opening opened low and rebounded to repair the gap, which can determine the bottom support in the short term. Therefore, today's range has become a large range of 3313-3500.
From the daily Fibonacci retracement extension line, the current support is around 3291, that is, the range of 3291-3371, and the middle 0.236 is located at 3370.
②The 4-hour indicator macd is dead cross at a high level and runs with large volume, and the smart indicator sto is running near oversold, which means that the 4-hour market is still volatile and weak. In the short term, pay attention to the middle track and the moving average MA5 and MA10 corresponding to the 3403-3358-3404 line, and the short-term moving average MA30 corresponds to the 3350 line. From the 4-hour perspective, the current range is 3291-3371.
③ The current MACD of the hourly line is dead cross with shrinking volume, and the dynamic indicator STO is hooked upward, which represents the rebound trend of the hourly line. At present, we focus on the MA60 moving average, the middle track and the MA30 moving average, which currently correspond to the 3397-3354-3405 line, but will gradually move down over time.
In summary: short-selling in the area near the upper pressure of 3321-3351-3371, and maintaining high altitude as the main theme
Summary: In the short term, the high altitude callback is the main focus, and the key support level is arranged in batches for long orders to follow the long-term trend.
Goldprice

XAU/USD) orderblok key Support Analysis Read The ChaptianSMC Trading point update
technical analysis of Gold Spot against USD (XAUUSD) on the 1-hour timeframe. Here's a breakdown of the key ideas presented:
Chart Analysis Summary:
1. Price Zones:
Supply Zone (Resistance): Around the 3,355–3,365 level.
Demand/Support Zone (Doer Block Support Level): Around 3,282–3,291.
2. Current Price Action:
Price is currently at $3,331.96, close to the supply zone, and bouncing between the zones.
There’s a sharp downtrend, which seems to be slowing down near the support level.
3. Projected Move:
The chart suggests a short-term dip back into the demand/support zone, followed by a bullish reversal.
Target Point: A move back up toward $3,498.36, which is marked as a significant resistance.
4. Technical Indicators:
RSI (Relative Strength Index): Currently around 36.64 and recovering, suggesting potential bullish divergence or an oversold condition.
200 EMA: Around $3,291.52, providing dynamic support — aligning with the lower demand zone.
Mr SMC Trading point
Trade Idea:
Buy Setup (Long Trade):
Entry: Near 3,282–3,291 (support zone).
Target: 3,498.36.
Stop Loss: Below the support zone (~3,270).
Overall Idea:
This is a reversal-based setup. The price is expected to retest the support before launching a bullish leg toward the target. The confluence of the EMA, support zone, and RSI near oversold adds weight to the potential for a bounce.
Pelas support boost 🚀 analysis follow)

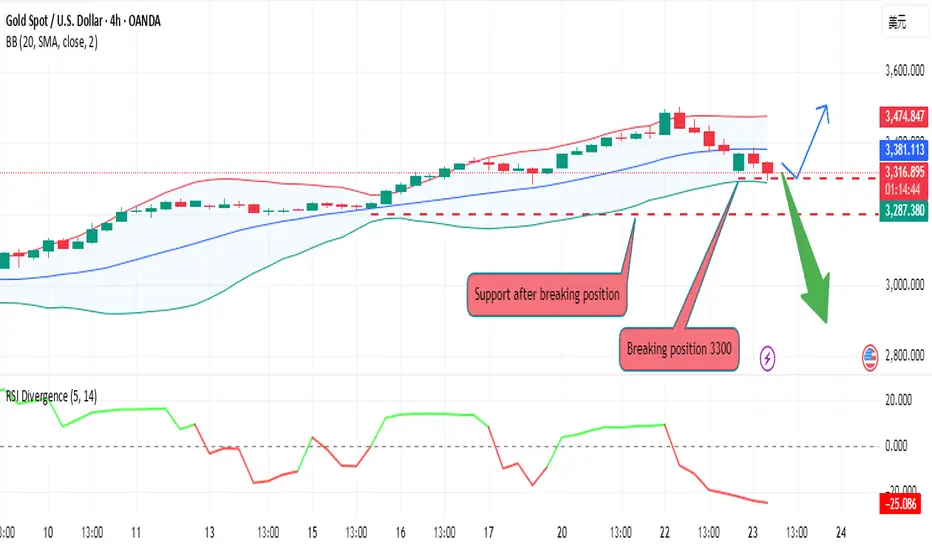
GOLD: Two Prominent Buying Areas to buy Gold From!Hey there! So, gold took a dip after hitting the $3500 mark, and it’s now at $3370. But here’s the thing, we think it might bounce back soon because it’s filled the liquidity gap. There are two possible points where it could turn around: right now or at $3330. Keep an eye on it and trade safely! Good luck!
Thanks for your support! 😊
If you want to help us out, here are a few things you can do:
- Like our ideas
- Comment on our ideas
- Share our ideas
Team Setupsfx_
❤️

Believe me, gold cannot fall all the way down
Gold prices fluctuated this week, hitting a record high of $3,500/ounce, then encountered resistance and fell to $3,300/ounce. The main reason for the record high in gold prices was that after US President Trump verbally attacked Federal Reserve Chairman Powell, the market was worried that the Federal Reserve would lose its independence. But after Trump and Bessant's remarks, market risk appetite rebounded, hitting safe-haven asset gold, and then plummeted all the way!
Is gold going to fall after a sharp retracement?
In fact, the market has a warning for today's retracement. After all, yesterday's closing line was a big negative line, so there must be a continuation in the trend of gold. Moreover, after yesterday's gold rose to 3,500, the trend weakened, and the market fell all the way to break the 3,400 mark and the 3,300 mark, and fell to the lowest level of 3,290! To be honest, this round of decline is still quite strong. After breaking the continuous positive, the market ushered in the suppression of the market retracement, and at present, there is still a trend of continuation!
In my opinion, the key entry point for long orders today is the previous rising point of 3280. The short-term retracement of gold is obviously continuing, and in the medium and long term, gold is still bullish. So our entry point is actually relatively simple. When it retreats to 3280, we can directly enter the market. There are still many opportunities for long orders. The retracement is not the peak!
Gold: 3280 more, defense 10, target 3330-45!
Join me and I will guide you to a profitable trade 💵!

Gold falls from highs, medium-term bullish structure remains uncSpot gold prices continue to fall, extending the correction of the psychological level of $3,500.
At the same time, senior Trump administration officials hinted that they are "paving the way" for a trade agreement with Asian powers, further boosting investors' confidence in the global economic outlook, thereby weakening demand for safe-haven gold.
Fed policy expectations still support gold's downward space.
Despite improved risk sentiment, the market still expects the Fed to launch a new round of interest rate cuts in June, with three rate cuts expected throughout the year, which makes gold's medium-term trend still optimistic. At present, weak US economic data and the president's erratic trade policy have further suppressed investors' confidence in US dollar assets.
Quaid believes that the market's expectations for the Fed's interest rate cuts have supported the structural upward trend of gold, even if it faces a technical correction in the short term.
Technical aspects show that gold may adjust in the short term, but the support below is strong.
Quaid's analysis:
The current adjustment pressure faced by gold comes more from short-term market sentiment repair and technical profit-taking, but the medium- and long-term fundamentals are still strong. The Fed's interest rate cut expectations have not changed, the US dollar has a clear medium-term weakening trend, and geopolitical factors are still highly uncertain. Gold is still in a bull-dominated pattern overall.
Operation strategy:
3325 long, stop loss 3315, take profit 3350. If it stops rising at 3350, traders can flip the operation strategy and short at this position.

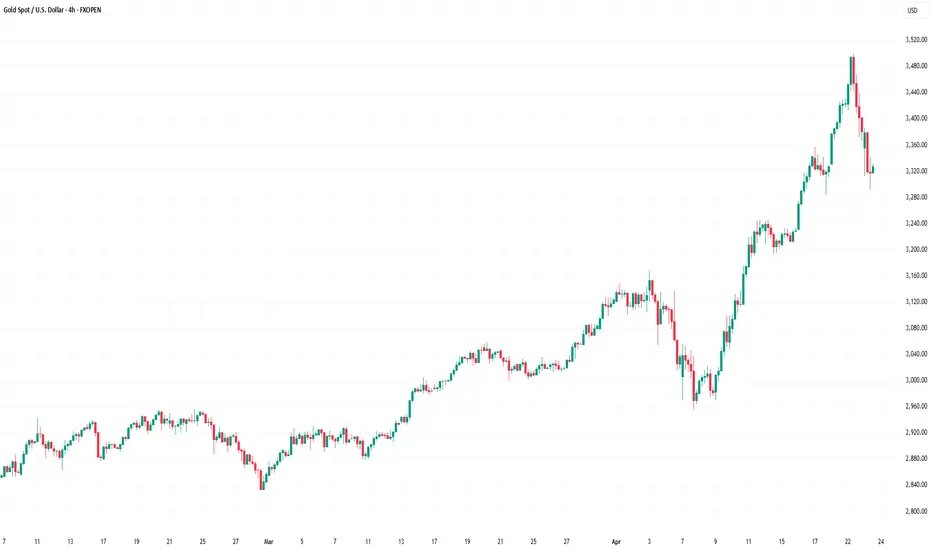
Gold Price Plunges After Climbing to $3,500 for the First TimeGold Price Plunges After Climbing to $3,500 for the First Time
As the XAU/USD chart shows:
→ Yesterday, the spot gold price stopped just a few cents short of the key psychological level of $3,500 (and even exceeded it on the futures market);
→ But this morning, an ounce is trading around $3,300, having dropped aggressively by more than 5%.
Why Did Gold Suddenly Drop?
The sharp decline followed a shift in rhetoric from President Trump. According to Reuters:
→ The US President backed away from threats to dismiss Federal Reserve Chair Jerome Powell;
→ He also signalled a more moderate stance on tariffs against China.
Market participants interpreted this as a reason to take profits on long positions, as the softened tone from the White House reduced demand for safe-haven assets. As a result, gold collapsed from its historic high, while the US dollar index rebounded from multi-month lows.
Technical Analysis of the XAU/USD Chart
Gold price fluctuations have formed an upward channel (highlighted in blue), with key reversal points marked for constructing the channel. From this perspective, one interpretation is that the upper boundary marked a price area where gold was extremely overbought. Now, the imbalance in market sentiment may be driving the price back towards the median, where supply and demand tend to stabilise.
And although the $3,300 level is currently acting as support, the XAU/USD chart reveals several signs suggesting that bears are taking control:
→ The price has dropped by approximately $200 in less than two days;
→ A bearish Fair Value Gap has formed during the decline (highlighted by a rectangle) – a pattern typically interpreted as sellers outweighing buyers;
→ The steep purple ascending channel has been broken.
It can be assumed that even if the fundamental backdrop offers reasons for a short-term price recovery, this may prove to be only a temporary bounce following a sharp shift in sentiment towards bearishness at the start of the current week.
This article represents the opinion of the Companies operating under the FXOpen brand only. It is not to be construed as an offer, solicitation, or recommendation with respect to products and services provided by the Companies operating under the FXOpen brand, nor is it to be considered financial advice.
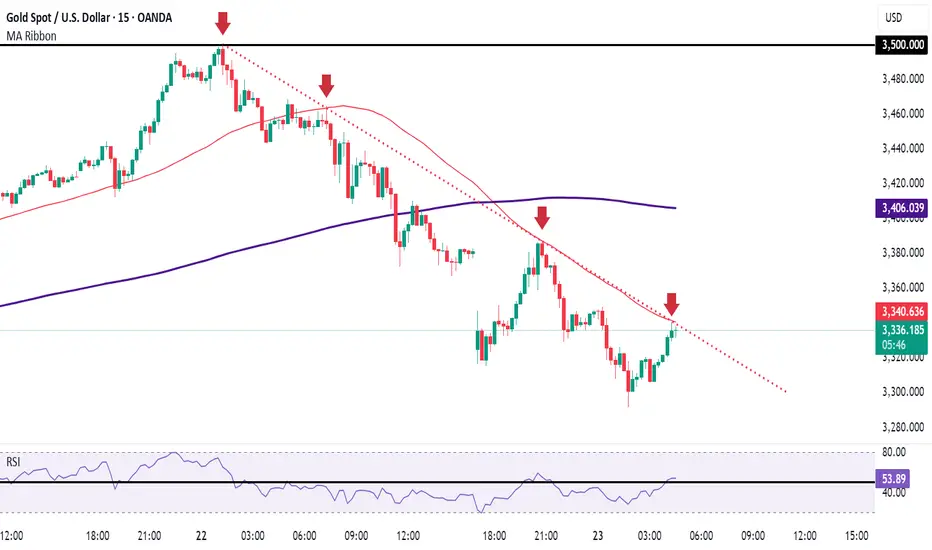
Gold Short Term UpdateGold on M15 formed a valid descending trendline with 4 touches rejected
so now we're waiting for a M15 candle to broke and close above the touch of the trendline to activate the long (buy) trade
Trade safe and don't forget to trade with risk management
Follow us for more updates and ideas
The president's words instantly changed the gold market
📌 Driving events
Today, Wednesday, Trump said that although he was frustrated that the Federal Reserve had not been able to lower interest rates faster, he had no intention of firing Federal Reserve Chairman Powell.
The remarks marked a huge shift in Trump's attitude. He has recently stepped up his criticism of Powell and refused to rule out the possibility of taking the unprecedented step of firing Powell.
After Trump said he had no intention of firing Powell, the situation between Russia and Ukraine slowed down, and the market's optimism about the possible easing of trade tensions heated up, U.S. stock index futures soared and the dollar strengthened.
Asian spot gold opened directly at a gap down on Wednesday, and then the decline widened further, reaching a low of $3,293. It is only $10 away from the 3,283 support line I predicted before.
📊Comment analysis
Gold has some signs of a head and shoulders top, and the current shoulder position is almost here at 3,340-50.
So, if there is a chance to pull back to 3,340-50 next. The support line is still around 3282.
Be sure to enter the market and short without hesitation.
💰Strategy Package
Short position:
Actively participate at 3350 points, profit target is around 3290 points
⭐️ Note: Labaron hopes that traders can properly manage their funds
- Choose the number of lots that matches your funds
- Profit is 4-7% of the capital account
- Stop loss is 1-3% of the capital account

GOLD Trending Higher - Can buyers push toward 3,500$?OANDA:XAUUSD is trading within a clear ascending channel, with price action consistently respecting both the upper and lower boundaries. The recent bullish momentum indicates that buyers are in control, suggesting there's chances for potential continuation on the upside.
The price has recently broken above a key resistance zone and may come back for a retest. If this level holds as support, it would reinforce the bullish structure and increase the likelihood of a move toward the 3,500 target , which aligns with the channel’s upper boundary.
As long as the price remains above this support zone, the bullish outlook stays intact. However, a failure to hold above this level could invalidate the bullish scenario and increase the likelihood of a pullback toward the channel’s lower boundary.
The recent surge in gold prices is driven by escalating U.S.-China trade tensions and a weakening U.S. dollar. Gold reached a record high of $3,390 per ounce, fueled by concerns over global economic stability and increased demand for safe-haven assets. Analysts have raised their three-month gold forecast, due to ongoing market uncertainties.
Despite the upward momentum, I think still gold may be overbought in the near term, indicating potential for a short-term correction . Nevertheless, the overall bullish trend remains strong, supported by geopolitical tensions, central bank purchases, and investor demand for strong assets.

XAU/USD 23 April 2025 Intraday AnalysisH4 Analysis:
-> Swing: Bullish.
-> Internal: Bullish.
Price has now printed a bearish CHoCH according to my analysis yesterday.
Price is now trading within an established internal range.
Intraday Expectation:
Price to trade down to either discount of internal 50% EQ, or H4 demand zone before targeting weak internal high priced at 3,500.200.
Note:
With the Federal Reserve's dovish stance and persisting geopolitical uncertainties, heightened volatility in Gold is expected to continue. Traders should proceed with caution and adjust risk management strategies in this high-volatility environment.
Price could also be driven by President Trump's policies, geopolitical moves and economic decisions which are sparking uncertainty.
H4 Chart:
M15 Analysis:
-> Swing: Bullish.
-> Internal: Bullish.
Analysis and bias remains the same as yesterday's analysis dated 22 April 2025.
In addition we should be mindful that All HTF's require a pullback and H$ TF has indicated the start of bearish pullback phase as a bearish CHoCH has been printed, therefore, it should not come as a surprise if price printed a bearish iBOS.
You will note that currently price has mitigated an M15 demand zone and strong low is currently holding.
Price printed as per analysis dated 18 April 2025 by targeting weak internal high.
Price has continued to print higher-highs with minimal pullbacks.
Multiple CHoCH's have been printed, however, I will apply discretion and not classify them as CHoCH's in order not to distort internal structure due to very minimal pullbacks.
Since most recent all time high price has printed a bearish CHOCH and is now trading within an established internal structure which I will continue to monitor.
Intraday Expectation:
Price to trade down to either discount of 50% internal EQ, or M15 demand zone before targeting weak internal high priced at 3,500.200
Note:
With the Federal Reserve maintaining a dovish stance and ongoing geopolitical tensions, volatility in Gold prices is expected to remain elevated. Traders should exercise caution, adjust risk management strategies, and stay prepared for potential price whipsaws in this high-volatility environment.
Trump's tariff announcement will most likely cause considerably increased volatility and whipsaws.
M15 Chart:

Gold operation strategy, how to grasp the ups and downs of the mAt the end of the Asian market, spot gold maintained a sharp decline in the day. The current gold price is around $3,305/ounce, and it plummeted during the day.
Gold prices fluctuated this week, hitting a record high of $3,500/ounce, and then encountered resistance and fell to the $3,300/ounce level. The main reason for the record high in gold prices was that the market was worried that the Federal Reserve would lose its independence after US President Trump verbally attacked Federal Reserve Chairman Powell.
US President Trump said on Tuesday evening local time that he had no intention of firing Federal Reserve Chairman Powell. Trump also said that tariffs on Chinese imports would be "substantially" reduced from the current 145%.
Quaid believes that the hope of easing Sino-US trade tensions has driven a positive shift in risk sentiment and a recovery in the US dollar. Investors used this as an excuse to take profits on their gold long positions.
Latest trading analysis:
The gold daily chart shows that the 14-day relative strength index (RSI) has fallen back from the overbought area to the bullish area. The latest decline in this leading indicator supports a new round of decline in gold prices. However, as long as gold prices can hold the $3,300/oz level, gold buyers still have hope.
If the gold correction deepens, gold prices may challenge the 21-day simple moving average (SMA) of $3,163/oz. Before that, the $3,200/oz mark may provide some support for buyers.
On the other hand, if the upward trend resumes, gold prices may re-break through $3,400/oz and then aim for the historical high of $3,500/oz.
Gold has been volatile recently. If traders are not doing well in gold operations at present, I hope Quaid's analysis can make your investment smooth. Welcome all traders to communicate.
Interpretation of gold short-term operation ideasThe gold market opened at 3423.4 in the morning yesterday, and then the market fell back to 3411.6, and then the market rose strongly. The daily line reached a high of 3500.4, and then the market fell under technical pressure. Subsequently, the market took profits and went down. The daily line gave a low of 3365.8 and then the market consolidated. The daily line finally closed at 3381.2, and the market closed in an inverted hammer pattern with a very long upper shadow. After the end of this pattern, the market continued to be short after opening low today. In terms of points, yesterday's short positions at 3496, 3468 and 3442 were reduced, and the stop loss was followed up at 3445. If it opens low today and falls directly, give 3292 long stop loss 3285. The target is 3336, 3350, 3365 and 3374. Exit the market and continue the short stop loss at 3381. The target is not released and the loss is held in stages.

Gold price plunged nearly $200. The signal of cooling down the tIn the early Asian session on Wednesday, spot gold opened nearly $40 lower and hit $3,313.51 per ounce, down nearly $200 from the historical high of 3,500 hit on Tuesday. Because U.S. Treasury Secretary Benson hinted that international trade tensions would ease, which stimulated optimism in the stock market and boosted the dollar to a near one-week high; spot gold closed down 1.2% on Tuesday, closing at $3,380.95 per ounce.
Bob Haberkorn, senior market strategist at RJO Futures, said: The latest remarks suggest that the trade war with the Asian giant may ease, but this is the time to start selling.
After Benson said that the tariff deadlock was unsustainable, the U.S. stock market rose by more than 2%, suppressing the safe-haven buying demand for gold, and the rebound of the U.S. dollar also suppressed the price of gold.
Quaid believes that its roller coaster trend is still continuing. I hope traders will pay attention to the speeches of several Fed officials later this week, hoping to find clues to future monetary policy at a time when people are worried about the independence of the Fed. And I will analyze it for you as soon as possible and give you reasonable suggestions.
Current strategy:
Relative to the market situation: as long as the price can continue to rise, it means that the current situation is just a volatile market, not a peak retracement, which is also a feature of the volatile trend; at the same time, the current market is not extremely strong after a sharp drop, and it is still in a volatile rise; therefore, do not go long, but go long after the retracement support.

Can the 3370 support level turn the tide?The Asian session low of 3413 rebounded to 3500 under pressure, and then fell back to 3370 in the evening, with a single-day fluctuation of more than 100 points. Since the 14-day bull market started at 2959 on April 7, the gold price has soared 500 points, and the short-term overbought has triggered technical correction pressure. The current market presents a strong pattern of "buying on every correction", and even if there is a long upper shadow, the bullish sentiment still dominates the market.
From a technical perspective, the support near 3370 is crucial. If it holds, the bullish trend will continue; otherwise, a break may trigger a deeper adjustment. Although there is short-term profit-taking pressure, the overall market is bullish. It is recommended to pay attention to the key support level of 3370 and be alert to low-long opportunities in repeated fluctuations.

Gold intraday high V reversal looks to continueToday's market analysis and interpretation:
First, the gold daily level: After closing with a full increase of 100 US dollars yesterday, it continued to rise by nearly 90 US dollars today. The daily line may not feel the acceleration, but from the weekly line, the trend of continuous large positives for nearly three weeks and an increase of more than 500 US dollars, it seems to be accelerating to the top; although the overall bullish trend this year will not be affected at all, in the short term, some bulls may flee due to the accelerated pull, that is, profit-taking, which is often more likely to happen; In addition, yesterday's research report focused on interpreting the trend of 2956 to 3500. It is very likely to cycle the previous wave of 2832 to 3167. The maximum retracement of 618 division position just confirms the previous top and bottom support of 3167. In addition, from the wave shape, if 2832-3167 belongs to the first wave, 3167 to 2956 belongs to the second wave, and the third wave is calculated by 1.618 times the first wave, it is exactly 3498, which is today's intraday high of 3500. Then the fourth correction wave may be brewing in the follow-up, which is generally the third wave 382 or 50 division, and it generally will not fall below the first wave high of 3167. Therefore, in the next few days, if 3500 cannot be broken through again, the correction will focus on the 382 division support 3292 and the 50 division support 3228. The limit is that it is unlikely to fall too far from 3167, and then Waiting for the opportunity of band bullishness, each squat adjustment is to further continue the bullish trend;
Second, gold 4-hour level: the current MA5-day moving average support is barely holding up temporarily, and the top is a bearish pattern of "evening star" with a large Yin wrapped in Yang. It needs to be combined with the subsequent K-line pattern. If there are continuous Yins and large Yins continue to appear, then this cycle will begin to be under pressure, and the MA10-day support of 3428 and the middle track of 3378-72 will be gradually tested below;
Third, gold hourly level: Asian session continues to rise sharply, but the European session suppresses the 3500 line and falls back, temporarily supporting the middle track. The inability of the European session to attack increases the risk of further downward adjustment tonight; once the middle track is effectively lost, it will continue to fall. Finally, tonight, we can gradually see the 66-day moving average, which is also the lower track of the white channel in the figure, about 3380; The short-term resistance is the 10-day moving average and the white channel counter-pressure point, concentrated at 3470-3480, which happens to be the 618 division point of the European session's decline and rebound; therefore, pay attention to 3470-3480 tonight. If it cannot withstand the pressure, it will continue to decline and gradually look at 3428 and 3411. The strong support is in the range of 3380-3370 tonight. If it stabilizes here, it will rebound to confirm the middle track, and the ups and downs will be huge.

XAUUSD H4 Outlook + Key Levels – April 21, 2025✅ XAUUSD H4 Outlook + Key Levels – April 21, 2025
🧭 Market Context & Trend After a powerful continuation post-holiday, Gold smashed through the previous ATH and is now trading in a vertical, parabolic leg — with minimal structure below and zero resistance above.
💣 Middle East tension + macro safe-haven flows = strong fuel for this spike. But we’re now in a price zone where traps and liquidation are very likely.
📈 Trend:
• H4: Strong bullish BOSs since April 10
• No valid H4 CHoCH yet — structure remains bullish
• Price is deep inside unmitigated premium, with signs of slowing momentum intraday
🔼 Key Levels ABOVE Price
Type Zone Notes
🔻 Premium Sweep Zone 3395–3405 Key area around ATH for possible fakeout/sell trap setups — watch for M5/M15 CHoCH or BOS here
🧱 Ultimate Spike Zone 3415–3425 High-impact inefficiency from lower timeframes + round number zone – ideal for stop hunts
🚨 Extreme Spike Risk 3435–3455 No structure here — only if geopolitical tensions worsen
🔽 Key Levels BELOW Price
Type Zone Notes
🔵 Intraday Buy Zone 3333–3340 Minor FVG + OB zone – valid only for scalps or continuation if PA confirms
🟩 HTF Demand 3284–3288 Strong OB + FVG + clean H4 CHoCH base – valid for swing longs if dump occurs
⚓️ Institutional Support 3220–3235 Last clean unmitigated H4 demand + equilibrium from macro breakout zone
🧠 Trading Considerations
🔻 SELL setups only valid with clear bearish confirmation (M5/M15 CHoCH + momentum shift) inside the 3395–3405 zone. No blind shorts — the trend is still active.
🟢 BUY setups are cleaner from 3284+ or deeper — chasing now is extremely risky unless price builds structure above 3400.
📉 A fast spike followed by breakdown could signal a swing reversal from this premium zone.
🎯 H4 Bias:
Cautiously Bullish — structure is clean, but price is hyperextended. Best setups will come after liquidity is taken.

Gold hits 3500 retracement adjustmentGold Technical Forecast:
From a technical perspective, gold is confidently moving along a bullish trajectory. There is no doubt about that. But the signals now sent by the Relative Strength Index (RSI) and other momentum indicators are worth paying attention to. The daily RSI reading is close to 80, which has entered the severely overbought area. However, this does not necessarily indicate impending doom. It just confirms what we already know: buyers are in control.
So, is the price close to a top? Possibly. But I would not sound the alarm bells just yet. These high indicators are more of a warning than a battle cry. It is more of a "stay alert" than a "get out of here".
Spot Gold Technical Levels to Watch
Gold's climb to a record $3,500 was impressive, but as expected, it has begun to retreat slightly from this psychological high, most likely due to some conventional profit-taking. There is no natural resistance above this level; all we have are round numbers. However, on the way down, the situation is different.
Technical Analysis
Initial support includes Monday's high of $3,430 and the round number mark of $3,400 on the daily chart. Looking further down, $3,357 is last week's breakout level, followed by reliable support at $3,300. If a more meaningful pullback occurs, $3,245 and $3,167 will be worth watching, both of which were previous resistance ranges and are now likely to become support levels.

Trump and Powell's "power showdown" ignites global risk aversion
📌 Driving events
On Tuesday (April 22), gold prices soared and set a new record high. Spot gold once hit the $3,500 mark, an increase of about 2.2%. US President Trump criticized Federal Reserve Chairman Powell for worrying the market, suppressing risk appetite and pushing investors to turn to safe-haven gold. After hitting the 3,500 mark, the price of gold fell slightly. Spot gold is currently trading at nearly $3,478.55 per ounce.
📊Comment analysis
KCM Trade Chief Market Analyst Tim Waterer pointed out that under the double blow of tariff concerns and the Trump-Powell farce, investors are fleeing US assets across the board. The continued weakness of the US dollar has created an excellent opportunity for gold to rise.
On Monday, Trump made a tough statement, asking the Federal Reserve to "cut interest rates immediately" otherwise the US economy will face the risk of slowing down. Powell insisted last week that interest rates should not be easily adjusted until the impact of Trump's tariff policy on inflation becomes clear.
💰Strategy Package
Long position:
Actively participate near 3430, with profit target above 3500 points
⭐️ Note: Labaron hopes that traders can properly manage their funds
- Choose the number of lots that matches your funds
- Profit is 4-7% of the fund account
- Stop loss is 1-3% of the fund account

Gold rose 90 points and then fell back? Maybe there will be a suIt rose from the early trading, rose to the 3500 mark and was under pressure, and then returned to the 3409 line at the lowest. If it does not fluctuate by more than 100 points every day, is it not the ultimate safe-haven asset? My heart really can't stand it. Brothers who have observed carefully should have discovered that the current round of gold rise started from 2961, and rose by 500 US dollars in just 14 days. Only when today's upper lead is really closed, can we say that the bulls will cool down a little!
But this is not the first time. For example, last week's weekly line retreated, and it was directly pulled up at night. This week's opening rose by more than 100 points. The current market retreat is to go long. No matter what point you are at, as long as it is currently rising, then you can only witness one thing, that is, rising!
At present, I am not optimistic about the continued decline. The market sentiment of long positions also leaves me no choice. The current long positions have not reached the top. The best opportunity is to look at the integer support of 3400, which may give the bulls an unexpected surprise!
I am Quide. Seeing my analysis strategy, no matter the past gains and losses, I hope that you can achieve investment breakthroughs with my help and turn every tide of the gold market into our wealth wave.

Place long orders after the adjustment is over!After gold accelerated its rise in the Asian session, it fell back in the European session and temporarily entered an adjustment cycle, accumulating strength to provide power for the next round of launch. The short-term support in the US session is 3430 and 3412. In terms of operation, go long according to the strength of the decline. There is still no guess on the top, and gradually look to 3480 and 3500! Short-term volatility has increased, and the notice has been issued before the market!
Operation suggestion: Gold is long near 3410-15, and look at 3445 and 3455!

Gold's retracement is an opportunity to go longStay long and don't relax. Continue to buy gold when it falls back!
The gold market has fluctuated violently recently, with a rise of $100 and a fall of $90, which has brought great obstacles to our trading. Long and short positions with bad entry positions will be washed out, so we need to wait patiently for opportunities in operation. The strong market remains unchanged. Continue to buy when it falls back. Find the watershed position to participate in the transaction. It is better to miss it than to be too aggressive. In the Asian session, I will share with you the support of the 3405/3410 watershed of gold. I will rely on this position to buy when it falls back. Gold hit a high of 3499 during the day, which is one step away from 3500. The European and American sessions fell back by $90, which just happened to fall back to the watershed position shared with you in the Asian session. The long orders have also been realized at the target position. Friends who have participated should pay attention to protecting profits, and friends who are short should wait patiently for opportunities and not be too aggressive!

Gold bulls are not strong enoughGold has begun to form an inverted V reversal pattern in the 1-hour moving average. If the 1-hour moving average of gold begins to turn, then gold may have a deep adjustment. If there is no strong risk-averse news for gold, then adjustments are inevitable. Gold is at least volatile in the short term. Don’t chase too much easily. Pay attention to the pressure near 3450.
Trading idea: short gold near 3446, stop loss 3456, target 3426

XAUUSD Daily Sniper Plan – April 22, 2025Structure: Premium rejection after ATH 3500 | Intraday bearish | HTF bullish trend
📉 Trend & Bias
Macro (D1–H4): Bullish trend remains intact, but price rejected perfectly from the confirmed ATH at 3500, creating a bearish engulfing on H4 and Daily.
Short-term (H1–M30): Bearish bias for intraday plays, confirmed by clean CHoCH and BOS on H1 + M30.
🔻 SELL SCENARIO #1 – RETEST OF LAST M15/H1 OB
Entry Zone: 3485–3492
SL: 3501 (above ATH wick and OB invalidation)
TP1: 3450
TP2: 3425
TP3: 3405
Confluences:
Last valid OB on M15 before the drop
FVG + imbalance above
Weak high at 3492
Premium zone sweep
Rejection from HTF ATH zone
🔻 SELL SCENARIO #2 – LIQUIDITY FAKEOUT ABOVE 3465
Entry Zone: 3463–3467
SL: 3474
TP1: 3435
TP2: 3415
TP3: 3400
Confluences:
M5–M15 LHs and CHoCH
Bearish reaction candle after multiple taps
Previous imbalance and minor OB
Trap area if price fails to break cleanly
🟢 BUY SCENARIO #1 – REACTION FROM CLEAN FVG + LIQUIDITY SWEEP
Entry Zone: 3405–3412
SL: 3395
TP1: 3440
TP2: 3460
TP3: 3480
Confluences:
Clear FVG chain (H1 + M30)
Deep discount sweep
Liquidity below 3405
Structure support + RSI oversold bounce potential
🟢 BUY SCENARIO #2 – FVG BOUNCE AT EQ ZONE
Entry Zone: 3414–3420
SL: 3404
TP1: 3450
TP2: 3475
TP3: 3495
Confluences:
EQ of M30 range
Base of unfilled FVG
Strong reaction last time from this zone
EMA21 support
🔍 Key Zones & Market Notes
Type Level Description
🔺 ATH 3500 Confirmed all-time high (April 22)
🔻 OB Sell 3485–3492 Last clean M15–H1 OB
⚠️ Weak High 3492 Inducement zone – watch fakeouts
🟩 FVG Buy 3405–3412 Strong FVG + liquidity sweep zone
📉 H1 BOS 3456 Intraday momentum shift
🔻 CHoCH 3440 Confirmed lower structure
🟦 Major Support 3362–3368 Valid HTF demand if price breaks down
🔲 EMA Zones EMA21/50 H1 Near 3415–3430 – dynamic support
🧠 Summary
Gold is rejecting heavily from the new ATH at 3500. Intraday structure broke bearish (CHoCH, BOS on H1/M30), and price is now trading between premium OBs and deep FVGs. Both buy and sell sniper entries are available depending on how price reacts to 3465–3485 or if it sweeps the 3405–3412 liquidity area. HTF trend is bullish, but NY could bring a deeper correction if 3400 breaks.
🧠 Stay sharp. Avoid random entries. Stick to clean structure zones.
📊 Drop a like, leave a comment, and follow @GoldFxMinds for daily precision trades!
