Gold swing trade week 16/03/25Last week he had a trade from 2880 that ran for 1244 pips congragulations if you took it.
This week we are looking for a sell then leading into a buy at previous resistance.
Current Price Action:
Gold is trading near $2,984, slightly rejecting resistance.
The price is respecting the ascending channel with higher highs and higher lows.
Support & Resistance Levels:
Immediate Resistance: Around $2,998 - $3,000, psychological and technical resistance.
Key Support: 2,961 - $2,965 (potential buy zone).
Next Major Resistance: 3,021 - 3,030 (Fibonacci extension + trendline target).
Fibonacci Levels:
The 0.618 Fibonacci retracement around 2,964 aligns with a potential buy entry.
The 0.382 retracement at 2,996 acts as immediate resistance.
Trendlines & Channel:
Price is respecting the bullish channel.
A break above 3,000 could push XAU/USD toward 3,021 - 3,050.
If price breaks below 2,961, a retracement to 2,930 - 2,900 is possible.
Moving Averages:
Short-term EMA (White) is above the Green MA, signaling continued bullishness.
If the price holds above 2,965, bulls remain in control.
Goldprice

Gold weekly chart with buy and sell levels 15/03/25Gold has achieved new all-time highs this week, breaking the 3000 level before retreating to 2982. As we look ahead to the coming week, I've outlined key buy and sell levels on this 4-hour Gold chart, along with potential entries.
For a buy, consider entering at 2988, targeting 2990 as the first resistance. If this level is surpassed, the next resistance range could be around 3000 to 3005. It's important to follow the chart levels closely and secure profits along the way.
For a sell, an entry at 2977 could aim for a move down to 2970, with subsequent targets around 2962 to 2960 as resistance levels. Stick to the marked entries on the chart for better clarity and control.
As always use proper risk management , take profit along the way and dont overleverage

Expect a strong pull back on Gold next week!Hello traders,
We have seen that Gold experienced a significant bullish trend last week, culminating in surpassing the $3,000 per ounce milestone for the first time on March 14, 2025.
Several factors contributed to this surge:
1. Market Uncertainty Driving Safe-Haven Demand – With ongoing global economic tensions, particularly due to U.S. trade policies, investors are turning to gold as a reliable hedge against instability.
2. Central Banks Boosting Gold Reserves – Many central banks are increasing their gold holdings, adding steady buying pressure that supports rising prices.
3. Speculation on Interest Rate Cuts – Expectations that major central banks, especially the Federal Reserve, may lower interest rates have made gold more attractive, as it benefits from a low-rate environment.
4. Inflation Concerns Fueling Demand – With fears of rising inflation, investors see gold as a traditional store of value that can help preserve wealth over time.
For a long time, many investors expected gold to hit the $3000 mark. Gold broke through that level on Friday, but it ended the day below it. We can anticipate a significant pullback in gold by next week based on recent price action. And these are my thoughts: We will be looking for shorting possibilities below 2978.620, with an initial target of 2961.524 and an overall objective of 2931.979. On the other hand, we can disregard the initial assumptions and assume that the price will continue to grow if we observe that it keeps rising and closes above Friday's high.
How do you plan to trade gold next week traders? Let me know your thoughts in the comment section.

XAU/EUR "The Gold vs Euro" Metal Market Heist Plan🌟Hi! Hola! Ola! Bonjour! Hallo! Marhaba!🌟
Dear Money Makers & Thieves, 🤑 💰🐱👤🐱🏍
Based on 🔥Thief Trading style technical and fundamental analysis🔥, here is our master plan to heist the XAU/EUR "The Gold vs Euro" Metal Market. Please adhere to the strategy I've outlined in the chart, which emphasizes short entry. Our aim is the high-risk Green Zone. Risky level, oversold market, consolidation, trend reversal, trap at the level where traders and bullish thieves are getting stronger. 🏆💸Book Profits Be wealthy and safe trade.💪🏆🎉
Entry 📈 : "The vault is wide open! Swipe the Bearish loot at any price - the heist is on!
however I advise placing Sell Stop Orders below the breakout MA or Place Sell limit orders within a 15 or 30 minute timeframe. Entry from the most recent or closest low or high level should be in retest. I Highly recommended you to put alert in your chart.
Stop Loss 🛑: Thief SL placed at 2800 (swing Trade Basis) Using the 1H period, the recent / swing high or low level.
SL is based on your risk of the trade, lot size and how many multiple orders you have to take.
Target 🎯: 2680 (or) Escape Before the Target
🧲Scalpers, take note 👀 : only scalp on the Short side. If you have a lot of money, you can go straight away; if not, you can join swing traders and carry out the robbery plan. Use trailing SL to safeguard your money 💰.
📰🗞️Fundamental, Macro, COT, Sentimental, Positioning, Overall Outlook:
╰┈➤XAU/EUR "The Gold vs Euro" Metal Market is currently experiencing a bearish trend,., driven by several key factors.
╰┈➤Fundamental Analysis
Interest Rates: Fed at 3-3.5%, ECB at 2.5%—U.S. yield advantage pressures gold, ECB easing weakens EUR—neutral.
Inflation: U.S. PCE 2.6%, Eurozone 2.8%, Japan 2.5%—global inflation boosts gold’s hedge appeal—bullish.
Demand: Central banks (e.g., China, Russia) buy ~8M oz. in 2025; European ETF inflows up—bullish.
Geopolitics: U.S.-China tariffs, Russia-Ukraine tensions—safe-haven demand rises—bullish.
EUR Strength: ECB dovishness vs. Fed stability weakens EUR—bullish for XAU/EUR.
╰┈➤Macroeconomic Factors
U.S.: PMI 50.4, jobless claims up—USD softens, gold gains—bullish.
Eurozone: PMI 46.2, growth stagnant—EUR weakens—bullish.
Global: China 4.5%, Japan 1%—slow growth, risk-off favors gold—bullish.
Commodities: Oil $70.44 (U.S./OPEC)—stable, neutral.
Trump Policies: Tariffs (25% Mexico/Canada, 10% China)—EUR weakens, gold rises—bullish.
╰┈➤Commitments of Traders (COT) Data
Speculators: Net long ~50,000 contracts (global futures, down from 60,000)—cautious bullishness.
Hedgers: Net short ~60,000—stable, locking in highs.
Open Interest: ~120,000 contracts—sustained global interest, mildly bullish.
╰┈➤Market Sentiment Analysis
Retail: 55% short (global X posts)—contrarian upside risk—bullish.
Institutional: Bullish long-term (e.g., $3,000 XAU/USD targets), short-term caution—neutral.
Corporate: Global miners hedge at 2,750-2,800 EUR—neutral.
Social Media Trends: Mixed—bearish to 2,650 EUR, some see buy zone—neutral.
╰┈➤Positioning Analysis
Speculative: Longs target 2,750-2,800, shorts aim for 2,650-2,600 (global consensus).
Retail: Shorts at 2,710-2,720—squeeze risk if price rises.
Institutional: Balanced, favoring inflation-driven gold gains.
╰┈➤Quantitative Analysis
SMAs: 50-day ~2,650, 200-day ~2,500—price above both, bullish.
RSI: 52 (daily)—neutral, flexible for moves.
Bollinger: 2,670-2,730—price near upper band, breakout potential.
Fibonacci: 61.8% from 2,800-2,400 at 2,686—support holds.
Volatility: 1-month IV 11%—±30 EUR daily range.
╰┈➤Intermarket Analysis
EUR/USD: Below 1.0500—EUR weakness boosts XAU/EUR—bullish.
DXY: 106.00, softening—supports gold—bullish.
XAU/USD: 2910—aligned with XAU/EUR rise—bullish.
Equities: SPX500 5990, stable—neutral.
Bonds: U.S. 3.8% vs. Eurozone 2.2%—yield gap weakens EUR—bullish.
╰┈➤News and Events Analysis
Recent: Trump tariffs (Feb 23-25) and Russia-Ukraine talks—risk-off lifts gold—bullish.
Upcoming: U.S. PCE (Feb 28)—hot data could lift USD/EUR, pressuring XAU/EUR; soft data boosts gold—mixed.
Impact: Bullish short-term, PCE reaction pivotal.
╰┈➤Next Trend Move
Technical: Support 2,686-2,650, resistance 2,750-2,800. Below 2,686 targets 2,600; above 2,750 aims for 2,850.
Short-Term (1-2 Weeks): Dip to 2,650 if PCE strengthens USD/EUR; up to 2,800 if risk-off persists.
Medium-Term (1-3 Months): Range 2,600-2,900, driven by tariffs/inflation.
╰┈➤Future Prediction
Bullish: 2,850-2,900 by Q2 2025 if EUR weakens further (EUR/USD to 1.03), tariffs escalate, or PCE softens.
Bearish: 2,600-2,550 if PCE boosts USD/EUR (DXY to 107) or risk-on emerges.
Prediction: Mildly bearish short-term to 2,650, then bullish to 2,850 by mid-2025
╰┈➤Overall Summary Outlook
XAU/EUR at 2,700.00 benefits from bullish drivers (global inflation, geopolitics, EUR weakness) but faces short-term risks from USD/EUR strength (PCE). COT and sentiment suggest consolidation, with quant signals favoring upside if support holds. Short-term dip to 2,650 possible, medium-term rise to 2,900 likely with risk-off momentum.
📌Keep in mind that these factors can change rapidly, and it's essential to stay up-to-date with market developments and adjust your analysis accordingly.
⚠️Trading Alert : News Releases and Position Management 📰 🗞️ 🚫🚏
As a reminder, news releases can have a significant impact on market prices and volatility. To minimize potential losses and protect your running positions,
we recommend the following:
Avoid taking new trades during news releases
Use trailing stop-loss orders to protect your running positions and lock in profits
💖Supporting our robbery plan 💥Hit the Boost Button💥 will enable us to effortlessly make and steal money 💰💵. Boost the strength of our robbery team. Every day in this market make money with ease by using the Thief Trading Style.🏆💪🤝❤️🎉🚀
I'll see you soon with another heist plan, so stay tuned 🤑🐱👤🤗🤩

XAU/USD "The Gold vs U.S Dollar" Metal Market Heist Plan🌟Hi! Hola! Ola! Bonjour! Hallo! Marhaba!🌟
Dear Money Makers & Robbers, 🤑💰🐱👤🐱🏍
Based on 🔥Thief Trading style technical and fundamental analysis🔥, here is our master plan to heist the XAU/USD "The Gold vs U.S Dollar" Metal market. Please adhere to the strategy I've outlined in the chart, which emphasizes long entry and short entry. 🏆💸Book Profits, Be wealthy and safe trade.💪🏆🎉
Entry 📈 :
"The loot's within reach! Wait for the breakout, then grab your share - whether you're a Bullish thief or a Bearish bandit!"
Buy entry above 2960.00
Sell Entry below 2925.00
However, I recommended to place buy stop for bullish side and sell stop for bearish side.
Stop Loss 🛑:
-Thief SL placed at 2920.00 for Bullish Trade
-Thief SL placed at 2955.00 for Bearish Trade
Using the 30min period, the recent / swing low or high level.
SL is based on your risk of the trade, lot size and how many multiple orders you have to take.
Target 🎯:
-Bullish Robbers TP 3030.00 (or) Escape Before the Target
-Bearish Robbers TP 2880.00 (or) Escape Before the Target
📰🗞️Fundamental, Macro Economics, COT data, Sentimental Outlook:
XAU/USD "The Gold vs U.S Dollar" Metal market is currently experiencing a Neutral trend (there is a higher chance for Bullishness)., driven by several key factors.
⭐Fundamental Analysis
The current price of XAU/USD is 2940.00, indicating a strong bullish trend. The gold market is driven by various fundamental factors, including:
Inflation concerns: Rising inflation expectations and a potential decline in the US dollar may boost gold prices.
Interest rate policies: The US Federal Reserve's interest rate decisions may impact gold prices.
Global economic uncertainty: Ongoing trade tensions, Brexit uncertainty, and geopolitical risks may drive safe-haven demand for gold.
⭐Macro Economics
The global economic outlook is uncertain, with:
Recession concerns: Weak economic data and trade tensions have raised concerns about a potential global recession.
Central bank rate hikes: The US Federal Reserve and other central banks may continue to raise interest rates, impacting currency markets.
Inflation expectations: Rising inflation expectations may boost gold prices.
⭐COT Data
Commercial Traders: Net short 143,000 contracts (a decrease of 11,000 contracts from the previous week)
Non-Commercial Traders: Net long 104,000 contracts (an increase of 8,000 contracts from the previous week)
Non-Reportable Positions: Net long 39,000 contracts (an increase of 3,000 contracts from the previous week)
Open Interest: 544,000 contracts (a decrease of 10,000 contracts from the previous week)
⭐Market Sentimental Analysis
Market sentiment for XAU/USD is:
Bullish: 62% of investors expect gold prices to rise, driven by inflation concerns and global economic uncertainty.
Bearish: 21% of investors expect gold prices to fall, driven by potential US dollar strength and interest rate hikes.
Neutral: 17% of investors remain neutral, awaiting further market developments.
⭐Intermarket Analysis
The XAU/USD pair is highly correlated with:
USD Index: A weaker US dollar may boost gold prices.
10-Year Treasury Yield: Lower yields may increase demand for gold.
S&P 500: A decline in the S&P 500 may drive safe-haven demand for gold.
⭐News and Events
Upcoming events that may impact the XAU/USD pair include:
US Federal Reserve Interest Rate Decision: March 15, 2025
US GDP Growth Rate: March 25, 2025
US Inflation Rate: March 29, 2025
⭐Seasonality
Gold prices tend to be:
Stronger during the winter months: Due to increased demand for jewelry and coins.
Weaker during the summer months: Due to decreased demand for jewelry and coins.
⭐Positioning Analysis
Traders are advised to:
Consider long-term investments: As gold prices are expected to rise due to inflation concerns and global economic uncertainty.
Monitor market volatility: As interest rate hikes and US dollar strength may impact gold prices.
Diversify portfolios: By investing in other assets, such as currencies, stocks, or bonds.
⭐Next Trend Move
The XAU/USD pair may experience a:
Bullish move: Driven by inflation concerns and the US Federal Reserve's potential interest rate hikes.
Bearish move: If the US dollar strengthens or global economic uncertainty increases.
⭐Overall Summary Outlook
The XAU/USD pair is expected to experience volatility due to:
Global economic uncertainty: Ongoing trade tensions, Brexit uncertainty, and geopolitical risks.
Inflation concerns: Rising inflation expectations and a potential decline in the US dollar.
Central bank rate hikes: The US Federal Reserve and other central banks may continue to raise interest rates.
⚠️Trading Alert : News Releases and Position Management 📰 🗞️ 🚫🚏
As a reminder, news releases can have a significant impact on market prices and volatility. To minimize potential losses and protect your running positions,
we recommend the following:
Avoid taking new trades during news releases
Use trailing stop-loss orders to protect your running positions and lock in profits
💖Supporting our robbery plan will enable us to effortlessly make and steal money 💰💵 Tell your friends, Colleagues and family to follow, like, and share. Boost the strength of our robbery team. Every day in this market make money with ease by using the Thief Trading Style.🏆💪🤝❤️🎉🚀
I'll see you soon with another heist plan, so stay tuned 🤑🐱👤🤗🤩

Gold Surges Past $3,000 Amid Trump, Economic FearsThe glint of gold has intensified, piercing the $3,000 per ounce threshold, a symbolic milestone that echoes through centuries of economic and political upheaval.1 This surge, fueled by a potent cocktail of market anxieties and, notably, the amplified rhetoric of a potential Trump return, underscores gold's enduring role as a safe-haven asset and a barometer of global uncertainty.2 The psychological significance of breaching this key level cannot be overstated, solidifying gold's position as a timeless store of value in an increasingly volatile world.
The current rally, while rooted in broader economic anxieties, has received a significant jolt from the political landscape. The prospect of a second Trump presidency has injected a fresh wave of uncertainty into markets. His often-unconventional policy pronouncements, coupled with the potential for trade disputes and geopolitical tensions, have created a climate ripe for gold's ascent. Investors, seeking to mitigate potential risks, are flocking to the precious metal, driving its price to unprecedented heights.3
Beyond the political sphere, persistent economic concerns are also playing a crucial role. Inflation, despite recent efforts to tame it, remains a lurking threat. Global debt levels continue to climb, and concerns about a potential recession linger. These factors, combined with the inherent instability of fiat currencies, have bolstered gold's appeal as a hedge against economic turbulence.4 Gold, unlike paper money, cannot be printed at will, offering a sense of stability in an uncertain financial landscape.5
Furthermore, geopolitical instability is a perennial driver of gold prices. Ongoing conflicts, simmering tensions between major powers, and the ever-present threat of terrorism contribute to a sense of unease that pushes investors towards safe-haven assets. The perception of gold as a reliable store of value during times of crisis has been reinforced throughout history, and the current global climate is no exception.
The $3,000 milestone also serves as a potent reminder of gold's role as a gauge of fear in the markets.6 When investors are anxious, they tend to seek out safe havens, and gold has consistently proven to be a popular choice. The current surge in gold prices reflects a growing sense of unease about the future, both economically and politically.7 This fear, whether justified or not, is a powerful force driving market behavior.
The technical aspects of the gold market are also contributing to the rally. The break above $3,000 has triggered a wave of buying, as traders and investors seek to capitalize on the momentum. This technical breakout could lead to further gains in the short term, as the market tests new highs. The sheer psychological importance of the $3,000 level also draws in investors who were previously hesitant to participate.
However, it is crucial to recognize that gold prices are not immune to volatility. While the long-term outlook for gold remains positive, short-term fluctuations are inevitable.8 Factors such as changes in interest rates, shifts in investor sentiment, and unexpected geopolitical events can all impact gold prices.9 Investors considering gold as part of their portfolio should be prepared for potential price swings.
The current rally also raises questions about the long-term sustainability of these high prices. While gold's fundamental drivers remain strong, it is important to consider the potential for a correction. Historically, periods of rapid price appreciation have often been followed by periods of consolidation or decline. However, the unique confluence of factors currently supporting gold prices suggests that the rally may have further room to run.
In conclusion, the breach of the $3,000 per ounce mark is a significant milestone for gold, reflecting a confluence of economic, political, and psychological factors. The potential return of Trump, coupled with persistent economic anxieties and geopolitical instability, has created a perfect storm for gold's ascent. This surge underscores gold's enduring role as a safe-haven asset and a gauge of fear in the markets.10 While the future remains uncertain, gold's historical performance suggests that it will continue to play a crucial role in investor portfolios, offering a sense of stability in an increasingly turbulent world. The breaking of such a psychological barrier will also inevitably drive more speculative investment, and thus, drive the market further, at least in the short term. Investors should continue to monitor the global landscape and adjust their strategies accordingly, while recognizing the inherent volatility of the precious metals market. The allure of gold, however, remains strong, a testament to its enduring appeal as a timeless store of value.

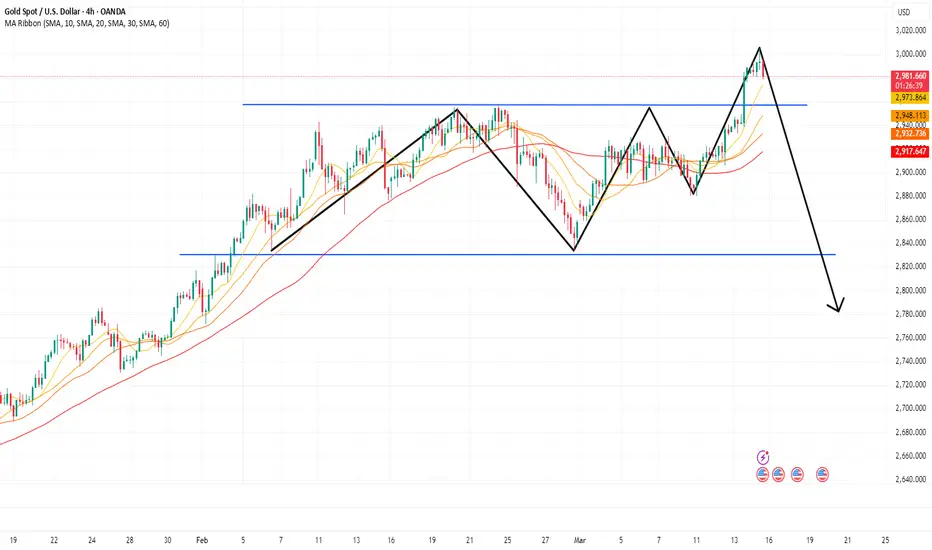
Gold is on a relentless hunt for the $2,720 levelGold is on a relentless hunt for the $2,720 level, navigating through a well-defined ascending channel where the upper boundary has acted as long-term resistance and the lower boundary as dynamic support. The price has respected this structure, with multiple touches reinforcing its integrity. However, a recent double top near the upper boundary signals potential bullish exhaustion, increasing the probability of a downside move. If the price remains below this key level, further declines are likely, with $2,720 emerging as a crucial support zone—aligned with the golden pocket on the Fibonacci retracement, making it a prime area for a reaction.
The Alternative Scenario: The New Economy's Bullish Case
Despite the bearish structure, gold in the new economy presents an alternative bullish outlook. A smaller bullish channel has formed between $2,789 and $2,855, suggesting that buyers are still in control within this range. If this mini uptrend holds, it could fuel another breakout attempt above recent highs, invalidating the bearish scenario and positioning gold for a renewed push toward higher levels.
For now, gold is at a crossroads, with $2,720 as the primary target on the downside—but if buyers defend this level or sustain the new bullish channel, the uptrend may persist in the evolving economic landscape.

Unlock self-rescue guide hereNotice! The gold market has suddenly changed! Gold, which had been rising all the way, has now shown a peak signal, and a decline has become inevitable.
The current big Yinxian is falling straight, and the market is completely shrouded in a bearish atmosphere. From a technical perspective, the evening star pattern is significant, which is often a strong signal of trend reversal. At the same time, the gold price deviates seriously from the moving average. This deviation is difficult to maintain in the market for a long time, and returning to rationality is an observable rule.
Looking at the four-hour line again, the big Yinxian entity strongly engulfs the Yangxian, directly breaking through the support line, forming an extremely strong bearish engulfing pattern, which means that the space below has been opened, and a plunge may be just around the corner. Are you ready to meet this storm in the gold market? Opportunities always coexist with risks, and now is the time to test investors' decisiveness.
You can read bottom signals, interpret daily market trends, share real-time strategies, and no longer blindly follow the trend.
Gold weekly chart with both buy and sell levels See latest update on Gold for the coming week.
For a buy am looking at entering at 2914 expecting 2920 as first resistance.
For a sell ill look at entering at 2904 and expecting a move to 2889 as firat resistance.
Short idea this week as have other commitments but ill update when i get a chance in the coming week.

Golden milestone moment, about to fall!Gold hit a new all-time high on Friday, reaching the psychologically critical $3,000 mark, with the precious metal up nearly 15% since the start of the year, fueled by trade war fears and expectations of a rate cut by the Federal Reserve. Trump's tariffs have been a key driver of safe-haven buying in gold. The global trade war has roiled financial markets, sparking recession fears, and Trump threatened on Thursday to impose a 200% tariff on imported alcohol from Europe, a trade war that is escalating. But in the short term, there is absolutely no reason to chase gold higher. Reaching $3,000 today is clearly a long position in the market to pull up shipments. What happens when the longs are exhausted? That could usher in a wave of retracements, so don't chase the highs now. Gold is about to plunge.
You can read bottom signals, interpret daily market trends, share real-time strategies, and no longer blindly follow the trend.

Gold is about to fall, maybe even plummet!In the morning, gold rose above 2990 as expected and then fell back, but it stopped falling again at 2980 in the European session and rose again. The current market is rising again to test above 3000. From the current hourly chart, the pressure of 3005 is obvious. Today is the last trading day of this week. It is still optimistic about the decline in the evening, and even more optimistic about the plunge!!!
You can read bottom signals, interpret daily market trends, share real-time strategies, and no longer blindly follow the trend.

3.14 Gold breaks through historical high to 3000Yesterday, the gold market continued the risk-averse rally and broke through the historical high. After opening at 2933.4 in the morning, the market first rose to 2947.4 and then fell back. The daily line reached a low of 2932.4 and then rose strongly. After breaking through the previous historical high of 2957 during the US trading session, the market accelerated upward. The daily line reached a high of 2989.3 and then the market consolidated. The daily line finally closed at 2988.8 and the market closed with a basically saturated big positive line. After this pattern ended, the weekly line completed the N-shaped break. Today's market reached the 3000 mark and quickly pulled back to 2988 and then came to 2997.
Short-term recommended operations:
Resistance level: 3000 3010 3020
Support level: 2995 2985 2970

Gold Price Analysis March 13⭐️Fundamental Analysis
Gold prices maintained a positive trend in early European trading on Thursday and remained near the all-time high reached on February 24. The chaotic implementation of US President Donald Trump's trade tariffs and their impact on the global economy continued to drive safe-haven flows into bullion for the third consecutive day.
Meanwhile, fears of a US recession, coupled with signs of a cooling labour market and falling inflation, will allow the Federal Reserve (Fed) to resume its rate-cutting cycle sooner than expected. This, in turn, kept the US dollar (USD) near its lowest level since October 16 touched on Friday and turned out to be another factor supporting non-yielding gold prices.
⭐️Technical Analysis
Gold is correcting to the immediate support zone of 2930 if the support zone is broken 2922 is the next support point before gold price moves to 2910. The resistance zone of 2950 is considered as a barrier before reaching ATH and the daily sell plan is noticed around 2970

xauusd 30m chart analysis the breackout of resistance.Hello traders
trust on my analysis
here the breackout occure and the gold is on the moon .
As i mentioned if breackout of resistance here the the gold will move upword so watch the gold is flowting there
500+pips profit done .

USD/JPY 30m chart analysis target achived successfully.usdjpy entry at 148.200
target achived successfully at 147.55.
70+pips profit booked

Be wary of black swans appearing on Friday!On Thursday, gold continued to rise in the US market. Driven by the uncertainty of tariff policies and the expectation of interest rate cuts by the Federal Reserve, the safe-haven appeal of gold remains undiminished. As of press time, the highest gold price has reached near 2985. After the CPI on Wednesday, gold seemed to have activated the rising button, and it started to rise all the way from the CPI low of 2905. After the initial jobless claims today, it hit a new record high again.
You can see that I have already drawn the 4-hour top range here
I think the top of 2990 is almost a potential top position, and tomorrow is Black Friday. Why did gold dare to go up so quickly on Thursday? There is only one reason, then there may be a big move tomorrow, Friday. It is very likely that in the early morning or tomorrow Friday morning, a wave of suppression near 2990 will be tested, and then the possibility of a rapid retracement will appear.
Therefore, I definitely do not recommend that you chase more in the future, there is no doubt about this. On the contrary, there are many people chasing more in the market at present. Seeing that gold has risen so much, they must think of retreating and going long. Therefore, tomorrow Friday, I suggest that you pay attention to the area around 2990. As long as this position can show a top structure signal in the Asian session, then don't hesitate to go short directly. Without saying too much, the first target can be seen at 2940-2930, or even 2920-2910.
You can read bottom signals, interpret daily market trends, and share real-time strategies, so you no longer blindly follow the trend.

Gold accelerates to the top! The plunge alarm has soundedThe gold market has reached a critical point! Driven by the strong risk aversion sentiment, the price of gold has soared all the way, quickly breaking through many resistances and accelerating to the vicinity of 2985. However, if you look closely at the K-line chart, you will find that this round of rise is mainly stimulated by news, and there is strong resistance in the vicinity of 2985. Fortunately, we have already made arrangements. We have set the number of transactions reasonably before shorting. The current margin level is sufficient to support us in dealing with the current situation. At this time, it is a good time to increase positions. We can boldly increase positions and short in the 2977-2983 area, appropriately increase the number of transactions, lower the average price, and wait for gold to fall back to the 2940-2930 area. All positions will be decisively closed to achieve a turnaround, secure the bag, and lock in profits.
You can read bottom signals, interpret daily market trends, and share real-time strategies, so you no longer blindly follow the trend.
GOLD VIEW 3H READ THE CAPTAINHello 👋 gold traders
3-hour timeframe of Gold Spot (XAU/USD) with technical analysis levels and moving averages. Here’s a breakdown of the key points:
Key Observations:
1. Support & Resistance Levels:
Support Level: Around 2,909.870 - 2,902.340 (marked as the buying zone).
Resistance Level: 2,930.173.
Target Point: 2,960.607.
2. Exponential Moving Averages (EMAs):
30 EMA (Red Line): 2,909.870 (Short-term trend).
200 EMA (Blue Line): 2,884.578 (Long-term trend, acting as strong support).
3. Price Action:
The price is currently in a consolidation phase around the resistance zone.
If the price breaks above 2,930, we might see a bullish move toward the target at 2,960.
If the price fails to break resistance, a pullback to the buying zone (support level at 2,909-2,902) is possible.
Trading Strategy Ideas:
Bullish Scenario (Breakout Above 2,930): Look for long positions targeting 2,960.
Bearish Scenario (Rejection at Resistance): A retest of the buying zone (2,909 - 2,902) before another push higher.

GOLD(UPDATE)Hello friends
Considering that we are at a price ceiling and the power of buyers has decreased and we are witnessing the formation of lower ceilings, we can enter a sell transaction if the resistance level is not broken, of course with capital and risk management.
This analysis is reviewed only from a technical perspective.
*Trade safely with us*

Gold Upward Trend Continues with $2975 Target in SightThe gold market is currently experiencing a bullish trend, and technical indicators suggest that this momentum is likely to continue. Based on the 4-hour chart analysis, gold is approaching a new high, with the next key price target set at $2975.
Technical Analysis & Market Outlook
Price Trend & Momentum
Gold prices are on an upward trajectory, indicating strong bullish sentiment.
The market is showing a consistent push toward higher price levels.
Fibonacci Retracement Signals Bullish Continuation
The Fibonacci 0.5 retracement level has been successfully completed.
This technical confirmation suggests that the correction phase has ended, and the price is likely to continue its upward movement.
Key Resistance & Support Levels
The next major resistance level is at $2975, which serves as a potential price target.
On the downside, if the market faces any pullback, previous support zones $2878 will play a crucial role in stabilizing the price.
Market Expectations
Given the technical setup, gold is expected to maintain its bullish momentum in the short term. Traders and investors should monitor key resistance levels, while also keeping an eye on macroeconomic factors such as inflation data, interest rates, and geopolitical developments, which can influence gold prices further.
In conclusion, with the Fibonacci retracement completed and the market pushing toward new highs, gold is well-positioned to reach $2975 in the coming sessions

All units pay attention to gold 2975 directly short 2800 seePrepare for a sharp drop
Gold is ready to plummet, and the notification has been in place. The current price in the 2970-2975 area is short, and it is ready for a sharp drop. This sharp drop will be below 2800. I have told you in advance
The crazier gold is, the more it will plummet. The whole network is bullish. What are the dealers doing? It must be an unconventional trend. Enter the market at a short speed
You can read bottom signals, interpret daily market trends, and share real-time strategies, so you no longer blindly follow the trend.

Gold is about to fall, and the secret behind itFrom the hourly chart, the gold price rose rapidly from 2932 to 2946 in the morning, showing the strong power of the bulls. But in the afternoon, the situation suddenly changed, and the price quickly fell back from 2946 to 2932, and the bulls and bears played fiercely. In the European session, gold once again exerted its strength and climbed from 2932 to 2948. Combining the characteristics of the Asian and European sessions, it is not difficult to find that gold has a tendency to go back and forth in a certain range again. Looking back at the rebound from 2880 to 2948, it is very similar to the trend of the early March. That is, after a wave of short-term continuous positive pull-ups, it will enter a box-shaped oscillation state and last for several hours, and then start a short-term continuous positive pull-up again, and then fall into a box-shaped oscillation cycle again. The pressure formed by the upper rail of the channel 2951-53 line. If the gold price is under pressure here, there is a high probability that it will fall back repeatedly, and the target area is 2930-2920. Even reaching the 2910 area.
You can read bottom signals, interpret daily market trends, and share real-time strategies, so you no longer blindly follow the trend.

XAU/USD Chart"Do you think gold can give us a profit before it closes its weekly candle, reaching from the current price of 2958?"
"Do you think gold can give us a profit before it closes its weekly candle, reaching from the current price of 2958? And if you were in this trade, where would you set your take profit and stop loss?"
