Can we get a leg lower on XAUUSD?Hi fellow traders, XAUUSD will be ready to make a move lower from the golden pocket within the blue box after completing the correction. Target the 3195.03 level. Good luck and trade safe!
Goldsell

GOLD Technical Analysis - Deeper Pullback in PlayOANDA:XAUUSD remains within a broader ascending channel, but recent price action suggests that the market is undergoing a deeper corrective phase. Following a prolonged bullish rally, price appears overextended and is now pulling back more decisively.
This correction aligns with expectations for a healthy retracement after such strong upward momentum. I anticipate that the pullback will extend further toward the $3,160 level, a key technical level defined by the confluence of horizontal support, ascending trendline support, and the 0.618 Fibonacci retracement of the latest bullish impulse.
This zone will be critical for determining whether the broader bullish structure remains intact. If price holds at this level and shows signs of reversal, it may present a strong re-entry opportunity for buyers. However, a decisive break below this zone would invalidate the current bullish structure and open the door to a deeper correction.
Always confirm your setups and trade with a proper risk management.
Best of luck!

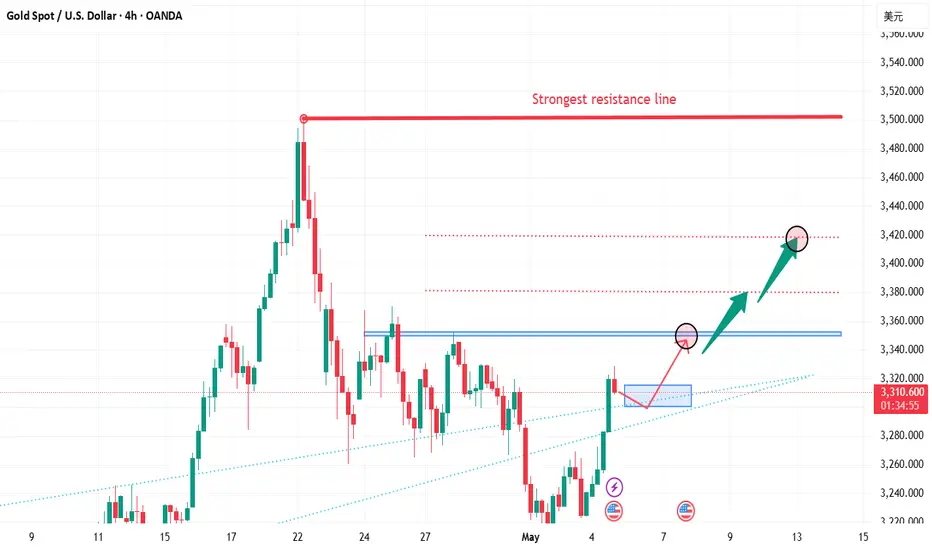
XAU/USD technical outlook: Gold price poised to challenge $3,350Gold price uptrend resumed as today’s price action confirmed a ‘bullish harami’ two-candle chart pattern, indicating that bulls are gathering steam. The Relative Strength Index (RSI) further confirmed the latter, as the RSI’s line aims upwards.
Therefore, traders will face key resistance levels like $3,350, followed by the $3,400 figure. If surpassed, the next stop would be $3,450 and $3,500. Conversely, if sellers drag XAU/USD spot price below $3,300, look for a test of the May 1 low of $3,202, ahead of the April 3 high turned support at $3,167.

Gold is in line with the uptrend
After yesterday's sharp rise from 3238, spot gold continued to climb in the Asian market on Tuesday. The price of gold has now broken through the highest level of 3386 US dollars per ounce, and the daily increase is nearly 28 US dollars. At present, the price of gold remains close to the new record, and the rise is far from over. The global trade war has caused market concerns and continued to push the price of gold to new highs. Gold has become an asset for a new round of investment boom!
The market boom is coming, and the gold bulls are coming?
Banking giant Goldman Sachs released a bullish forecast report on gold, saying that if a recession becomes a reality, the gold price target will reach 3880 US dollars per ounce by the end of 2025. The forecast is based on the expectation that concerns about a recession will accelerate the inflow of funds into gold exchange-traded funds (ETFs), thereby pushing up gold prices.
In addition, Goldman Sachs warned that if the Federal Reserve loses its independence, the price of gold may soar to 4500 US dollars per ounce.
What do you think of today's gold trend!
Looking back at the current gold and silver, from the market point of view, the gold price trend has been stabilizing above the middle track, and the cycle bulls continue to line up. From the indicator point of view, the middle track has been hooking upward, and there is still room for an upward rebound in the short term. In addition, gold started from 3322 last week, and directly rose from 3322 to 3387. Now it is around 3367. So there is a point to pay attention to today, that is, the position of the middle track of 3334. It is still difficult to say whether it can be stepped back.
Don't expect a deep callback. The only difference between the oscillating market and the unilateral market is that the oscillation will come back, while the unilateral market will not. This is why we always emphasize the need to bring a good stop loss. In terms of the cycle rhythm, we have been participating in the cycle of time and space last week. At present, we can still participate in this pattern. There is one opportunity in the European and US markets. We will start at this time point during the day!
Gold: More near 3350, defend 40, and target the resistance of 3385-90! If it breaks below, wait for the two support levels of 3334-20 before considering!

It’s the right time to short📌Fundamentals:
This week, the Federal Reserve will hold a rate decision, which is expected to dominate the market this week. In addition, we need to continue to pay attention to news related to the international trade situation.
📊Technical aspects:
The 1-hour moving average begins to turn, so the unilateral decline of gold has temporarily come to an end. However, the rise of gold has reached the key resistance area in the early stage, which is the starting point of the early stage of 3330. It is obviously not appropriate to chase more at this position, so the short-term may begin to adjust, and gold will go short at 3325 first. The market is changing rapidly. If gold breaks upward without stepping back, there will be no opportunity to go long. Then there is no need to chase more gold. Go short first and look at the decline and adjustment. On the whole, the short-term operation strategy of gold today is to go short on rebounds and go long on pullbacks. The short-term focus on the upper resistance of 3328-3330, and the support on the lower side is 3280-3293.
🎯Practical strategy:
Short gold when it rebounds to around 3325-3328, target around 3300-3280.
Buy gold when it falls back to 3280-3295, target around 3325-30.

Trade Plan – MGC (Micro Gold Futures) | Sunday, May 4Trend Bias (Multi-Timeframe Analysis):
• 1W: Bullish – Strong macro uptrend with pullback off all-time highs.
• 1D: Bearish – Lower highs and lower lows forming after topping out at $3,509.
• 4H: Bearish – Clean downtrend continuation forming.
• 1H: Bearish – Price rejected lower highs, now curling down again.
• 15M: Bullish – Short-term bounce from $3,210 low, but corrective in nature.
Trade Setup:
• Direction: Short
• Entry Zone: $3,250 – $3,260
• Price has retraced to a lower-high zone under supply; aligns with hourly resistance.
• Stop Loss: $3,270
• Just above 1H structure and 15M failed high.
• Take Profit: $3,210
• Prior swing low and liquidity zone.

GOLD NEXT MOVE NEXT WEEK GOLD BIG DOWN GOLD SELL NOW 3230- LIMIT 3240=3250 FIRST TARGET 3200 NEXT TARGET 3180 LONG TARGET 3150 Counter-Analysis to the Bearish Bias
1. Volume Analysis Suggests Demand at Lows
The highlighted "Strong Support" zone around 3,156 shows high buying volume—evidenced by the tall green bars on the volume histogram.
This may indicate accumulation, not preparation for breakdown, contrary to the red arrows implying a strong downward continuation.
2. Oversold Market Conditions
Given the repeated tests of lower support zones without major follow-through, there's a risk of bearish exhaustion.
A reversal pattern (e.g., double bottom or inverse head and shoulders) could form near 3,215 or 3,187.
3. Failed Breakdown Possibility
Price rebounded sharply from the support zone below 3,220, which could be interpreted as a bear trap.
If price closes above the 3,248 resistance level, the market may target the 3,294 and even higher levels, invalidating the bearish roadmap.
4. Ignored Higher Timeframe Context
This chart is on a 1H timeframe, but without a higher timeframe reference (e.g., 4H or Daily), the bias may be misleading.
If the daily chart is bullish or consolidating, this 1H downtrend could just be a retracement.
5. No Confirmation of Breakdown Yet
None of the major support levels (e.g., 3,215 or 3,187) have been broken with high volume and strong candles.
Until a confirmed lower low below 3,156 is printed, this remains a range or consolidation, not a breakdown.
Alternative Bullish Scenario
If price holds above 3,215 and breaks 3,248 with volume, the next target could be:
3,293 (Resistance)
Possibly 3,320 and above (double top region

XAU/EUR "The Gold" Metal Market Heist Plan (Day Trade)🌟Hi! Hola! Ola! Bonjour! Hallo! Marhaba!🌟
Dear Money Makers & Robbers, 🤑💰✈️
Based on 🔥Thief Trading style technical and fundamental analysis🔥, here is our master plan to heist the XAU/EUR "The Gold" Metal Market. Please adhere to the strategy I've outlined in the chart, which emphasizes short entry. Our aim is the high-risk YELLOW MA Zone. Risky level, oversold market, consolidation, trend reversal, trap at the level where traders and bullish robbers are stronger. 🏆💸"Take profit and treat yourself, traders. You deserve it!💪🏆🎉
Entry 📈 : "The vault is wide open! Swipe the Bearish loot at any price - the heist is on!
however I advise to Place sell limit orders within a 15 or 30 minute timeframe most nearest or swing, low or high level for Pullback Entries.
Stop Loss 🛑:
📌Thief SL placed at the nearest/swing High or Low level Using the 1H timeframe (2950) Day/Swing trade basis.
📌SL is based on your risk of the trade, lot size and how many multiple orders you have to take.
Target 🎯: 2810 (or) Escape Before the Target
💰💵💸XAU/EUR "The Gold" Metal Market Heist Plan (Scalping/Day Trade) is currently experiencing a Bearish trend.., driven by several key factors.👇👇👇
⚠️Trading Alert : News Releases and Position Management 📰 🗞️ 🚫🚏
As a reminder, news releases can have a significant impact on market prices and volatility. To minimize potential losses and protect your running positions,
we recommend the following:
Avoid taking new trades during news releases
Use trailing stop-loss orders to protect your running positions and lock in profits
💖Supporting our robbery plan 💥Hit the Boost Button💥 will enable us to effortlessly make and steal money 💰💵. Boost the strength of our robbery team. Every day in this market make money with ease by using the Thief Trading Style.🏆💪🤝❤️🎉🚀
I'll see you soon with another heist plan, so stay tuned 🤑🐱👤🤗🤩

Although the bulls are strong, don't chase them at high levels📌Fundamentals:
The market is still focused on Trump's tariffs, followed by geopolitical situations, such as the India-Pakistan conflict, the Israeli-Palestinian ceasefire, and the Russia-Ukraine negotiations.
📊Technical aspects:
From the 4-hour analysis, the upper pressure is around 3336-3345, and the lower support is around 3280-3293. Continue to rely on this range to maintain the main tone of high-altitude low-multiple cycles. In the middle position, watch more and move less, be cautious in chasing orders, and wait patiently for key points to enter the market.
🎯Practical strategy:
1. Short gold rebounds at 3336-45, with a target of 3280-3295.
2. Go long gold at 3280-3295, with a target of 3325-30.

Gold rises as a safe haven, how to plan the market outlook
📌 Gold Drivers
Gold prices rose more than 2% on Monday, benefiting from a weaker dollar and safe-haven inflows as U.S. President Donald Trump's new tariffs reignited concerns about the impact of a global trade war. Spot gold rose by more than 2.3%, US gold futures rose by 2.4%, and the US dollar index fell by 0.4%. On Sunday, Trump wrote on his social platform Truth Social: "I authorize the Department of Commerce and the United States Trade Representative to immediately initiate procedures to impose a 100% tariff on all films produced abroad entering the United States. We want to make movies in the United States again!" But he did not specify how these tariffs will be implemented.
📊Comment analysis
Gold prices continue to accumulate and have broken through 3330 points. It can be found that gold is now completely above the trend line.
💰Strategy package
The only suppression position above is currently around 3350.
The support below is currently at 3275-85.
If gold does not retreat, then the upper side will directly test the suppression near 3350.
On the contrary, if gold chooses to retreat next, then pay attention to 3275-85.
As long as gold retreats and stabilizes in the 3275-85 range, you can directly enter the market to do more.
Continue to look at 3350 above. If it breaks through and stabilizes above 3350 in the future, you will see the 3380-3420 range.
⭐️ Note: Labaron hopes that traders can properly manage their funds
- Choose the number of lots that matches your funds
- Profit is 4-7% of the fund account
- Stop loss is 1-3% of the fund account
Gold bulls are back in force. What is the operation strategy?The gold price has reached the sideways fluctuation range expected by Quid. This matches my morning prediction.
From the 4-hour trend:
Gold has now broken through the first upward resistance level predicted by Quid, and is currently fluctuating slightly in the 3315-3320 range.
The current upward resistance position is around 3330. The lower support is currently located at 3275-85. If gold does not retreat, then the upward trend may test the position around 3350.
On the contrary, if gold chooses to retreat, traders need to pay attention to the 3275-3285 decline range.
Quid believes that as long as gold retreats and stabilizes in the 3275-3285 range, then a long operation strategy can be carried out at this position.
The current upper high is still at 3350. If the upward resistance level of 3350 is broken later, I expect the price of gold to reach a height of 3380-3420.

Continue to short gold when it rebounds to a high level
The 1-hour moving average of gold continues to form a downward short position, and there is still room for gold shorts. Gold came under pressure at the 3270 line last week and fell back. Currently, the 1-hour gold is still fluctuating within a range. It is still mainly short above the rebound of gold.
Trading ideas: Short gold near 3270, stop loss 3280, target 3240

what is fair value gap ? what is fair value gap ?
-This Analysis is based on educational purposes using the concepts of Smart Money and Liquidity Sweep area
- We create two fair Value gaps in which market will act on that
first one is between 3247 to 3260 area expecting move down from that point and touched 3192 to 3165 which is a strong liquidity zone

SELLGold is charging from a bullish perspective to bearish, and on H4 we can see bearish break of structure and a retracement but also a shift of structure to the down side and am expecting more sell side pressure for the coming week with my entry price set to be activated through Liquidity Engineering.

The latest gold strategy analysis and operation guidance📌Fundamentals:
This week, the US economic data was released intensively, and ADP employment, unemployment benefits, GDP and PCE price index were all bullish, but some data showed signs of weakness after Trump's tariff policy. The unemployment rate remained the same as the previous value of 4.2%, while the expected new employment of 130,000 was significantly lower than the previous value of 228,000. The market's concerns about the cooling of the economy provided support for the gold price.
📊Technical side:
Although the 1-hour moving average is still in a dead cross short arrangement, there are signs of turning around. At the same time, after the rebound, gold began to consolidate at a high level instead of continuing to fall, so the momentum of the bears was weakened. So today's closing is critical. Today, gold fell back to around 3230 under pressure from 3270. In the short term, this is a balance range. You can see the shock in this range at night. If gold finally closes above 3270, then gold will most likely continue to rise next week. If it closes below 3240, then gold bears still have a great chance. If you want to operate in the short term, then don't chase it for the time being. Since it is a shock, you can go short first at a high level. If it breaks through 3270, then wait until next week. On the whole, today's short-term operation of gold suggests that the rebound is mainly short, and the callback is supplemented by long. The top short-term focus is on the first-line resistance of 3265-3270, and the bottom short-term focus is on the first-line support of 3200-3197.
🎯Practical strategies:
Strategy 1: Go short when gold rebounds around 3263-3266, with a target around 3230-3210.
Strategy 2: Go long when gold pulls back around 3197-3200, with a target around 3220-3230.

Gold trend layout in the evening after the release of NFP data🗞News side:
1. Pay attention to the recent trade situation and news about the Fed's interest rate cuts
2. Be wary of DXY trends
3. The situation of the Russian-Ukrainian war and the follow-up events of the India-Pakistan conflict
📈Technical aspects:
The short orders in hand have already been profitable, and gold is now back near 3250, while the US dollar index has once again fallen by 100, reaching around 99.6, and the 1H moving average is currently showing signs of turning upward. The upper and lower shadow lines of the 1H K-line closing look like cross stars of equal length, which means that things may go wrong, and gold may rebound upwards in the short term. We can still focus on the resistance of 3260-3270 above, and further focus on the first-line resistance of 3280-3286, while the bottom has never been able to effectively break through the first-line support of 3240. If this week closes at 3240, then the market outlook next week will be conducive to long trading.
Intraday operation suggestions
🎁SELL 3260-3270
🎁TP 3245-3240
🎁BUY 3230-3240
🎁TP 3260-3270
If you agree with this point of view, or you have a better idea, please leave a message in the comment area. I look forward to hearing different voices.
OANDA:XAUUSD FX:XAUUSD FXOPEN:XAUUSD FOREXCOM:XAUUSD TVC:GOLD
Non-agriculture ended perfectly, Today’s closing is key!📌Fundamentals:
The US April non-farm payrolls data (177,000 new jobs) exceeded expectations, reinforcing the Fed's expectations of a smaller rate cut. The market's expectations for rate cuts this year have been lowered from 90 basis points to 85 basis points, and the strengthening of the US dollar has suppressed gold prices.
📊Technical aspects:
From the 4-hour analysis, gold fell after the negative news of non-farm payrolls today, but gold bottomed out and rebounded, and continued to fluctuate. It feels that non-farm payrolls have gradually lost its charm, and the market is not as good as usual. However, today's closing is very critical, and it is also the key to whether gold will turn around. The non-farm payrolls market has basically finished, and the upper side continues to pay attention to the suppression of 3260-68, focusing on the suppression of 3290-95 above, and the short-term support near 3235-3240 below.
🎯Practical strategies:
1. Go short when gold rebounds at 3260-65, cover short positions at 3378-85, and target 3240-3245.

XAU/USD buy to sell outlookThis week, I’ll be monitoring potential long entries from the nearby 3H demand zone, but my primary focus will be on price retracing into the 4H supply zone around 3,300, where I’ll be watching for a sell opportunity.
This zone aligns with the current bearish momentum we've seen recently, and I’ll wait for price to slow down and show signs of distribution once it reaches this area.Once we see that slowdown, I’ll aim to refine a clean order block for entry, ensuring a clear change of character and avoiding any potential smart money traps or false moves.
Confluences for Gold Sells:
- A clean 4H supply zone has formed, which caused a break of structure to the downside.
- There's significant liquidity resting below, making further downside likely.
- Gold has been heavily overbought and saturated, which supports this correctional bearish move.
- The DXY recently reacted bullish from a strong 2-day demand zone, adding confluence for downside in gold.
- After last week’s sharp decline, a retracement is expected before further downside continuation.
P.S.: There’s also liquidity to the upside in the form of uncollected Asia highs, so don’t be surprised if price sweeps those first before tapping into our supply zone.
Let’s stay patient and smart with entries — have a great weekend, everyone!

Non-agricultural prospective data analysis Operation suggestions📌Fundamentals:
📊Technical aspects:
Technically, spot gold is in a downward trend in the short term, and there is a certain rebound or shock at the key support level. At the 4-hour level, the gold price is running above the lower track of the Bollinger Band, and the opening shows signs of contraction. The MACD indicator dead cross is gradually closing, and the RSI indicator is running in the 35-45 range, showing that the long and short forces are relatively balanced.
🎯Practical strategy:
3260-3270 light position short, target 3225-3200. When it reaches 3225-3200 and stabilizes, try to go long, target 3250-3270.

Gold potential sell setup Current market analysis reveals a potential sell zone in Gold. Key factors:
- Resistance sel llevel:(3267)
-
- Overbought conditions on the RSI
-
- Bearish divergence on the MACD
- Sell zone:------(3268)
-
- Take profit 1:( 3259 )
-
- Take profit 2: (3246)
-
- Stop loss: $ ( 3275 )
Monitor price action and adjust strategies accordingly. Trade with caution.
Good luck for this
Share your thoughts about this trading ideas 💡

Maintain shock and short position before non-agricultural📌Fundamentals:
From the news perspective: the United States released a trade agreement and tariff reduction signal, the trade situation eased, resulting in a decline in market demand for safe-haven assets, triggering a sell-off in gold; the situation between Russia and Ukraine has eased, and the dawn of peace talks is approaching, which is a negative factor for gold; at the same time, the situation between India and Pakistan has heated up, which has supported the price of gold to a certain extent.
📊Technical aspects:
In the past few days, we have been emphasizing that gold should be bearish, and warned that gold is likely to break and fall sharply.
Gold, the general trend is as described in the continuous analysis. This round of price has fallen from the historical high of 3500. The first round of selling to 3260 rebounded to repair 3370; after rebounding to 3358 during the week, it weakened again, and the Asian market quickly sold off and fell below 3260. The subsequent analysis emphasized that the short-selling pattern of each cycle is good, and the shock bearish trend continued before the non-agricultural, and the target was adjusted to the parallel attack and defense range of 3193-3168;
European and American markets fluctuated and were bearish, which is in line with expectations; short-term resistance 3221, 3226, strong resistance 3231-3235; short-term support 3212, strong support 3202;
🎯Practical strategy:
It is recommended to rebound and sell: short near 3220-3230, target 10-15 points

How to layout gold before non-agricultural data🗞News side:
1. Progress in Sino-US tariff negotiations: The United States has recently contacted China through multiple channels, releasing signals that a trade agreement may be reached. Market concerns about trade friction have significantly cooled down, weakening the safe-haven appeal of gold.
2. The U.S. non-farm payrolls report for April will be released today (expected to add 130,000 new jobs). If the data is weak, it may strengthen expectations for an interest rate cut. On the contrary, if it is stronger than expected, the interest rate cut schedule may be further delayed.
📈Technical aspects:
Gold bottomed out yesterday and has now rebounded to around 3250. For the current market situation, the previous low of 3260-3270 has become an important resistance level above the gold price after the top-to-bottom conversion. In addition, non-agricultural data will be released in the U.S. market today. Therefore, if gold wants to reverse upward, the first resistance will be in the 3260-3270 range. If the counter pull from the bottom fails to stabilize at 3270, then there will be a downward trend. If it breaks through this resistance range, it may test the 3286 line. Before the release of non-agricultural data, the European market can be shorted when encountering resistance at 3260-3270. Everyone is waiting patiently for the opportunity to enter. The following focuses on the important support of 3200.
If you agree with this point of view, or you have a better idea, please leave a message in the comment area. I look forward to hearing different voices.
Gold trading ideas after key data releaseOn the news front, the US April ISM manufacturing PMI was higher than expected, which led to the US Treasury bonds giving up their gains. From a technical analysis point of view, after the gold price fell out of the strong support of 3260 in the shock range, this position turned into the short-term resistance level for our short-term reference, followed by the position of multiple entity K-lines at the hourly level of 3275. There is a possibility of breaking through 3260 in the later period, so 3275 can also be treated as a defensive position.
Although the price of gold has been hovering around 3220, our main bearish direction remains unchanged in the short term. The trading strategy given in the afternoon is still a reference. For rebound, first focus on the 3240-3250 first-line resistance, and further look at the top-bottom transition position of 3260-3270. You can participate in transactions in small batches. Below, focus on the 3210-3200 support, and if it falls below, look for the 3193 first-line.
TVC:GOLD FOREXCOM:XAUUSD FXOPEN:XAUUSD FX:XAUUSD OANDA:XAUUSD
