Gold 1H – Will 4210 Reject Again or 4166 Ignite the Rally?🟡 XAUUSD – Intraday Smart Money Plan | by Ryan_TitanTrader (09/12)
📈 Market Context
Gold continues to soften under $4,200 as rising US Treasury yields pressure bullion, with markets positioning ahead of the upcoming Federal Reserve rate decision.
According to FXStreet, yields climbing intraday are capping gold’s upside, and sellers remain active below 4200 while participants wait for clarity on the Fed’s forward guidance.
This environment builds a liquidity-sensitive landscape, where institutions may engineer sweeps on both sides before committing to direction.
On H1, price oscillates cleanly between premium supply (4208–4210) and discount demand (4168–4166).
A valid push requires MSS → BOS → displacement from either extreme.
🔎 Technical Framework – Smart Money Structure (1H)
Current Phase: Sideways compression after consecutive CHoCH shifts
Key Idea: Expect liquidity grabs above 4210 or under 4166 before real movement
Liquidity Zones & Triggers
• 🔴 SELL GOLD 4208 – 4210 | SL 4218
• 🟢 BUY GOLD 4168 – 4166 | SL 4158
Institutional Flow Expectation:
sweep → MSS/CHoCH → BOS → displacement → FVG/OB retest → expansion
🎯 Execution Rules (matching your exact zones)
🔴 SELL GOLD 4208 – 4210 | SL 4218
Rules:
✔ Price taps premium zone (4208–4210)
✔ Bearish MSS/CHoCH confirmed on M5–M15
✔ Strong downside BOS + displacement
✔ Enter on FVG fill or refined supply OB retest
Targets:
1. 4185
2. 4175
3. 4168 – 4166
🟢 BUY GOLD 4168 – 4166 | SL 4158
Rules:
✔ Sweep under 4167 to collect sell-side liquidity
✔ Bullish MSS/CHoCH forms from discount
✔ Clean BOS + impulsive displacement upward
✔ Entry via bullish FVG fill or demand OB retest
Targets:
1. 4184
2. 4200
3. 4210
⚠️ Risk Notes
• Rising yields may generate deceptive spikes—avoid entries without BOS + displacement
• Do not chase price inside the compression range
• Keep SLs at structural invalidation, not arbitrary points
• Reduce exposure ahead of Fed-related volatility this week
📍 Summary
Today’s setup revolves around two institutional scenarios:
• A 4210 liquidity sweep triggers bearish structure → downside delivery toward 4166
or
• A 4166 liquidity grab forms bullish MSS → upside expansion back toward 4210
Let structure confirm.
Patience pays the trader—SMC reacts, never predicts. ⚡️
📌 Follow @Ryan_TitanTrader for daily Smart Money breakdowns.
Goldshort

XAUUSD delivered Excellent results [300 pips Tp]As highlighted during my TODAY'S session update:
My position & stance:
I waited for Gold to deliver a TAP of 4220 last Friday Rebound, and I identified it at the $4218 resistance test.
I executed set of sell orders at $4212 & $4205 and closed them at the $4188 & 4175 in extension.
I want to take this moment to congratulate all the traders who followed my calls and patiently held their positions. Well done — enjoy the profits, and have a wonderful Day

Gold Forecast - Trade Zones & Setup Before FOMCGold is still trading weak under the descending trendline and the price continues to reject the 4220–4230 resistance zone. As long as it stays below this area the chart suggests bearish pressure toward 4170 and possibly 4145–4130 where strong liquidity sits.
With the Fed rate decision tomorrow volatility is expected to increase so price may remain choppy within this range until the announcement. A clear bullish shift only comes if gold breaks and holds above 4225 which could reopen the path toward 4250–4260. For now structure remains bearish with lower-high formations and clean downside targets visible.
🔵 Buy Zone
- 4165–4175 → This is the main demand zone.
- Buy Trigger: A strong bullish candle / rejection wick from 4165–4170 confirms buyers stepping in.
- Upside Target: 4200 → 4220 → 4230.
🔴 Sell Zone
- 4220–4230 → Major supply + trendline resistance.
- Sell Trigger: If price retests 4220–4230 and gives rejection or bearish engulfing, downside resumes.
- Downside Target: 4170 → 4145 → 4130.
⚠️ Important Note (Fed Rates Tomorrow):
Before the announcement, gold may stay inside 4200–4170 range, so triggers will be cleaner after the news when volatility expands.
Note
Please risk management in trading is a Key so use your money accordingly. If you like the idea then please like and boost. Thank you and Good Luck!

Elise | XAUUSD – Bearish Continuation OutlookOANDA:XAUUSD
Price has reacted strongly from the LIQ PV Zone High (4,264 area), showing repeated rejection and failure to hold above 4,226 structure. A short-term range has formed near resistance, indicating absorption of buy orders and potential distribution. The break beneath the range confirms bearish intent.
Market structure remains bearish while trading below 4,226 and a move toward demand zone / liquidity sweep region is the higher-probability scenario.
Bearish Scenario (Primary Bias) 📉
If price continues sustaining below 4,226, downside continuation is expected.
🎯 Target 1 → 4,200 – 4,194
🎯 Target 2 → 4,174 (Main Demand Retest)
🎯 Final Target → 4,155 Liquidity Sweep Zone
A clean approach to the demand block may trigger buy orders later, but first expectation remains bearish until structure shifts.
⚠️ Disclaimer: This analysis is for educational purposes only, not financial advice.

Gold Big Sell-Off Ahead? Gold Showing Clear Bearish SignalsAs expected, Gold delivered a classic early-month liquidity grab, creating a false move before reversing. Price tapped the 4H bearish Order Block and reacted with strong downside aggression, confirming bearish intent.
At this stage, I would like to see a retracement into the 1H bearish OB at the 4254–4224 zone, which sits firmly in premium, along with a fill of the 1H FVG at 4235–4220. Once these areas are mitigated, the path toward the 4100–3900 region opens up.
My first partials/first target would be taken around the 4100 level.

Gold 4H: Bearish Scenario
Price is riding a clean rising trendline from the October lows, connecting multiple higher swing lows.
A break and retest of this blue trendline would signal fading momentum and open the door for a deeper correction toward horizontal support.
🧱 Why 3,947 is strong support
3,947 marks the previous consolidation base where buyers stepped in aggressively after the last sharp sell‑off, turning it into a clear demand zone.
It also aligns with the last major 4H swing low, so many stop‑losses and resting buy orders are likely clustered there, making it a natural magnet if the trendline fails.
📉 Bearish divergence
While price made higher highs on the 4H chart, the RSI printed lower highs, creating a clear bearish divergence.
This divergence suggests buyers are losing strength, increasing the probability of a trendline break and a move down into the 3,947 support area before any new major leg higher.

Bias remains bearish until price closes above 4,230–4,240.XAUUSD Outlook (Weekly):
Price continues to respect the bearish structure, forming lower highs under the trendline and rejecting the 4,240–4,250 supply zone. As long as price stays below 4,230, downside continuation toward 4200, 4185, and 4168 remains likely. A breakout above 4,240 would invalidate the bearish bias and open the path for higher targets. Watching reactions at key zones for directional confirmation.

XAUUSD – 30m | Channel Break → Retest → Bearish Liquidity Sweep OANDA:XAUUSD
The 4,240 resistance remains a strong rejection point, with price now trading inside a lower-timeframe distribution. Liquidity sits below 4,177 and 4,155 where previous reaction points remain untested. As long as market holds beneath 4,240, the downside continuation remains the more probable scenario.
Key Scenarios
📉 Bearish Continuation (Primary Plan)
Confirmation: Lower-high → rejection from 4,210–4,220
🎯 Target 1 → 4,177.5 (Liquidity sweep)
🎯 Target 2 → 4,155 (Support zone base)
📈 Bullish Invalidation
A clean break and hold above 4,240 would flip the structure bullish again.
Current Levels to Watch
Resistance 🔴: 4,240.677
Support 🟢: 4,177 | 4,155
⚠️ Disclaimer: This analysis is for educational purposes only — not financial advice

FVG- Order Block- ChocH- H2 gold🔥 Why the ENTRY is at 4186
It sits inside the premium zone (between 0.618–0.786 Fibonacci), which is where smart money prefers to SELL.
There is an unmitigated H2 FVG + Supply zone exactly there.
There is liquidity above (equal highs / wick highs), so price is likely to spike into this zone first.
It aligns with a previous swing high, making it a perfect reaction area.
➡ 4186 = Premium + Supply + FVG + Liquidity = A+ short entry
🛡 Why the STOP LOSS is at 4223
4220–4225 is the final liquidity pool above the supply.
If price breaks this level, the entire bearish idea becomes invalid.
Above 4223, H2 would create a bullish BOS, killing the short idea.
➡ 4223 = structural invalidation + liquidity protection
🎯 Why the TAKE PROFIT is at 3998
3998 is the next major H2/H4 demand zone.
It is the full imbalance (iFVG) fill target.
It aligns with the next liquidity pool below.
➡ 3998 = perfect smart money target

U.S. data storm ahead – Gold awaits its next breakout🟡 XAU/USD – Timing Reversal at 4188, FVG Retest Expected
🔍 Market Context
Gold is approaching a key timing zone near 4188–4190, which aligns with previous supply and structural rejection.
After a strong impulsive leg, liquidity resting above recent highs may be targeted before a deeper pullback into the Fair Value Gap (FVG) zone.
The structure remains bullish in the medium term, but short-term corrective moves are expected before continuation toward the 4212 liquidity objective.
📈 Key Trading Zones
🔻 SELL Setup
Entry: 4188 – 4190
Stop Loss: 4192
Target 1: 4090
Target 2: 4020
Expect rejection at timing zone — short-term bearish retracement into FVG.
🟢 BUY Setups
BUY GOLD 4090 – 4088 | SL 4085
→ Scalp long targeting 4140–4160 if price reacts strongly within FVG.
BUY GOLD 4022 – 4020 | SL 4017
→ Ideal deeper retracement buy zone aligning with structural liquidity & prior demand.
🧠 Trading Plan Logic
Wait for price sweep & rejection at 4188–4190 before confirming short.
Monitor FVG zone (~4090) for reaction to flip back long.
The higher-timeframe target sits near 4212, aligning with liquidity above prior highs.
⚙️ Bias
Short-term: Bearish correction from 4190 toward 4090.
Medium-term: Bullish continuation toward 4212 after retracement.

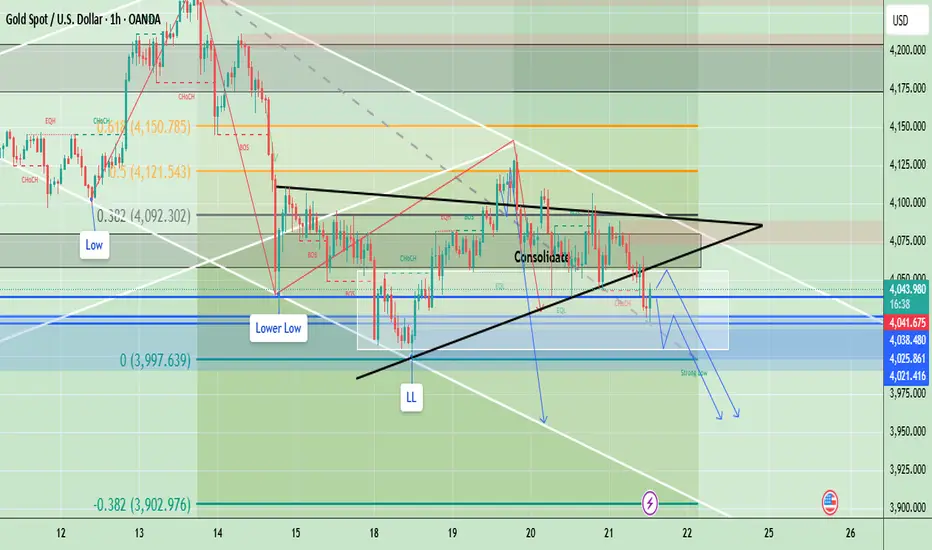
Gold Bearish Structure Continues – Sell Levels UpdatedGold remains bearish after rejecting from the upper consolidation boundary and continuing its pattern of lower highs and lower lows. Price has now broken below the triangle-consolidation zone and is retesting the lower boundary around 4038-45 which aligns with previous liquidity. As long as price stays below the triangle resistance and fails to reclaim 4080 momentum favors further downside. The next bearish targets lie below the Strong Low zone aiming toward deeper liquidity and Fibonacci extensions.
✅ Bias: Sell below 4080
- Sell Zone: 4045 - 4055 (Retest of broken consolidation + minor supply)
- Stop Loss: 4082 (Above triangle resistance + structure break)
- Take Profit: 4025 - 4008 - 3988
- Invalidate: 4082 (Above triangle resistance + structure break)
Note
Please risk management in trading is a Key so use your money accordingly. If you like the idea then please like and boost. Thank you and Good Luck!
XAUUSDHello Traders! 👋
What are your thoughts on GOLD?
Gold continues to trade in a range-bound and choppy structure, showing back-and-forth movement with no clear directional bias in the short term.
In the current zone, price is trapped between channel resistance and key support, and a breakout from either side will determine the next strong move.
We expect gold to form a short-term upward correction toward the upper boundary of the descending channel and the resistance zone.
Once price reaches this area, a bearish rejection is likely, leading to a continuation of the downward trend toward lower support levels.
If gold breaks below the 4050 support zone and the daily candle closes below this zone,
this will confirm further downward continuation without any bullish pullback, signaling a stronger bearish wave.
As long as gold remains below the resistance zone and channel top, the short-term bias stays bearish.
Any upward movement is likely to be corrective, providing a potential setup for continuation to the downside.
Don’t forget to like and share your thoughts in the comments! ❤️

XAUUSD – Reading the Market’s Secret Intentions🌐 MARKET CONTEXT
Gold begins the new week with compressed volatility yet maintains a bearish overall structure on H1. Price continues forming Lower Highs → Lower Lows, suggesting Smart Money is still distributing at premium zones while accumulating at deep discount pools.
Current Market Drivers
USD strength remains stable → keeping gold under pressure
Market awaits midweek USD data → early sessions may be liquidity-driven
Institutional flows show no strong bullish commitment yet
Bias for the day:
🔻 Bearish until price reclaims key premium zones with a valid CHoCH.
🔺 BUY setups valid only at deep discount liquidity pools (3996, 4030).
📉 TECHNICAL ANALYSIS (Liquidity + SMC Structure)
Market Structure
H1 Trend: Bearish
Key premium zone above: 4146–4148
Mid-range equilibrium: 4060–4080
Discount demand clusters: 4030 & 3994
Liquidity Observation
Buy-Side Liquidity (BSL):
Above 4146
Above 4071 liquidity wick
Sell-Side Liquidity (SSL):
Below 4030
Below 3994 (major liquidity pocket)
Imbalances / FVG
Strong bearish FVG at 4146–4148
Minor imbalance at 4068–4071
Clear discount imbalance at 4032–4030
Deep liquidity vacuum near 3996–3994
🔑 KEY PRICE ZONES (Clear, Compelling Explanations)
1️⃣ 4148–4146 → Premium Liquidity Trap – Main SELL Zone
This zone contains:
Unmitigated H1 Supply Zone
Heavy BSL resting above recent swing highs
Major bearish FVG fill
➡️ A classic liquidity-engineered premium trap where Smart Money sweeps breakout buyers before reversing aggressively.
2️⃣ 4068–4071 → Mid-Range Liquidity Sweep – SCALP SELL Zone
Features:
Clusters of intraday stops from earlier longs
A small FVG acting as inducement
Positioned near equilibrium → perfect for fakeouts
➡️ Expect quick wicks and sharp rejections, ideal for short, high-precision scalps.
3️⃣ 4032–4030 → Discount Reaction – SCALP BUY Zone
This area offers:
Clean SSL located just beneath
Micro Demand Zone
A common reversal point during bearish cycles
➡️ Excellent for fast BUY scalps with tight risk, especially during London manipulation.
4️⃣ 3996–3994 → Deep Discount Reversal – GOLD BUY Zone
A high-value accumulation zone:
Contains significant higher-timeframe SSL
Aligns with deep-discount structure
Frequently used by Smart Money to reload long positions
➡️ If price taps this zone, a strong bullish rebound is very likely.
⚙️ TRADE SETUPS (High Precision Entries)
✔️ SELL GOLD – Main Premium Short
Entry: 4148–4146
Stoploss: 4154
TP1: 4120
TP2: 4080
TP3: 4030
Logic: BSL sweep → FVG mitigation → bearish displacement.
✔️ SELL SCALP – Mid-Range Sweep
Entry: 4068–4071
Stoploss: 4077
TP1: 4050
TP2: 4038
Logic: Engineered liquidity → immediate rejection expected.
✔️ BUY SCALP – Discount Liquidity Reaction
Entry: 4032–4030
Stoploss: 4024
TP1: 4045
TP2: 4068
Logic: SSL sweep → CHoCH likelihood → intraday rebound.
✔️ BUY GOLD – Deep Discount Long
Entry: 3996–3994
Stoploss: 3988
TP1: 4020
TP2: 4060
TP3: 4140
Logic: Strong institutional accumulation zone → potential formation of H1 higher low.
🧠 SESSION NOTES
Avoid trading mid-range to reduce chop exposure.
Best moves form after liquidity sweeps in London or during NY displacement.
Confirm entries with M5/M15 CHoCH + displacement.
Never buy inside premium zones; never sell inside deep discount zones.
🏁 CONCLUSION
Gold maintains a bearish structure, favoring SELL setups at premium liquidity traps 4146–4148 and 4068–4071.
BUY setups remain valid only at strong discount zones 4030 and 3994, where liquidity supports a clean bullish reaction.
Let liquidity form the trap. Then strike with precision.

Continue to accumulate - gold price moves slowly around 4050⭐️GOLDEN INFORMATION:
Gold (XAU/USD) trades firmer near $4,075 in early Asian hours on Monday, supported by rising expectations of a Fed rate cut following comments from John Williams. Attention now turns to Tuesday’s US September PPI and Retail Sales data.
Williams noted Friday that the Fed could still lower rates soon without derailing progress on inflation. Markets now see nearly a 74% chance of a December cut, up from 40% last week, according to the CME FedWatch Tool. Softer rates would lower the opportunity cost of holding non-yielding gold, offering the metal additional support
⭐️Personal comments NOVA:
Gold price continues to accumulate and move sideways in the range: 4000 - 4100, The market did not have many major changes at the beginning of the week.
⭐️SET UP GOLD PRICE:
🔥SELL GOLD zone: 4143 - 4145 SL 4150
TP1: $4130
TP2: $4120
TP3: $4100
🔥BUY GOLD zone: 4003 - 4001 SL 3996
TP1: $4016
TP2: $4028
TP3: $4040
⭐️Technical analysis:
Based on technical indicators EMA 34, EMA89 and support resistance areas to set up a reasonable SELL order.
⭐️NOTE:
Note: Nova wishes traders to manage their capital well
- take the number of lots that match your capital
- Takeprofit equal to 4-6% of capital account
- Stoplose equal to 2-3% of capital account

XAUUSD – Where Smart Money Strikes Today🌐 MARKET CONTEXT
Gold begins today’s session after a phase of controlled volatility, where price continued to sweep both sides of the range but failed to commit to a direction. The broader intraday structure remains bearish, with price rejecting premium levels and forming consistent lower highs.
Recent Drivers:
USD shows moderate resilience following firm Fed communication
Market sentiment cautious ahead of late-week economic announcements
No significant safe-haven inflow → neutral risk environment
Session Expectations:
London Session: Likely to trigger early liquidity sweeps above premium wicks
NY Session: Expected to deliver the main directional push
Bias: Bearish unless price reaches deep discount zones and prints a CHoCH
Price is currently trading within the middle of the intraday range → best setups remain at extremes (premium sells / discount buys).
📉 TECHNICAL ANALYSIS (SMC + LIQUIDITY STRUCTURE)
Market Structure
M30 structure remains bearish (Lower Highs → Lower Lows)
Current equilibrium zone: 4060–4080
Inducement stacking above 4147 and 4081
Liquidity Map
Buy-Side Liquidity (BSL): Above 4147 and 4081
Sell-Side Liquidity (SSL): Below 4033 and deeper cluster at 3993
These layers show engineered liquidity designed to trap impatient traders.
Imbalances (FVG Zones)
Bearish FVG: 4147–4148 → strong premium rejection zone
Minor FVG: 4079–4081 → ideal scalp sweep zone
Discount FVGs: 4033 and 3993 → high-quality buy reactions
🔑 KEY PRICE ZONES (Clear & Engaging Explanations)
4148–4147 ▶️ Premium Liquidity Trap – High-Probability Sell
This zone holds a clean bearish OB + untouched BSL above 4147.
Institutional traders typically use this area to trigger breakout buyers before reversing the move sharply downward.
4079–4081 ▶️ Mid-Premium Inducement – Scalp Rejection Zone
A compact liquidity pool sitting just above equilibrium.
Market often sweeps here during London session to induce buys before dropping.
4035–4033 ▶️ Discount Reaction Zone – Reliable Scalping Demand
Micro OB + SSL alignment makes this zone ideal for sharp intraday rebounds.
Expect fast reactions with minimal drawdown.
3995–3993 ▶️ Deep Discount Pool – Strong Reversal Zone
This region contains layered SSL + higher-timeframe discount confluence.
If price taps this zone, a significant intraday reversal becomes highly probable.
⚙️ TRADE SETUPS (SMC-Based, High Precision)
✔️ SELL SETUP 1 – Premium Rejection
Entry: 4148–4147
Stop-loss: 4126
TP1: 4135
TP2: 4105
TP3: 4080
Logic: BSL sweep + FVG mitigation → strong bearish displacement expected.
✔️ SELL SCALP – Mid-Range Liquidity Sweep
Entry: 4079–4081
Stop-loss: 4087
TP1: 4065
TP2: 4048
TP3: 4033
Logic: Sweep of inducement above mini-BSL before continuation down.
✔️ BUY SCALP – Intraday Discount Rebound
Entry: 4035–4033
Stop-loss: 4027
TP1: 4048
TP2: 4070
Logic: SSL sweep triggers a micro CHoCH → quick bullish bounce.
✔️ BUY SETUP 2 – Deep Discount Reversal
Entry: 3995–3993
Stop-loss: 3987
TP1: 4010
TP2: 4040
TP3: 4070
Logic: Key institutionally favoured zone → strong liquidity-driven reversal.
🧠 NOTES / SESSION PLAN
Only trade at extremes — avoid mid-range to prevent chop
Expect engineered fake-outs at London open
NY session likely delivers true directional movement
Wait for M5/M15 confirmation: CHoCH + BOS before executing
Avoid buying near premium zones to avoid falling into liquidity traps
🏁 CONCLUSION
Gold maintains a bearish M30 structure, favouring sell setups at 4147 and 4081.
Discount zones at 4033 and 3993 offer high-probability buy opportunities for intraday rebounds or full reversals.
Stay disciplined.
Let liquidity be your guide.
Strike only when the trap is set.

Bearish Reversal Expected from Key Resistance ZoneHello Followers, I am going to share you my opinion on gold next move..
Currently gold is running at 4035.. Price has approached a strong Resistance Area, where previous candles have repeatedly failed to break higher. The current market structure shows exhaustion near this resistance zone, indicating a potential reversal. Once price reacts from the resistance, we expect it to form a lower high and continue dropping toward the marked Target Area around the 3940. This creates a high-probability sell setup... If gold do not respect the resistance and break it then we have a Stoploss point there..
KEYPOINTS:
Entry-level 3935
Target Area 3940
Resistance area 4050/4065
Stop Loss Point 4090

Gold Weakening Inside Triangle – Bears Eye $3,950 SupportGold is currently consolidating inside a symmetrical triangle formation between 3972 support and 4025 resistance showing reduced volatility and awaiting breakout confirmation. The structure suggests indecision but with a slight bearish bias due to repeated lower highs.
Sell Zone: 3995-4020 (near upper triangle resistance and 0.382-0.5 fib region)
Stop Loss: Above 4046
TP1: 3950 TP2: 3915 TP 3: 3885
⚠️ Current bias: Neutral to bearish unless gold breaks and holds above 4025-4046 zone. Weak low near 3886 may attract liquidity if bearish pressure continues.
Note
Please risk management in trading is a Key so use your money accordingly. If you like the idea then please like and boost. Thank you and Good Luck!

Gold Under Pressure: Key Resistance Holds, More Downside LikelyGold is moving inside a descending channel showing clear bearish pressure. Price is struggling to hold above 4050-70 and repeated rejections from the upper trendline confirm sellers are still in control. A clean break below 4025 can open the way toward the deeper liquidity zones around 4010 and 3975. As long as price stays below the falling trendline the bias remains bearish and any small pullback toward 4075-90 will likely act as a selling opportunity. Only a strong breakout above 4100-20 would shift momentum back to buyers.
✅ Bias: Sell below 4060-85 resistance
Sell Zone : 4075–4090
Stop Loss : Above 4120
Take Profit : 4025 - 4010 - 3975
Note
Please risk management in trading is a Key so use your money accordingly. If you like the idea then please like and boost. Thank you and Good Luck!

Gold at Make-or-Break Level – High-Probability Short Setup LoadiGold is still trading inside a corrective structure after forming a clear lower low and then consolidating. Price has tapped the mid range zone and is now reacting from a short term supply area. As long as gold stays below 4130–4145 the bearish structure remains intact and the downside continuation toward 4025 → 4000 → 3950 remains the primary expectation. A short setup becomes active once price gives rejection or a small BOS from the current supply zone. The trade becomes invalid if gold breaks and closes above 4150 which would shift structure and open the way for a deeper pullback toward 4175–4200.
Sell Zone : 4130 - 4145
Invalidation : Break & close above 4150
Targets: 4075 → 4025 → 4000 → 3950
Note
Please risk management in trading is a Key so use your money accordingly. If you like the idea then please like and boost. Thank you and Good Luck!

Gold Bearish OutlookExpecting CSE:GC TVC:XAU to be bearish for the rest of the month
- Seasonals lean bearish till EOM
- Commercials are highly short while Small traders are highly long
- OI relatively high
- CLEAR Market structure break
- CLEAR IRL to ERL target

XAUUSD – Battle Zones of the Day🌐 MARKET CONTEXT
Gold enters today’s session after a day of compressed volatility, where price repeatedly tapped into both buy-side and sell-side liquidity but failed to develop a clean trend. The intraday structure remains bearish, with price rejecting premium zones and forming lower highs on M30.
Recent Catalysts:
USD maintains mild strength following hawkish Fed tone
Market awaits midweek economic releases → low conviction sentiment
Risk sentiment remains neutral; no strong safe-haven flows
Session Expectations:
London Session: Early liquidity sweeps expected toward premium zones
NY Session: Higher probability of real directional expansion
Bias: Bearish intraday until discount zones induce a CHoCH
Price currently trades mid-range, making extreme liquidity zones the safest execution points.
📉 TECHNICAL ANALYSIS (SMC + LIQUIDITY STRUCTURE)
Market Structure
M30 structure: Lower Highs → Lower Lows
Equilibrium area: 4075–4085
Inducement layers stacking above 4147 and 4070
Liquidity
BSL: Above 4147 + 4070
SSL: Below 4033 and deep pocket at 3993
Market forming engineered liquidity wicks in both directions
Imbalance Zones
Bearish FVG at 4147–4148 (perfect scalp sell)
Minor imbalance at 4070–4071
Discount imbalances at 4033 and 3993 support buy setups
🔑 KEY PRICE ZONES (Clear, Attractive Explanations)
4148–4147 ▶️ Premium Liquidity Trap – Ideal Scalp Sell
A premium zone holding an unmitigated bearish OB + BSL inducement.
Smart money uses this area to trigger breakout buyers, then slam price back down.
4071–4070 ▶️ Secondary Premium Liquidity – Fast Rejection Zone
A mini liquidity pool just above equilibrium.
Engineered to sweep early-session highs before reversing sharply.
4035–4033 ▶️ Discount Reaction Zone – Scalping Demand
Micro OB + SSL cluster resting underneath → excellent for intraday rebounds.
Expect clean, mechanical reactions here with low drawdown.
3995–3993 ▶️ Deep Discount Liquidity Pool – High-Value Reversal Zone
Major SSL accumulation + HTF discount zone alignment.
A powerful reversal area if reached — institutions hunt this level for discounted entries.
⚙️ TRADE SETUPS (SMC-Driven, High Precision)
✔️ SELL SETUP 1 – PREMIUM SCALP
Entry: 4148–4147
Stoploss: 4126
TP1: 4135
TP2: 4120
TP3: 4085
Logic: BSL sweep + FVG fill → fast bearish rejection expected.
✔️ SELL SETUP 2 – MID-RANGE LIQUIDITY SWEEP
Entry: 4071–4070
Stoploss: 4077
TP1: 4058
TP2: 4043
TP3: 4033
Logic: Sweep of mini-BSL followed by displacement downwards.
✔️ BUY SETUP 1 – INTRADAY REBOUND
Entry: 4035–4033
Stoploss: 4027
TP1: 4048
TP2: 4070
Logic: SSL sweep → micro CHoCH potential → ideal for quick bounce.
✔️ BUY SETUP 2 – DEEP DISCOUNT REVERSAL
Entry: 3995–3993
Stoploss: 3987
TP1: 4010
TP2: 4040
TP3: 4070
Logic: Strong HTF discount reaction zone → high-probability reversal if tapped.
🧠 NOTES / SESSION PLAN
Avoid mid-range trading — only execute at extreme liquidity zones
Expect fake-outs during London opening
NY session likely delivers the main trend move
Always wait for M5/M15 confirmation (CHoCH + BOS)
Avoid buying near premium zones to prevent entering into liquidity traps
🏁 CONCLUSION
XAUUSD holds a bearish intraday structure, favoring premium sell setups at 4147 and 4070.
Discount zones at 4033 and 3993 remain high-probability areas for intraday bounces and potential reversals.
Trade only at liquidity extremes. Be patient. Let the traps form — then strike.

Bearish Delivery Activated Between OG ZonesVANTAGE:XAUUSD price has rejected cleanly from the new
🐼Bearish OG Zone, and the OG TrendMaster just printed a 📉Short signal.
Buyers lost control, so my bias is to the downside, targeting the lower OG zone.
Short Bias:
• Entry: 4,078 – 4,090 (Bearish OG zone)
• Stop: Above 4,118
• TP1: 4,045
• TP2: 4,025
• Final Target: Lower OG Zone (around 4,000 – 3,990)
Fundamentals also line up with a bearish bias on gold. Today’s key U.S. releases NFP, Unemployment Rate, and Average Hourly Earnings can create strong volatility. If jobs and wages come in stronger than expected, the dollar typically strengthens and gold sells off. Even neutral numbers can keep pressure on gold as markets price in tighter monetary conditions. With heavy USD data on deck, the short setup aligns well with the macro narrative.

Gold H1 – Sideway or Preparing for a Bigger Break?🟡 XAUUSD – Intraday Smart Money Plan | by Ryan_TitanTrader (20/11)
📈 Market Context
Gold continues to move inside a tight consolidation as markets digest fresh headlines:
Treasury markets just erased hopes for a December rate cut and now even a January cut is doubtful, following hawkish tones revealed in the latest Fed minutes.
This shift reinforces USD strength in the short term and pressures gold’s bullish momentum, keeping price trapped between well-defined liquidity zones.
Key implications from the news:
• The 6-month Treasury yield jumped back to 3.83%, aligning with hawkish expectations.
• Rate-cut bets evaporating → USD stays firm, limiting gold’s upside.
• Institutions are engineering both-side liquidity sweeps ahead of upcoming Fed speakers.
• Gold is currently hovering around ~$4,070 inside a neutral zone where no clean premium/discount imbalance exists.
Until the market receives fresh macro catalysts, price is likely to sweep liquidity at the edges of the range before choosing direction.
🔎 Technical Analysis (1H / SMC Structure)
• Structure: Price remains inside a short-term sideways distribution after the recent CHoCH + BOS sequence.
• Premium Sell Zone: 4145–4147, aligning with unmitigated supply + buy-side liquidity resting above recent highs.
• Discount Buy Zone: 4004–4002, sitting inside last clean demand with previous sell-side sweep.
• Liquidity Map:
→ Buy-side liquidity: above 4145–4150 (equal-high cluster).
→ Sell-side liquidity: below 4004–3997, where earlier long positions were cleared.
🔴 Sell Setup (Premium Reaction Zone)
• Entry: 4145 – 4147
• Stop-Loss: 4155
• Take-Profit:
→ 4085 (minor imbalance)
→ 4045 (range midpoint)
→ 4004 – 4002 (discount demand)
📌 Execution rule: Wait for liquidity sweep into zone + bearish CHoCH M5–M15 before entering.
🟢 Buy Setup (Discount Reaction Zone)
• Entry: 4004 – 4002
• Stop-Loss: 3997
• Take-Profit:
→ 4040 (short-term range high)
→ 4075 (inefficiency fill)
→ 4140 (premium retest)
📌 Valid only if price sweeps the 4000–3997 liquidity pocket and shows strong bullish displacement.
⚠️ Risk Management Notes
• Expect increased volatility as markets reposition after the sharp decline in rate-cut expectations.
• Avoid trading inside the 4030–4080 chop zone unless a clear structure break occurs.
• Reduce risk size during sudden USD spikes caused by Treasury-yield moves.
• Trail stops progressively as each liquidity level is taken.
📝 Summary
Gold is currently stuck in a clean intraday range as hawkish Fed minutes remove hopes for early rate cuts, pushing USD up and holding gold below premium supply.
SMC structure favors liquidity-sweep setups at both edges:
• Sell Zone: 4145–4147 (premium supply)
• Buy Zone: 4004–4002 (discount accumulation)
Expect classic manipulation → reaction → continuation patterns until the market resolves the new macro pressure.
📍 Follow @Ryan_TitanTrader for more Smart Money updates.
