Gold Week 37 (11/09/2023 to 15/09/2023)Hi Traders,
Let's look back to what this precious metal did last week.
Monday
It started out at the 1930. Sideways till NY Session open before making a break down to the 1923 area.
Tuesday
It made an attempt to rally but failed to make a clean break above. It went down instead breaking the 1915 area right before the US session.
Wednesday
Price continued sideways for almost the whole day. Retest the 1915 but failed to break and continue to maintain below that SBR (Support Become Resistance) Level.
Thursday
Continues the bearish movement from Asian Session breaking the 1903 level making a new low in the Higher Time Frames. A reversal happen during the US Session. A bullish engulfing Candle started a rally upwards.
Friday
Price continues to rally upwards. Breaking previous Resistance levels 1915 and 1923 before returning to 1930 the area where it first started.
The week ends with Gold respecting 1930 and returning back down to 1923 area.
Thank you for checking this chart out. Like and follow if you like my chart.
Catch you again next week.
Goldtrade

GOLD XAUUSD Technical Analysis and Trade IdeaGOLD XAUUSD is presently encountering downward pressure and has reached a significant level of support. In the accompanying video, we will delve into several trading concepts. Our discussion will encompass a wide array of technical analysis components, including the a look at the existing trend, evaluation of price movements, market structure, and consideration of other pivotal factors. It's crucial to underscore that the video content is intended purely for educational purposes and should not be construed as financial advice. Trading in the precious metals market entails inherent risks, making it essential to establish robust risk management strategies to protect your capital.

GOLD XAUUSD Technical Analysis and Trade IdeaIt is apparent that GOLD XAUUSD has encountered notable downward pressure in recent trading sessions. Its trajectory has exhibited a clear descent towards a pivotal support level, as observed on the daily time frame. Our focus now revolves around identifying a favorable entry point during the impending retracement.
In the accompanying video, we delve into critical facets of technical analysis, encompassing elements such as price action dynamics, the prevailing market structure, trend identification, and the delineation of crucial support and resistance levels. It's imperative to emphasize that the content of the video is intended solely for educational purposes. It should not be construed as financial advice, but rather as a valuable resource for enhancing your understanding of market dynamics.

GOLD:Trading strategy
Gold tested 1900 many times yesterday and was supported, and now it has broken through the range of 1915. Then it can be judged that gold is temporarily reversed. As long as it falls to a low level, you can try to buy.
The low of the H4 cycle rose three times. The rise in the morning directly broke the suppression point of the middle Bollinger band. The previous suppression point became a support point. The lower support point is near 1910, and the upper H4 Bollinger band high or the 60-day moving average high is near 1922. If the rise can be maintained on Friday, then next week I am more confident that gold will rise in the near future.
Short-term fast trading
Gold:buy 1905-1910 TP:1915-1922 SL:1898
If you want to make money, join me, keep up with my strategies, and I will share my ideas every day.

XAUUSD SHORThello traders.for gold we are in downside in daily timeframe.after price broke this trend line we were in a correction range.now it is broken and you can see choch in 1hr.
so I am waiting for confirmation in pullback for my short entry around FVG area.
R:R 1:70
“”your follows and boosts encourage me to publish more analysis””

🚀Gold increase after Breaking the Resistance lines🚀⏰(1-Hour)⏰✅Gold managed to break the resistance lines a few hours ago.
🔔I expect the upward trend of Gold to continue and Gold to close its 🟡 Price Reversal Zone(PRZ) 🟡 and Important Downtrend line .
Gold Analyze ( XAUUSD ), 1-hour time frame ⏰.
Do not forget to put Stop loss for your positions (For every position you want to open).
Please follow your strategy; this is just my idea, and I will gladly see your ideas in this post.
Please do not forget the ✅' like '✅ button 🙏😊 & Share it with your friends; thanks, and Trade safe.

XAUUSD EXPECTATION! SHORT!Hello Traders, here we are again with new analysis on GOLD,
What we see here, is quite clear, so as always we have some expectation from price, so if they follow our expectation we take decision,
We have strong supply zone around 1926, which price had extreme drop, however, it cannot be only confirmation as we are coming from 1918.50, which is strong resistance for the price, so I expect for the price to see 1926 for one more time to collect orders, the we continue short,
So as always stay with me, I will let you know where to enter exactly to don't miss this opportunity,
For now we going wait for the price to reach our determined level, then we will see if we can enter or no!
Remember there is huge risk in this market, so always respect to your risk management
Any question comment me bellow!
@FxShzd team

Break resistance 1926? #GOLD... market just break hia upside resistance area 1926 around if its proper breakage then next upside 1942 on table.
If not then downside area mentioned on chart..
Trade wisely
Good luck

What do you say today, Gold Movements,Buy or Sell?Dear traders, Today again, gold is running at $1914.00 and $1908.00 prices, with gold moving up and down but in the same price range. We have strong reasons to buy gold, but first we need confirmation.
If you like our analysis, then you can boost our posts. You can leave a comment in the comment section.
Good luck and best wishes to everyone.
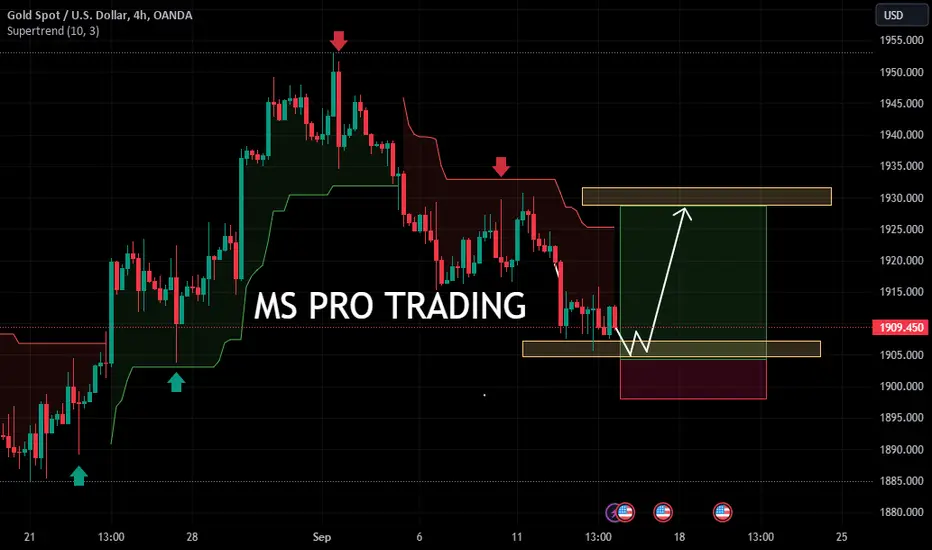
Gold HT4 Setup is now very clearDear traders, We can see that a few hours ago gold broke resistance, and now we are eyeing the next resistance, but first some pullback, then again up, and our target is 1928.00.
If you like our analysis, then you can boost our posts. You can leave a comment in the comment section.
Good luck and best wishes to everyone.

Take profits on empty orders, and continue to buy long orders
The gold empty order has won a big victory and made a profit. We have turned around and done a lot. The fall of the k-line is basically in place, and the area below 1915-1918 is obviously a strong support. It is difficult for the k-line to penetrate this position. It is so decisive , relying on the support of 1915, we are determined to do more
Many people asked me, isn't this an obvious bearish pattern? Why do more? The market is ever-changing. Nothing is certain. Only by changing can we deal with the invariance of the market. I don’t like doing nothing without thinking, because the market cannot go down without thinking.
Everyone is drunk and I am sober, eclectic. At the same time, the hour line shows that the k-line and the moving average are far apart. This must be unreasonable. We have always reminded that the k-line fluctuates around the moving average, which means that it must return to the 50 moving average. 1927 continues to be more

Gold is long near 1910
Ready to kill long and short, ready to celebrate, I'm ready, what about you?
Gold has support at the 1900 level. We rely on this support level to enter the market early and have more backhands. What we need is courage, decisiveness, and never be timid. I just ask you if you dare?
XAUUSD Buy1911 Sl1900 Tp1925

Gold is short near 1925
Let’s continue to look at the 1903 line. If we don’t reach this position, we won’t give up. On Friday we will look at the 1903 line, but unfortunately the penetration is not strong enough, or the energy to build momentum is insufficient. We will definitely reach this target today.
The gold four-hour line is obviously in a short position, especially on Friday when it rebounded to around 1930, and then the negative line fell, directly breaking through below 1920, and it also clearly closed the upper shadow line. The large negative line continued to fall, and the 50 moving average was moved upward. Press the pause button. It is obviously moving downward. This kind of top Yin line engulfing the Yang line must be short. It is short around 1925.

Short near gold 1936
At present, there is an obvious top signal on the k-line, which is also an obvious double top shape. The bottom is about to plummet, at least around 1915, the big Yin line has clearly broken through the 50 moving average, and there is also a head-and-shoulders top situation. 1936 empty

The current price continues to be empty
The trend is king, point wins! Friends who are familiar with me know that we are trend traders! Every wave of trend is eaten from the beginning to the end! Before the market has fundamentally changed, we have only one way of thinking, and any callback is an opportunity to do more!
Yesterday we firmly looked at the fall. There must be a wave of fall on the k-line. It is obvious that the jump from the original place cannot go up. Looking at the downside, the overall employment index in the United States is upstream, and it is inevitable to be negative for gold
The gold four-hour line is still under pressure, especially the resistance around 1955. Relying on this resistance, it is inevitable for us to continue the high altitude. It is mutually attractive with the 50 moving average, empty, 1946 air

The gold empty order has made a profit, and it will continue to
Wednesday's 1948 empty order came down
We have clearly given the 1948 short, 1947 short and 1946 short, the big Yin line still goes down to the 1938 line, but this is not the end, the non-agricultural night must be below 1920, today is firmly bearish
Gold 1942 is directly empty, and 1941, 1942, 1943, 1944, 1945, and 1946 can all be entered in batches to be empty. Tonight is to prepare sacks and prepare for celebration. Everything is ready and only owes Dongfeng
The golden hour line is obviously in a triple top situation. The k-line rebounded to around 1948, which is obviously weak. The big Yin line directly engulfed the downward trend. At the same time, the 50 moving average also came down from the peak. Next, the opening price is also below the resistance level, and the market is obviously empty, and 1942 is directly empty.

Don't worry, continue to go long in 1915
Continue to go long. Yesterday we predicted that the K-line can hold the 1900 line. In the end, it did so without any loss. This is the accuracy of trading. We continue to go long at 1901 and 1908. At present, we are directly long at 1915, and today it is less than the 1926 line. , the position will not be closed
The golden hour line maintains the arc bottom situation, that is, the low points continue to move upward. The bottom is all a large increase in the positive line. The K line runs close to the 50 moving average. The moving average naturally runs upward. One positive line crosses three negative lines. This It is a bullish trend. The closing price of gold price overnight is also above 1900. Going long is the requirement of the market. Even if it falls back to around 1905, the big positive line still engulfs the upward trend. If it is long, 1915 will be directly long.

Trading strategy for 20 pips profitToday, I gave you a trading idea. We try to short gold at a relatively high level. At present, I have informed everyone to short gold near 1915 and 1920 respectively. Although there is no profit yet, I believe we will definitely achieve good returns.
Yesterday, gold fell to a low of around 1900. Today, gold rebounded and recovered some of its losses, and gold is currently trading near 1919. Although gold has seen a partial rebound, in my personal opinion, this is just a technical repair, so I do not recommend chasing gold at this position. At present, gold faces resistance in the 1921-1923 area at the short-term level, and if the rebound is not strong, it may be difficult for gold to stand above 1920. Therefore, gold will also face a downward trend in the short term. At present, everyone can hold the order patiently and wait for profit!
In fact, as long as you grasp the rhythm, it is easy to profit from gold trading. If you don't know the accurate trading rhythm, you can follow my trading ideas. I post my trading ideas every day and I also post free trading signals on a regular basis. Many friends have given feedback that it is very helpful. If you want to learn market trading logic, or you want clear trading signals and get more profits, I can satisfy you. Be sure to follow the bottom of the article to view the details!

xauusd sellhi gyus this is small sell for gold and then....
please like and comment for me and share your idea

Gold 1938 continues to be empty
From the perspective of the daily line pattern, after the rapid rise in the U.S. market, the price successfully stabilized above the key pressure level of 1924, reaching the highest point of 1938. The market has opened a new round of space trends. The intraday support focuses on the first-line support of 1924, and the upper pressure When the position reaches 1948, the data is just a laugh. Although it is a good trend for the bulls, but the rapid rise will definitely fall back and adjust. In the early trading, it will be short at 1936. When the price reaches the vicinity of 1924-1926, it will go long directly!
The hourly line trend shows a volatile upward pattern, the high point is constantly setting new highs, and the low point is constantly rising. At present, with the changes in the market, the support of the trend line has moved up to around 1916, and the support of the moving average has come to around 1926 , the price deviation from the current price of 1936 is too large, and the probability of stepping back on the moving average within the day is very high. I think today's overall trend will continue to rise after shocking down and adjusting, and the bulls will rise after they get a foothold.
The U.S. market focuses on the small non-agricultural market. If there is no accident, there will be no other redundant trends in the European market except for the callback. We need to take the empty order of 1936 with peace of mind. There is no shortcut to the transaction, and there is no background. Floating losses and messing up your mind, let go of your timidity, adjust your mentality, the end of the transaction will always be the next order!

Gold 1888 began to be more, more orders 19 consecutive victories
19 consecutive victories in multiple orders
Gold multi-stage multi-orders are all profitable. We started to deploy long orders from the 1885 line, and increased positions along the way. You can list them, 1888, 1890 (more than three times), 1891, 1892 (three times), 1893, 1894 , 1895, 1897, 1898, 1899, 1900 (2 additional positions), 1901 and 1902, all Dayang lines take profit and leave the market
Gold is blocked at the moment, and the k-line is obviously unable to move forward. It is inevitable to fall back. Overnight 1918 is empty, and it is right to do it. There is absolutely no waiting. It is also simple and clear, never ambiguous, only specific points bit
The gold four-hour line is a little immobile. At least the 1920 line is still not standing firm. It has been mentioned that the gold price and the moving average will inevitably return. The current k-line deviates far from the moving average. This is an unreasonable trend. The transaction is not one-sided. At least I can't be like this. At any time, the k-line is the so-called Tao of one yin and one yang, that is, a fall is inevitable. Today, it will fall below 1910

Gold long and short 40 consecutive victories, the current price
Gold, we are long and short to take profit again. During the day, we are short at 1926, and the big Yin line takes profit at 1915. Then we directly backhanded more, and 1916 also increased our positions. At night, the US market reached above 1931 in one go, and we directly took profit and left. , now come to 40 wins
The position of gold 1938 is encountering resistance again. This is also a strong resistance in the previous period. The k-line is bound to fall back. Two horizontal lines and one vertical line are directly empty. It belongs to the movement around the moving average, and it is inevitable to return to the 50 moving average. Let’s look at the fall first

It is obviously a bearish trend, all below 1946 are empty
Yesterday we were short at the current price of 1941, 1942, 1943, 1944, 1945, and 1946 were all empty, and the entire network entered the market publicly. At present, the k-line has reached below 1935, realizing continuous harvesting of empty orders, and recently achieved 52 wins and 3 losses
At present, the k-line is in a short position, and it looks like it will plummet. It will be below 1870 at one time, and there is still 60 points of space at present. Don’t miss this wave of empty space. At the same time, the signal at the top is also obvious. The high point keeps moving down, two points and one line , it is obviously a bearish trend, all below 1946 are empty
