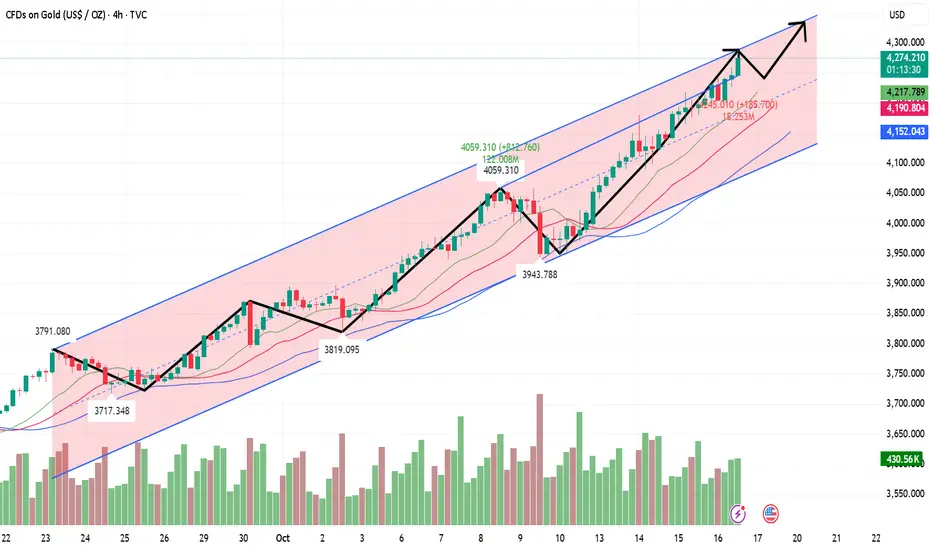
GOLD 4H CHART ROUTE MAP Hey Everyone,
This is an extended 4H chart idea, continuing from our previous analysis, now with the added Goldturn levels above, allowing us to continue to track ongoing movement.
After completing the 4212 move, price continued to push upward, leaving a small gap near 4383 before facing rejection. We’re now seeing price retest the lower Goldturn levels for support, with a current test around the 4212 Goldturn. The 4212–4154 zone remains a key weighted area, and as long as price holds above this zone, we may see a potential bounce.
We’ll return on Sunday with our multi-timeframe roadmap and trading plans for the week ahead. Thank you all once again for your continued support, likes, and comments, we truly appreciate it.
Mr. Gold
GoldViewFX
Goldtrading

GOLD (XAUUSD): The Next Resistances
Here are the next potentially significant resistances on Gold to focus on.
Resistance 1: 4397 - 4403 area
Resistance 2: 4447 - 4453 area
Resistance 3: 4487 - 4503 area
Consider the underlined horizontal and vertical supports
for potential buying after pullbacks.
❤️Please, support my work with like, thank you!❤️
I am part of Trade Nation's Influencer program and receive a monthly fee for using their TradingView charts in my analysis.

10.17 Gold bulls rose sharply and are about to enter the 4400 erLooking at the 4-hour market trend, the short-term support at 4290-4300 is currently under consideration, with a focus on 4270. The bulls are rising strongly and there is no end in sight. Trading strategies should focus on buying on pullbacks. For intermediate positions, be cautious in following orders and patiently wait for key entry points. I will provide detailed trading strategies during the trading session, so please pay attention.

Gold Retests All-Time Highs – Bulls Still in Full Control📊 Market Overview
Gold experienced a sharp intraday drop during the Asian session, testing the 4,280 – 4,279 USD zone before quickly recovering. Despite short-term volatility, it continues to close the week in green for the ninth consecutive time — confirming the strength of the ongoing bullish cycle.
The broader fundamentals remain supportive:
💥 Persistent geopolitical tensions keep safe-haven demand high.
⚖️ US–China trade uncertainty and the risk of a prolonged US government shutdown weaken risk appetite.
💵 Fed rate-cut expectations and USD softness continue to favor gold upside.
In short — Smart Money remains positioned long, and every dip still looks like a liquidity grab for re-accumulation.
🧠 Technical Structure (MMFLOW View)
On the M30 timeframe, gold continues to respect an ascending channel, currently forming a liquidity trap and breakout setup around 4,280 – 4,330.
Price action suggests gold may be completing a short-term corrective wave (B) before resuming the larger bullish impulse.
The structure remains technically bullish, with all pullbacks showing strong rejections from demand zones.
🔑 Key Levels to Watch
🟢 BUY ZONE (Primary Setup)
Zone: 4,230 – 4,228
SL: 4,220
TP: 4,240 – 4,250 – 4,260 – 4,270 – ???
🔵 CP ZONE BUY (Secondary Support)
Zone: 4,284 – 4,285
SL: 4,275
TP: 4,300 – 4,315 – 4,330 – 4,340 – ???
🔴 SCALP SELL (Liquidity Reaction Zone)
Zone: 4,438 – 4,440
SL: 4,448
TP: 4,420 – 4,410 – 4,390 – ???
⚙️ MMFLOW Scenarios
1️⃣ Primary Bullish Scenario:
If gold holds above 4,280 – 4,284, expect continuation toward 4,380 – 4,438 (Liquidity Sell Zone).
The 4,284 level is the key control point where Smart Money may look to re-enter long positions.
2️⃣ Alternative Correction Scenario:
A clean break below 4,280 could drive price toward 4,249 – 4,243 (CP Buy Zone) before another bullish push higher.
This structure still aligns with a Healthy Correction Pattern within a broader uptrend.
⚡ MMFLOW Insights
Gold remains in a mid-term expansion phase, with both macro and technical alignment favoring continued upside.
The 4,280 – 4,330 range acts as a Smart Money accumulation zone, preparing for a liquidity sweep higher.
Medium-term upside target: 4,438 – 4,445 USD/oz (Liquidity Sell Zone).
⚠️ Trading Notes
✅ Always use a protective Stop Loss — volatility can spike during liquidity hunts.
✅ Avoid chasing entries at highs; wait for reaction around BUY ZONES.
✅ Focus on liquidity confluence zones (Fibo + CP Zone + Order Block) for the highest-probability setups.
🧭 Quick Summary
Gold remains resilient despite early-session volatility.
Watch BUY ZONES at 4,230 – 4,228 and 4,284 – 4,285 for possible long re-entries.
Short-term target: 4,380 – 4,438 USD/oz.
Bias: Bullish – Buy the dips, not the breakouts.

Gold traders - White House to speak on China shortlyGold’s impressive rally has been powered by a mix of rate-cut expectations, political risk, central bank buying, and dollar weakness.
Gold traders’ focus this week has been on the escalating U.S.–China trade tensions though.
Markets are standing by for a statement from the White House, expected within the hour.
We’ll post updates here once the White House statement is released and markets begin to react.

The Golden Triangle is coming to an end, beware of profit takingGold Hourly Chart: The overnight close was relatively high, and today's Asian session continued its upward trend. The European session saw a sharp drop below the upper channel line at 4242. This trend resistance line is the same one that held pressure at 4218 in yesterday's European session. The market then closed with a large, plump, bearish candlestick pattern at 2:00 PM, reaching the target of 4210. Since it was a large bearish candlestick pattern, not a long lower shadow candlestick pattern, a rebound confirming the 5-day moving average at 4230-34 is sufficient, so a further downward push is warranted.
The European session saw consecutive positive days, testing the bottom and rallying to a new all-time high. However, caution is advised in the US session. On the one hand, the 4250 level is a resistance point in the channel, and on the other hand, it is nearing the end of an ascending converging triangle, leaving little room for further movement and a potential reversal. Therefore, support remains at the middle line at 4230. Only a significant break below this level would trigger a potential for a significant short-term correction. Resistance is at 4265. Be cautious about blindly chasing rallies below this level. Consider the gains and losses at both levels and wait for signals.
10.16 Gold Short-Term Operation Guide!!!Three key points to watch today:
1. Position. Today's target is the 4200 area (previously, it started at 4000, then 4090, and yesterday was 4140).
The 4200 mark is today's early trading low. Using this as a dividing line, we're looking to sweep the $40 range above and below. A breakout will open up further opportunities.
2. Channel. The lower band of the channel overlaps with yesterday's low at 4140, while the upper band currently overlaps at 4220-4225.
Today's Asian session saw continued gains, breaking through the small channel range and extending gains by approximately $20 to 4242. However, after the breakout, the price fell back to 4203, retesting the previous high. If the market falls back into the channel, the support and resistance levels will shift again to the 4220-4225 area.
If it successfully holds above the support level, look for the 4200 area. If it breaks below, look for the 4180 and 4165 areas, with the 4145-4140 area exceeding the range.
Similarly, if it breaks above 4240, and the profit margin is halved according to the principle of equal distance, the next resistance level will be the 4270-4290 area.
3. Although the current result is an upward trend, the process has been characterized by significant ups and downs, with each initial move ranging from approximately $60 to $80.
So, regardless of whether you are long or short, regardless of the direction, at this moment, timing is more important than direction. Once confirmed, To determine a trigger, the first consideration is at least $60-80. Within this range, stick to one direction. If it's right, reap the rewards; if it's wrong, exit. Regardless of whether you're long or short, don't dwell on it.
The current market trend is extremely chaotic. In this chaotic situation, perseverance is more important than choice.
In summary, for gold today, Thursday, focus on the 4200 mark as a spatial boundary. From this boundary, we can see a range of $40 above and below.
Two key resistance levels: the upper limit of the 4220-4225 channel and the equally spaced upper limit of the profit margin at 4240-4242.
Using these two levels as resistance, we can see downward pressure on the price, looking for the 4200 area.
If it falls below 4200, Two key support levels are moving downward:
First, 4180, a support point that was repeatedly consolidated in the US market last night. Second, 4165-4160, the bottom of yesterday's sharp drop in the European market.
Of course, if the price does fall to the second support level, it will be easy to find the lower limit of the small channel at 4140, which is also yesterday's low.
Based on this idea, the European market price met expectations. Under pressure from 4242, a decline to 4203 helped to profit from the short position. The rebound continued, but the price slightly exceeded the range.
If the price exceeds the range, then the second confirmed high of 4242-4245 area is still a short position, with a stop loss at 4253 and a target of 4220-4200. If it falls below, look for 4180 and 4165.
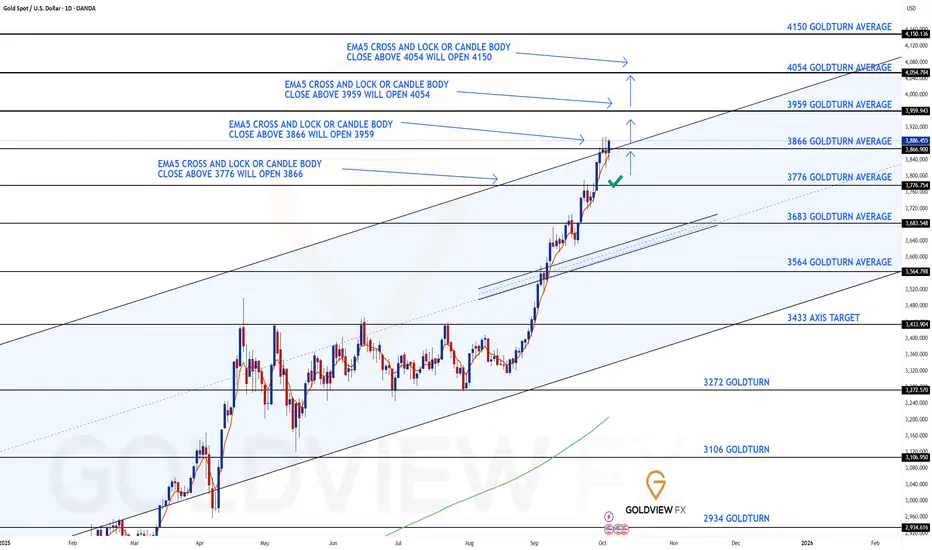
GOLD DAILY CHART ROUTE MAP UPDATEDaily Chart Update – Goldturn Channel Analysis
Hey Traders,
After successfully completing our previous Daily chart projection, we’re excited to share our latest Goldturn Channel update and Daily chart idea, our proprietary method of identifying structural turning points within Golds ascending channel formation.
Price action has now reached the upper boundary of the Goldturn channel, following a precise move to the 3866 target, triggered by the body close above 3776. With a new body close above 3866, we now have the 3959 gap open.
The 3866 channel top area remains a critical inflection point:
A confirmed EMA5 cross and lock above the channel top would strengthen the bullish breakout structure.
Conversely, an EMA5 rejection or close back below this level may indicate a fake out or short-term exhaustion.
On the downside, 3766 now acts as the nearest dynamic support, while 3683 aligns with the channel midline and remains a key structural pivot should deeper correction unfold.
As always, we will keep you all updated with regular updates throughout the week and how we manage the active ideas and setups. Thank you all for your likes, comments and follows, we really appreciate it!
Mr Gold
GoldViewFX
XAUUSD is in buy area!Price level 4205.00 is a strong liquidity sweep showign up a momentum gain on GOLD to reverse from this long term support level gold has started to bounce off the level.
As daily and long term trend continue to be bullish price is highly likely to continue to remian upside with another momentum gain from this support level. A bullish trade is high probable from the long term support level.

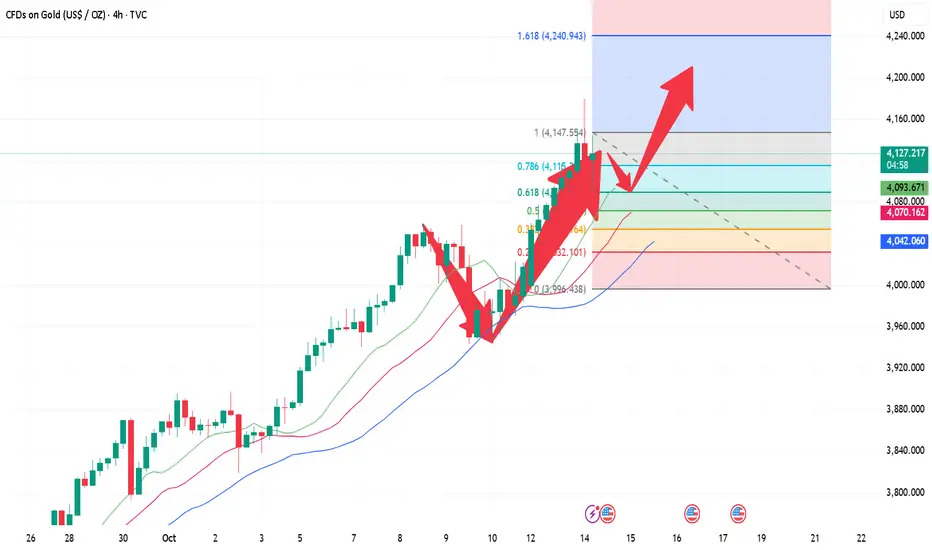
Gold Pulls Back From All-Time High – Correction Looks Limited📊 Market Overview
Gold slightly corrected from its all-time high near $4,239, showing early signs of a short-term pullback, but the overall trend remains bullish.
Despite the correction, fundamental sentiment still supports Gold:
💬 US–China trade tensions and geopolitical risks continue to fuel demand for safe-haven assets.
💵 The US Dollar remains under pressure amid expectations of a Federal Reserve rate cut later this year.
⚖️ Ongoing concerns about a possible US government shutdown further enhance Gold’s attractiveness.
These factors suggest that the current dip is likely a healthy correction within a strong uptrend, not a reversal.
🧠 Technical Structure (MMFLOW Wave View)
Gold has likely completed a minor Wave (V) on the M30 chart, forming a new ATH Zone near 4,239.
Currently, price is unfolding a corrective A–B–C pattern, expected to find support at key liquidity zones before resuming the uptrend.
Our model highlights two potential BUY setups and a short-term SELL scalp opportunity for today’s trading session.
🔑 Key Levels to Watch
🔵 BUY Setup 1
Zone: 4,184 – 4,182
SL: 4,178
TP: 4,188 – 4,192 – 4,196 – 4,200 – 4,210 – 4,220 – ???
🟢 BUY Setup 2 (Deeper Retrace)
Zone: 4,148 – 4,146
SL: 4,140
TP: 4,152 – 4,156 – 4,160 – 4,170 – 4,180 – 4,190 – 4,200
🔴 SELL SCALP Opportunity
Zone: 4,230 – 4,234
SL: 4,238
TP: 4,220 – 4,215 – 4,210 – 4,200 – 4,190 – ???
⚙️ MMFLOW Trading View
📈 Price is currently respecting Wave (A) of the correction.
We expect a possible (B) retracement toward 4,220 – 4,230, followed by (C) decline completing near 4,147 – 4,150 (Fibo 0.618 / CP Buy Zone).
From there, Smart Money may re-enter long positions targeting a fresh liquidity sweep toward the 4,285 SELL ZONE.
In short:
The uptrend remains intact, only a short-term correction is unfolding.
Patience is key — best opportunities will likely appear around 4,150 – 4,180 range.
The structure aligns perfectly with both technical confluence (Elliott + Liquidity Zones) and macro sentiment.
If the market holds above 4,140, Gold could aim for new highs toward 4,285 – 4,300 in the next few sessions.
However, traders should:
✅ Always use Stop Loss — volatility is high near record highs.
✅ Avoid overtrading in narrow pullback zones.
✅ Focus on reaction at key liquidity levels before entering.
⚡ Summary
Gold remains technically bullish with limited downside correction.
Watch for price reaction around 4,184 and 4,147 — both zones represent strong liquidity areas where Smart Money may look to buy again.
After completing this correction, a new impulsive leg up toward 4,285+ could unfold, potentially marking the next all-time high.

XAUUSD – Safe-Haven Flows Continue to Support GoldMarket Context:
Gold has attracted strong buying for the fourth consecutive session, supported by a mix of global risk factors: renewed US–China trade tensions, rising geopolitical uncertainty, and growing fears of a prolonged US government shutdown.
Meanwhile, dovish expectations from the Federal Reserve are keeping the USD under pressure — further enhancing the appeal of gold as a non-yielding safe-haven asset.
During the Asian session, XAU/USD printed a fresh all-time high, with bulls now eyeing a potential extension toward the 4,200 USD/oz region amid escalating global concerns.
Technical Outlook (M30):
Gold continues to respect its ascending channel structure, maintaining dynamic support between 4,167 – 4,154.
As long as price holds above 4,139, the broader trend remains bullish, with the next liquidity target sitting at 4,240 – 4,241.
Key Zones to Watch:
Liquidity Sell Zone: 4,240 – 4,242
ATH Zone / Short-Term Resistance: 4,190 – 4,200
OBS Buy Zone – CP Trendline Support: 4,141 – 4,139
Secondary Buy Zone: 4,114 – 4,112
Trading Plan:
🔹 BUY Zone
Entry: 4.141 – 4.139
SL: 4.134
TP: 4.145 → 4.150 → 4.155 → 4.160 → 4.170 → 4.180
🔹 BUY Zone
Entry: 4.114 – 4.112
SL: 4.106
TP: 4.120 → 4.125 → 4.130 → 4.140 → 4.150
🔹 SELL Zone (Scalp Reaction)
Entry: 4.240 – 4.242
SL: 4.248
TP: 4.235 → 4.230 → 4.225 → 4.220 → 4.210 → 4.200
Summary:
The bullish market structure remains intact as long as price holds above the 4,139 zone.
Watch for potential long opportunities from 4,141 – 4,139, where the confluence of trendline and order block support could trigger fresh demand.
Bulls remain in control, targeting the 4,240 – 4,241 liquidity area in the coming sessions.
📊 What’s your take — will gold break above 4,200 or pause for a correction first?
👉 Follow MMFLOW TRADING for daily market structure insights and institutional-style setups.
🟣 Chart: XAUUSD M30 – Smart Money Flow structure highlighting liquidity pools, CP confluence and key buy/sell zones.

10.16 Gold maintains the upward trend in the Asian session!!!From a multi-period analysis perspective, first observe the monthly chart's rhythm. From a long-term perspective, 3130 represents a watershed in the long-term trend. Above this level, consider a long-term bullish approach. From a weekly perspective, the current bull-bear watershed is 3585. Above this level, consider a medium-term bullish approach. From a daily perspective, focus on the 3997 support area for now. Above this level, consider a short-term bullish approach. From a four-hour perspective, which we've consistently emphasized, support currently lies at 4175. Above this level, consider a short-term bullish approach. On an hourly basis, prices are also currently bullish, but short-term divergence is occurring. Therefore, be mindful of short-term bullish risks in the event of further upward movement. Meanwhile, today's early trading session saw another surge in gains, with the early morning low serving as a watershed for the day. Above this level, consider a short-term bullish approach. Focus on the 4235-4266 area as an upward move.
Gold's Asian session low of 4199.73 marks the intraday watershed. Above this level, bullish momentum is expected to continue. (Also, a divergence is occurring in the hourly chart, so be aware of the risks associated with a short-term rally.)
mrmoney limited XAU/USD scalping ideagold reacted from our hidden 15minute support zone which gave us a high momentum to the the upside

Gold Price Falls from Above $4,200Gold Price Falls from Above $4,200
The XAU/USD chart shows that gold recently climbed above the $4,200 mark for the first time. The upward momentum has been supported by the ongoing US government shutdown, central bank demand (with reports highlighting a sharp rise in reserves at the Reserve Bank of India), and market focus on US–China trade developments.
According to Trading Economics, on Tuesday President Donald Trump accused China of “economically hostile” behaviour, citing a halt in soybean imports, and warned of potential retaliatory measures.
After an 8% gain since the start of October, the market appears overbought, as reflected by the RSI, creating vulnerability to a correction. Today’s sharp drop from record levels (highlighted by the red arrow) may be seen in this context, yet bullish positions remain solid for several reasons.
Analysing gold price action (highlighted with bold lines), we can identify a rising channel that has remained relevant since late September. Signs of strong demand include:
→ persistent moves towards the channel’s upper boundary;
→ a steeper growth channel forming since 10 October;
→ the local $4,155 level shifting from resistance to support.
It is also notable that previous bearish attempts failed — each short-term plunge was followed by a strong rebound. Today’s correction could similarly precede further gains in gold.
Key levels to watch:
→ Psychological resistance at $4,250;
→ Boundaries of the orange channel and the blue median line.
In summary, the gold market currently appears extremely bullish, and it would likely take extraordinary events to reverse this pronounced trend.
This article represents the opinion of the Companies operating under the FXOpen brand only. It is not to be construed as an offer, solicitation, or recommendation with respect to products and services provided by the Companies operating under the FXOpen brand, nor is it to be considered financial advice.

Forex Market Outlook | GU, UJ & Gold Analysis | Oct 13–17In this weekend’s Market Outlook, we break down the big moves from last week and share what to watch for in the coming week (Oct 13–17). We’ll look at GBP/USD, USD/JPY, and XAU/USD side by side, combining fundamentals (news, sentiment, data) with technicals (key price zones and chart setups).
By the end of this video, you’ll understand:
✅Why did the USD gain strength despite the government shutdown?
✅The key levels to watch on GBP/USD, USD/JPY, and Gold.
✅How upcoming events like Powell’s speech, UK jobs data, and U.S. inflation could move the markets.
⚠️ This isn’t a signal service; it’s my personal trading map, shared to help you think and trade smarter.
🔔 I’ll also be dropping updates in the comments section as the week unfolds, so keep an eye there for my real-time thoughts.

GOLD (XAUUSD): The Next Resistances
Here are the next potentially significant psychological resistances
too look at on Gold for pullback.
Resistance 1: 2198 - 2203 area
Resistance 2: 2248 - 2253 area
Resistance 3: 2298 - 2303 area
In case of a start of a bearish move,
consider the underlined supports for buying.
❤️Please, support my work with like, thank you!❤️
I am part of Trade Nation's Influencer program and receive a monthly fee for using their TradingView charts in my analysis.

Gold as a Safe Haven Asset During Market Uncertainty1. The Historical Role of Gold as a Store of Value
Gold’s reputation as a safe haven asset is deeply rooted in history. Long before modern currencies were created, gold was used as money due to its rarity, durability, and universal acceptance. Empires and civilizations—from the Romans to the Chinese—recognized its intrinsic value. Unlike paper currencies, which can lose value due to inflation or political manipulation, gold has maintained its purchasing power over centuries. This enduring legacy has built investor confidence, making gold the ultimate hedge against economic collapse or monetary instability.
2. Gold’s Relationship with Inflation and Currency Devaluation
One of the key reasons investors flock to gold during uncertainty is its ability to preserve value during inflationary periods. When central banks print excess money or economies experience hyperinflation, the real value of currency declines. Gold, on the other hand, cannot be printed or artificially inflated. Its supply grows slowly through mining, keeping its scarcity intact. Historically, during times of high inflation—such as the 1970s oil crisis—gold prices surged as investors sought protection from declining fiat currency values.
3. Gold’s Performance During Financial Crises
Gold tends to perform strongly during financial market crises. For instance, during the 2008 Global Financial Crisis, stock markets around the world plummeted, yet gold prices surged from around $700 to over $1,200 per ounce in the following years. Investors shifted their capital from volatile equities and collapsing real estate markets into gold as a safer store of wealth. Similarly, during the COVID-19 pandemic in 2020, when uncertainty and market panic dominated, gold reached a record high of over $2,000 per ounce, reinforcing its role as a safe haven asset in times of chaos.
4. Gold’s Role in Portfolio Diversification
In investment strategy, diversification is key to managing risk. Gold often acts as an effective hedge because it has a low or even negative correlation with traditional asset classes like equities or bonds. When markets are in turmoil, stocks often decline, but gold tends to rise or remain stable. By including gold in a portfolio, investors can reduce volatility and overall risk exposure. Institutional investors, mutual funds, and even central banks include gold as a strategic component to ensure portfolio stability during downturns.
5. Gold as a Hedge Against Geopolitical Risk
Geopolitical instability—such as wars, trade conflicts, or political crises—creates uncertainty in global markets. During such times, currencies fluctuate, stock indices decline, and investor confidence weakens. Gold often becomes the preferred asset during these events because it is not tied to any one government or economy. For example, during the Russia-Ukraine conflict in 2022, global demand for gold increased as investors sought refuge from potential currency devaluation and market disruptions. Its universal acceptance makes it a neutral and borderless asset that retains value regardless of political boundaries.
6. Central Bank Policies and Their Impact on Gold
Central banks play a major role in influencing gold prices. When central banks adopt expansionary monetary policies—such as lowering interest rates or increasing money supply—gold prices often rise. Low interest rates reduce the opportunity cost of holding non-yielding assets like gold, making it more attractive to investors. Additionally, when central banks themselves buy gold, it signals trust in its long-term value. In recent years, emerging economies like China, India, and Russia have increased their gold reserves to diversify away from U.S. dollar dependence, strengthening gold’s status as a global reserve asset.
7. Investor Psychology and Market Sentiment
Gold’s appeal is not just economic—it’s psychological. During times of fear or uncertainty, investors instinctively move toward tangible assets that they can trust. Gold’s physical nature and intrinsic value give it emotional security that paper assets lack. This “flight to safety” effect means that when news of market instability spreads, investors collectively buy gold, driving up its price. This psychological factor reinforces the cycle of gold appreciation during uncertain times, as more people seek safety in an asset they perceive as stable and permanent.
8. Gold vs. Other Safe Haven Assets
While gold is the most well-known safe haven asset, others—like the U.S. dollar, Swiss franc, or U.S. Treasury bonds—also attract investors in crises. However, gold holds unique advantages. Unlike currencies, which can be manipulated through monetary policy, gold’s value is independent of any central authority. It is also free from credit risk, meaning it cannot default like bonds. Furthermore, unlike real estate or commodities like oil, gold is highly liquid and portable. This makes it an ideal asset for immediate protection and long-term wealth preservation during global financial stress.
9. Technological and Industrial Demand Supporting Gold Prices
Beyond its financial role, gold has growing industrial and technological applications, especially in electronics, renewable energy, and medical devices. Its conductivity and resistance to corrosion make it a critical material in high-tech industries. This real-world demand adds a fundamental layer of value to gold, ensuring that its price is not solely dependent on investor sentiment. Jewelry demand—especially from countries like India and China—also supports its global market stability. Together, these factors create a strong baseline for gold prices, even when financial markets are calm.
10. The Future Outlook for Gold as a Safe Haven
Looking ahead, gold’s role as a safe haven is expected to remain strong. In a world marked by rising geopolitical tensions, digital currency volatility, and potential economic slowdowns, investors will continue viewing gold as a stabilizing force. The rise of digital gold and gold-backed exchange-traded funds (ETFs) has made it easier for retail investors to participate in the gold market. Moreover, as global debt levels rise and faith in fiat currencies weakens, the demand for gold is likely to persist. Even in an increasingly digital economy, gold’s timeless appeal as a tangible, limited, and universally trusted asset ensures its continued relevance.
Conclusion
Gold’s reputation as a safe haven asset is well-deserved and time-tested. It offers protection against inflation, currency devaluation, market volatility, and geopolitical instability. Its scarcity, universal acceptance, and psychological comfort make it a unique hedge in uncertain times. Whether held by individuals, institutions, or central banks, gold continues to shine as a reliable symbol of stability and security.
In a global economy where uncertainty is the only constant, gold stands as a timeless reminder that true value endures beyond market cycles and monetary systems. For investors seeking long-term security amid financial turbulence, gold remains the ultimate safeguard of wealth.

Gold → Ready for the Next Bullish WaveGold (XAUUSD) continues to gain momentum as shifting global conditions drive investors toward safer assets. The ongoing uncertainty in financial markets, coupled with renewed concerns over U.S. fiscal policy and interest rate adjustments, has strengthened gold’s long-term appeal.
Recent market behavior reflects consistent institutional demand, with traders positioning ahead of potential monetary easing cycles. As confidence in traditional currencies weakens, gold remains a preferred store of value for both investors and central banks.
Structurally, the market is maintaining a healthy uptrend, showing controlled corrections within a broader bullish framework. The latest price movements suggest that momentum is building for another upward phase, possibly targeting new historical zones if global instability persists.
In summary, gold’s outlook stays constructive — supported by both macroeconomic sentiment and steady technical momentum.
How do you see the XAUUSD trajectory evolving — continuation of growth or a major pause ahead?

GOLD 4H CHART ROUTE MAP UPDATE & TRADING PLAN FOR THE WEEKHey Everyone,
Please see our updated 4h chart levels and targets for the coming week.
We are seeing price play between two weighted levels with a gap above at 4041 and a gap below at 3978. We will need to see ema5 cross and lock on either weighted level to determine the next range.
We will see levels tested side by side until one of the weighted levels break and lock to confirm direction for the next range.
We will keep the above in mind when taking buys from dips. Our updated levels and weighted levels will allow us to track the movement down and then catch bounces up.
We will continue to buy dips using our support levels taking 20 to 40 pips. As stated before each of our level structures give 20 to 40 pip bounces, which is enough for a nice entry and exit. If you back test the levels we shared every week for the past 24 months, you can see how effectively they were used to trade with or against short/mid term swings and trends.
The swing range give bigger bounces then our weighted levels that's the difference between weighted levels and swing ranges.
BULLISH TARGET
4041
EMA5 CROSS AND LOCK ABOVE 4041 WILL OPEN THE FOLLOWING BULLISH TARGETS
4099
EMA5 CROSS AND LOCK ABOVE 4099 WILL OPEN THE FOLLOWING BULLISH TARGET
4154
EMA5 CROSS AND LOCK ABOVE 4154 WILL OPEN THE FOLLOWING BULLISH TARGET
4212
BEARISH TARGETS
3978
EMA5 CROSS AND LOCK BELOW 3978 WILL OPEN THE FOLLOWING BEARISH TARGET
3916
EMA5 CROSS AND LOCK BELOW 3916 WILL OPEN THE SWING RANGE
3840
3767
EMA5 CROSS AND LOCK BELOW 3767 WILL OPEN THE SECONDARY SWING RANGE
3689
3632
As always, we will keep you all updated with regular updates throughout the week and how we manage the active ideas and setups. Thank you all for your likes, comments and follows, we really appreciate it!
Mr Gold
GoldViewFX

10.14 Tariffs and interest rate cut expectations resonate!Judging from the current 4-hour chart:
4100 is essentially the current hurdle for gold.
It's also the most important support level today.
Gold opened today in the 4100-4110 range. Although it recently retreated to around 4090, the real-world price still closed above 4110.
If we analyze the trend from last week's low of 3950 to the current 4180 level, we can see that the 618 support level is precisely around 4090.
4090 also happens to be the low point of the recent retracement.
According to wave theory, if the retracement does not exceed 618, new highs are inevitable. If it breaks through 4180 again, the next target may be around 4230.
XAUUSD Analsis todayHello traders, this is a complete multiple timeframe analysis of this pair. We see could find significant trading opportunities as per analysis upon price action confirmation we may take this trade. Smash the like button if you find value in this analysis and drop a comment if you have any questions or let me know which pair to cover in my next analysis.

XAUUSD – Sharp Pullback After Hitting New ATHMarket Context:
Gold has seen a steep intraday drop after hitting a fresh all-time high at 4,179 USD/oz, extending beyond the morning target of 4,170–4,172.
The move likely reflects profit-taking amid broader market caution, as the US Dollar strengthened and GBP fell sharply, indirectly weighing on XAUUSD.
Silver also followed the correction, down over 2%, trading near 51 USD/oz after peaking at 53.60 earlier.
Despite this drop, the overall market sentiment remains defensive — both metals are still up about 2% for the week, suggesting this is a technical retracement, not a full trend reversal.
Technical Outlook (M30):
Price has broken below the short-term rising channel and is now retesting key liquidity areas.
Watch the 4,134 – 4,135 zone for a potential retest (50% pullback) before continuation toward lower buy zones.
End Liquidity Sell Zone: 4,165 – 4,170
Retest Zone (50% Down): 4,134 – 4,135
CP Buy Zone / Fibo 0.618: 4,052 – 4,054
OBS Buy Zone: 4,000 – 4,005
Trading Plan:
🔹 Sell Setup (Correction Play):
Entry: 4,134 – 4,136
Stop Loss: 4,142
Take Profit: 4130 - 4125 - 4120 - 4110 - 4100 - ???
🔹 Buy Setup (Reaction Zone):
Entry 1: 4,052 – 4,054 (Fibo 0.618 Confluence)
Stop Loss: 4,044
Take Profit: 4056 - 4060 - 4065 - 4070 - 4080 - 4090 - ????
Summary:
Gold’s sharp drop after a new ATH signals a short-term correction phase while the broader bullish trend stays intact.
A pullback toward 4,052 or even 4,000 could attract buy-side liquidity before any recovery.
Keep an eye on 4,135 for a potential retest before continuation.
📊 What’s your view — is this just a healthy retracement or the start of a deeper correction?
👉 Follow MMFLOW TRADING for precise intraday setups and structure-based analysis.

XAUUSD Outlook: Bullish Leg in Play, But Patience PaysHello Traders 👋
Hope your week is off to a strong start!
In last week’s analysis, price respected the continuation demand zone—right in line with the bullish sentiment we observed around gold. That zone held beautifully.
Now, price has broken above the Buy Side Liquidity (BSL), forming a fresh bullish leg. However, before jumping into any buy trades, it’s wise to wait for price to mitigate the nearby continuation demand zone and look for confirmation on the lower time frame (LTF) before entering.
Let’s stay patient and let the market come to us. Trade safe and stay disciplined 💪
