XAUUSD Analysis todayHello traders, this is a complete multiple timeframe analysis of this pair. We see could find significant trading opportunities as per analysis upon price action confirmation we may take this trade. Smash the like button if you find value in this analysis and drop a comment if you have any questions or let me know which pair to cover in my next analysis.
Goldtrading

XAUUSD – Wave (4) Pullback Setting Up Wave (5) ExtensionHey Traders,
Gold on the M30 chart is still holding a bullish structure, but the recent push into the upper channel line shows early signs of exhaustion. Here’s my full breakdown and trading plan:
🔍 Technical Overview
Price just completed Wave (3) around 3697.40, tagging the upper trend channel – a natural profit-taking zone.
The 3666–3670 range has been a key pivot/support zone multiple times; I expect a pullback into this area for Wave (4) before another rally.
3657 marks deeper support and the invalidation point for the bullish setup.
If Wave (4) holds, Wave (5) targets 3720–3725.
📈 Key Levels
Type Price Level Notes
Resistance 3695–3700 Wave (3) top + upper channel edge – watch rejection
Support (1) 3666–3670 Primary buy zone for Wave (4)
Support (2) 3657 Strong support & invalidation
Wave (5) TP 3720–3725 Expected Wave (5) extension target
⚙️ Trading Plan
✅ Primary Setup – Buy the Dip (Trend Continuation)
Entry Zone: 3666–3670 (or a brief sweep to ~3657).
Confirmation: Bullish engulfing candle, pin bar, or MACD crossover on M30.
Targets:
TP1: 3695–3700 (prior highs)
TP2: 3720–3725 (Wave (5) projection)
Stop Loss: Below ~3652.
Risk/Reward: ~1:2 to 1:3 depending on entry.
⚠️ Secondary Setup – Countertrend Short
Scenario: Strong rejection again at 3695–3700.
Targets: 3670 → 3657.
Stop Loss: Above ~3703–3707.
Note: This is countertrend and higher risk – take quick profits, small position sizing.
🛡 Risk & Invalidation
A close below 3656 with a break of the lower trend channel invalidates the bullish Wave (5) scenario.
Always risk ≤1–1.5% per trade, wait for confirmation, and don’t chase if price runs without you.
🧭 Final Thoughts
Gold remains in a bullish short-term channel. A healthy pullback into 3666–3670 could provide the perfect entry for the next Wave (5) leg up. Be patient for price action confirmation.
Countertrend shorts are possible on a sharp rejection at 3695–3700, but the main play is buying the dip.
Stay disciplined, trade the levels, and let the market come to you.

Gold hits a new high again, the opportunity to invest has come!Gold's recent performance remains strong, reaching a new all-time high near 3,685, fully demonstrating the dominance of bullish sentiment. Although inflation remains viscous, the market is increasingly confident that the Federal Reserve will cut interest rates this week. Focus is shifting to the extent of the cut and subsequent policy guidance. If the rate cut exceeds expectations, gold may usher in a new round of liquidity-driven gains. If it falls short of expectations, short-term profit-taking may occur, leading to increased volatility.
From a technical perspective, gold has closed higher for several consecutive days, with short-term moving averages aligned in a bullish pattern. The daily and 4-hour charts remain in an upward trend, with the support center continuously shifting upwards. The bullish structure is solid, but the current price is already at a relatively high level. If the upward push fails to break through with significant volume, there is still room for a short-term pullback, and we need to be wary of the possibility of a technical correction. Today's core trading strategy is to primarily buy on dips, supplemented by shorting at high levels. We should participate with the trend and avoid blindly chasing the market. Support below is the 3650-3635 area. If it stabilizes after a pullback, we can arrange long positions in batches, with the initial target around 3680-3685, and then explore the potential for further growth after breaking through the new high. Resistance above is the 3685-3690 area. If the short-term upward push encounters resistance and fails to break through, we can try shorting with a light position, with a stop-loss placed above the resistance level. Enter and exit quickly, and avoid a prolonged battle. The short-term bullish strength and weakness dividing line is the 3630-3620 level. If it breaks below, we should be wary of the risk of a deep pullback.
This week is packed with macroeconomic events, with the Federal Reserve's interest rate decision in particular under scrutiny, potentially amplifying market volatility. We recommend building positions in batches, maintaining strict position management, and setting effective stop-loss and take-profit targets to ensure profit capture while minimizing drawdown risk.
Do you think the Federal Reserve will cut interest rates beyond expectations this time? We welcome your exchange of views. We will also adjust our strategies immediately based on the data to ensure that our trading rhythm keeps pace with the market.

Gold (XAU/USD) –> Bullish Rectangle Pattern BreakoutHello guys!
💥Gold has been consolidating in a bullish rectangle pattern after a strong upward move. This type of pattern usually signals continuation, with price gearing up for the next leg higher.
🔹 Setup:
The rectangle formed around $3680–$3690 support and resistance near $3689.
A clean breakout above $3689 gives the entry signal for the continuation move.
🔹 Targets:
First target: $3705
Second target: $3724
🔹 Stop Loss:
Below the rectangle support ($3674–$3682) to stay protected against a false breakout.
📌 Conclusion:
The bullish rectangle pattern suggests that Gold is preparing for another push higher. A breakout above 3689 opens the path first to 3705, and then to the extended target at 3724.
Disclaimer: As part of ThinkMarkets’ Influencer Program, I am sponsored to share and publish their charts in my analysis.

GOLD ROUTE MAP UPDATEHey Everyone,
Great start to the week with our 1H chart idea playing out as analysed.
We started with our Bullish target 3653 being hit, followed with emA5 cross and lock opening 3678 - This was also hit perfectly completing the setup.
We will now look for a ema56 cross and lock above 3678 for a continuation into 3702 or failure to lock above 3678 will follow with a rejection into the lower Goldturns for support and bounce.
We will keep the above in mind when taking buys from dips. Our updated levels and weighted levels will allow us to track the movement down and then catch bounces up.
We will continue to buy dips using our support levels taking 20 to 40 pips. As stated before each of our level structures give 20 to 40 pip bounces, which is enough for a nice entry and exit. If you back test the levels we shared every week for the past 24 months, you can see how effectively they were used to trade with or against short/mid term swings and trends.
The swing range give bigger bounces then our weighted levels that's the difference between weighted levels and swing ranges.
BULLISH TARGET
3653 - DONE
EMA5 CROSS AND LOCK ABOVE 3653 WILL OPEN THE FOLLOWING BULLISH TARGETS
3678 - DONE
EMA5 CROSS AND LOCK ABOVE 3678 WILL OPEN THE FOLLOWING BULLISH TARGET
3702
EMA5 CROSS AND LOCK ABOVE 3702 WILL OPEN THE FOLLOWING BULLISH TARGET
3727
EMA5 CROSS AND LOCK ABOVE 3727 WILL OPEN THE FOLLOWING BULLISH TARGET
3747
EMA5 CROSS AND LOCK ABOVE 3747 WILL OPEN THE FOLLOWING BULLISH TARGET
3768
BEARISH TARGETS
3622
EMA5 CROSS AND LOCK BELOW 3622 WILL OPEN THE FOLLOWING BEARISH TARGET
3585
EMA5 CROSS AND LOCK BELOW 3585 WILL OPEN THE SWING RANGE
3556
3528
As always, we will keep you all updated with regular updates throughout the week and how we manage the active ideas and setups. Thank you all for your likes, comments and follows, we really appreciate it!
Mr Gold
GoldViewFX

Gold Price Stabilises Ahead of Central Bank DecisionsGold Price Stabilises Ahead of Central Bank Decisions
Following the ECB’s decision last week to leave interest rates unchanged, traders will closely monitor this week’s monetary policy announcements from the US Federal Reserve, the Bank of England, the Bank of Japan, and other central banks from Toronto to Taipei.
As the XAU/USD chart shows today, the gold price has stabilised after its recent record highs, with investors adopting a wait-and-see stance. The ADX indicator is trending lower, suggesting a diminishing directional momentum.
Key Drivers Influencing Gold Prices
Market participants are almost fully convinced that the Federal Reserve will cut rates by a quarter point this week, while also pricing in the likelihood of further reductions next year amid signs of labour market weakness. Lower rates are generally seen as supportive for gold, making it a more attractive asset relative to yield-bearing US Treasuries.
Additional factors underpinning bullish sentiment include:
→ Weakness in the US dollar.
→ Persistent geopolitical tensions.
→ Pressure on the Fed from Donald Trump, who recently attempted to dismiss Board Governor Lisa Cook.
→ Central bank gold purchases.
On the other hand, profit-taking could dampen demand. Nevertheless, gold prices remain elevated.
Technical Analysis of XAU/USD
Recently, we outlined three reasons why gold’s rally might pause. Since then, the price has consolidated within the $3,610–3,660 range.
This has confirmed the assumption that the median line of the long-term ascending channel is acting as resistance. The steep upward channel (marked with orange lines) has been broken.
What Could Happen Next
→ From a bullish perspective, the resistance levels at $3,510 and $3,575 have been broken to the upside and successfully retested – a sign of strong demand.
→ From a bearish perspective, the candlestick’s long upper shadow, where gold set its record high, reflects aggressive selling pressure.
An attempt to break below the $3,575 support level and the orange dotted line (an additional support trendline plotted beneath the orange channel) could happen.
However, whether this scenario materialises will largely depend on upcoming central bank announcements. Traders should brace for heightened volatility.
This article represents the opinion of the Companies operating under the FXOpen brand only. It is not to be construed as an offer, solicitation, or recommendation with respect to products and services provided by the Companies operating under the FXOpen brand, nor is it to be considered financial advice.

Big events in gold this week!Gold closed with another positive line on the weekly chart. Although it has a long upper shadow line, the overall upward pattern is still solid, the trend has not been destroyed, and it still maintains a strong pattern. The daily level shows a high-level yin-yang cycle consolidation. It has failed to break through the 3660 high in the short term. Therefore, it will temporarily respond with a shock thinking, waiting for another bullish opportunity after the breakthrough. What needs to be paid attention to is that the Federal Reserve’s interest rate decision is about to come this week. The market may usher in a new direction choice, and volatility may intensify. At that time, the market rhythm will be more critical. Pay attention to the 3620-3660 area in the small range of the day. If it can break through, look at the extension space of the large range of 3675-3610. Remind brothers, this week’s trading should pay more attention to rhythm and risk control, avoid blindly chasing ups and downs, wait patiently for the key positions to be confirmed before entering the market accurately, execute high-winning trading plans, and lock profits firmly in the account.For the specific layout and operation rhythm, please refer to the bottom notification I released at the first time to ensure consistent execution and unified thinking, and avoid blindly following the trend and causing unnecessary risks.

Gold Outlook – Short-Term Pullback, Long-Term Strength📑 Gold (XAUUSD) – Market Report
Gold has shown a strong bullish phase over recent weeks after a long consolidation. The market moved from accumulation into expansion, reflecting renewed participation by larger players. This upward momentum indicates strong capital inflows, supported by macroeconomic uncertainty and shifting investor sentiment.
Technically, price has broken out of a prolonged range and established a clear upward trajectory. Market structure suggests that buyers remain in control, though current price levels are showing signs of potential exhaustion, which could trigger short-term corrective moves before the broader trend resumes.
Fundamentally, global economic pressures continue to boost gold’s role as a safe-haven asset. Concerns over inflation, central bank policy adjustments, and currency volatility are keeping investor demand elevated. With global risk sentiment fluctuating, gold is likely to remain an attractive hedge, sustaining its medium-term bullish outlook despite short-term pullbacks.
Conclusion: Gold is in an expansion cycle, supported by both technical momentum and fundamental demand. Short-term corrections are expected, but the broader trajectory remains upward.

XAUUSD Ready for the Next Big Move?XAUUSD Ready for the Next Big Move?
📊 Gold (XAUUSD) Market Report
Gold continues to trade within a strong bullish cycle, supported by both macro fundamentals and technical structure.
From a fundamental perspective, the precious metal remains underpinned by softer U.S. dollar dynamics, moderating bond yields, and persistent safe-haven demand amid global economic and geopolitical uncertainties. Inflationary pressures and the cautious stance of central banks further enhance gold’s role as a defensive asset, keeping institutional interest alive.
On the technical side, the market has shown a clear sequence of bullish impulses following multiple market structure shifts (MSS) and breaks of structure (BOS). Each expansion phase has been driven by strong order flow, with shallow retracements reflecting consistent buyer control. The current leg higher has pushed into an area of potential liquidity grab, suggesting that while the broader trend remains constructive, near-term exhaustion and corrective movement cannot be ruled out.
Taken together, the outlook for gold remains broadly bullish in the medium term, with fundamentals providing a supportive backdrop and technicals confirming momentum. However, traders should be mindful of short-term volatility as the market balances out after recent sharp gains.

GOLD (XAUUSD): Support & Resistance Analysis for Next Week
Here is my latest structure analysis for Gold.
Resistance 1: 3641 - 3674 area
Resistance 2: 3696 - 3704 area
Support 1: 3612 - 3626 area
Support 2: 3559 - 3580 area
Support 3: 3510 - 3521 area
Support 4: 3489 - 3500 area
Consider these structures for pullback/breakout trading.
❤️Please, support my work with like, thank you!❤️
I am part of Trade Nation's Influencer program and receive a monthly fee for using their TradingView charts in my analysis.

GOLD 4H CHART ROUTE MAP UPDATE & TRADING PLAN FOR THE WEEKHey Everyone,
Please see our updated 4h chart levels and targets for the coming week.
We are seeing price play between two weighted levels with a gap above at 3655 and a gap below at 3615. We will need to see ema5 cross and lock on either weighted level to determine the next range.
We will see levels tested side by side until one of the weighted levels break and lock to confirm direction for the next range.
We will keep the above in mind when taking buys from dips. Our updated levels and weighted levels will allow us to track the movement down and then catch bounces up.
We will continue to buy dips using our support levels taking 20 to 40 pips. As stated before each of our level structures give 20 to 40 pip bounces, which is enough for a nice entry and exit. If you back test the levels we shared every week for the past 24 months, you can see how effectively they were used to trade with or against short/mid term swings and trends.
The swing range give bigger bounces then our weighted levels that's the difference between weighted levels and swing ranges.
BULLISH TARGET
3655
EMA5 CROSS AND LOCK ABOVE 3655 WILL OPEN THE FOLLOWING BULLISH TARGETS
3696
EMA5 CROSS AND LOCK ABOVE 3696 WILL OPEN THE FOLLOWING BULLISH TARGET
3738
BEARISH TARGETS
3615
EMA5 CROSS AND LOCK BELOW 3615 WILL OPEN THE FOLLOWING BEARISH TARGET
3583
EMA5 CROSS AND LOCK BELOW 3583 WILL OPEN THE FOLLOWING BEARISH TARGET
3545
EMA5 CROSS AND LOCK BELOW 3545 WILL OPEN THE FOLLOWING BEARISH TARGET
3509
EMA5 CROSS AND LOCK BELOW 3509 WILL OPEN THE SWING RANGE
3458
3409
EMA5 CROSS AND LOCK BELOW 3409 WILL OPEN THE SECONDARY SWING RANGE
3360
3320
As always, we will keep you all updated with regular updates throughout the week and how we manage the active ideas and setups. Thank you all for your likes, comments and follows, we really appreciate it!
Mr Gold
GoldViewFX

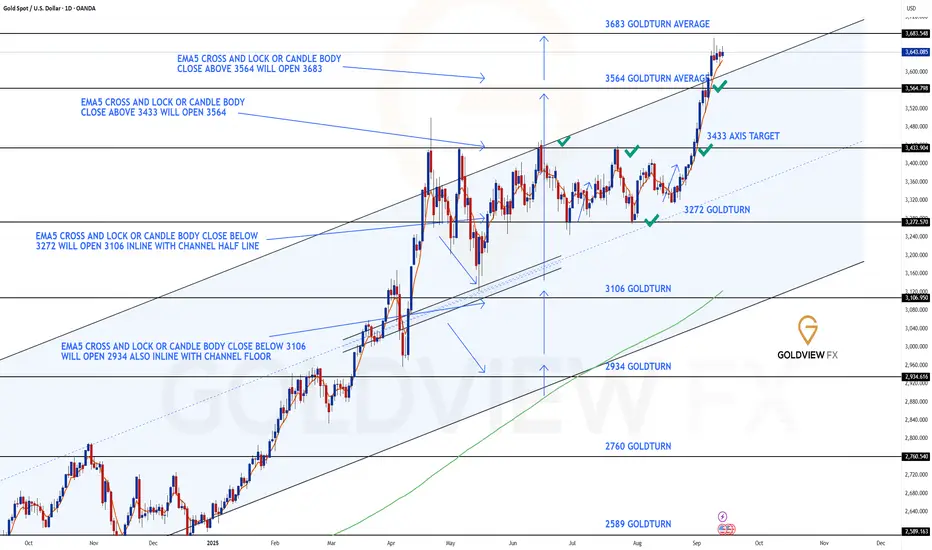
GOLD DAILY CHART ROUTE MAPDaily Chart Update
3564 Target Hit, Fresh Gap at 3683 & Breakout Confirmation
As projected in our previous update, the 3564 target has now been reached perfectly following EMA5 lock confirmation above 3433. This milestone completes the initial breakout structure and validates the bullish momentum sequence laid out earlier.
With 3564 achieved, price action has now opened a long-range gap toward 3683. The EMA5 cross and lock above 3564 provides strong continuation evidence, but we must now monitor whether support can be sustained above the channel top. A successful hold here will confirm continuation higher; however, a break back within the channel would classify this as a fake breakout attempt.
Current Outlook
🔹 3564 Target Reached
Upside momentum played out as expected, with EMA5 lock above 3433 providing early confirmation. The move delivered a clean hit of the 3564 target zone.
🔹 Next Objective – 3683
Momentum now extends toward 3683, with EMA5 lock above 3564 giving weight to this projection. Sustaining price above the channel top remains crucial to validating the next leg higher.
🔹 Breakout Validation Needed
Continuation depends on maintaining support above channel resistance. Failure to hold here risks invalidating the breakout and shifting price back into the prior range.
Updated Key Levels
📉 Support – 3272 (pivotal floor)
📉 Short-Term Supports – 3433 & 3564
📈 Resistance / Next Upside Objective – 3683
Thanks as always for your continued support,
Mr Gold
GoldViewFX
GOLD WEEKLY CHART MID/LONG TERM ROUTE MAPWeekly Chart Update
3659 Target Achieved, Rejection at 3659 & now Range Play Between Key Levels
As projected, price delivered into the 3659 target after securing a weekly body close above 3576, just as anticipated. This completed the next upside step in sequence.
However, despite momentum into 3659, we did not see a candle body close and EMA5 lock above this level. The lack of confirmation left a rejection in place, establishing 3659 as firm resistance while 3576 now acts as immediate support. Price action is currently playing within this range, and a decisive break above or below will determine the next directional move.
Current Outlook
🔹 3659 Target Achieved
The weekly structure unfolded exactly as expected, with the 3576 breakout leading to a clean push into 3659.
🔹 Rejection at 3659
No body close above 3659 leaves this level as strong resistance for now. Without lock confirmation, bullish continuation into 3732 remains unconfirmed.
🔹 Range Play Between 3659 & 3576
We now look for a confirmed break above 3659 to unlock 3732, or a breakdown below 3576 that would risk pulling price back into the prior channel range.
Updated Levels to Watch
📉 Support – 3576 & 3482
Key floors for maintaining bullish structure. A break back below 3576 puts 3482 in play as the next test.
📈 Resistance – 3659 / Next Objective 3732
3659 remains the ceiling. A sustained close above here opens 3732 as the next target zone.
Plan
Price is consolidating between 3659 resistance and 3576 support. The next move depends on which boundary breaks:
Above 3659: Unlocks 3732 with bullish continuation.
Below 3576: Signals rejection and risks a deeper correction into 3482.
Thanks as always for your support,
Mr Gold
GoldViewFX

Best Lot Size for Gold Trading (XAUUSD) Explained
If you trade Gold with fix lot, I prepared for you a simple manual how to calculate the best lot size for your XAUUSD trading account.
Step 1
Find at least the last 10 trades that you took on Gold.
Step 2
Measure stop losses of all these trades in pips
Step 3
Find the trade with the biggest stop loss
In our example, the biggest stop loss is 680 pips
Step 4
Open position size calculator for XAUUSD
Step 5
Input your account size, 1,5% as the risk ratio.
In "stop loss in pips" field, write down the pip value of your biggest stop loss - 680 pips in our example.
Press, calculate.
For our example, the best lot size for Gold will be 0.22.
The idea is that your maximum loss should not exceed 1,5% of your account balance, while the average loss will be around 1%.
❤️Please, support my work with like, thank you!❤️
I am part of Trade Nation's Influencer program and receive a monthly fee for using their TradingView charts in my analysis.

GOLD ROUTE MAP UPDATEHey Everyone,
This is the 1H chart route map we tracked this week and it played out beautifully once again.
We got the expected play between 3613 and 3638, followed by a break above 3638 which re-opened the range to the upside. That move gave the strong push up we were looking for, just short of 3658.
Importantly, 3638 flipped into support and continued to provide precision bounces exactly in line with our dip-buying plans. A great finish to the week and a clear demonstration of how our levels consistently deliver structure and tradeable opportunities.
To recap:
3613 → 3638 gave the initial range.
The break and hold above 3638 confirmed upside continuation.
Price pushed toward 3658, with dips to 3638 giving repeated buy opportunities.
We will now come back Sunday with a full multi timeframe analysis to prepare for next week’s setups, including updated views on the higher timeframes, EMA5 alignments, and structure expectations going forward.
Thanks again for all your likes, comments, and follows.
Wishing you all a fantastic weekend!!
Mr Gold
GoldViewFX

XAUUSD buy again at 3638.08Previous daily price was a stong rejection from this lower price with a long wick candle forming today price started to move again back to the upside with rejection from the support. As weekly close coming, we may see another test of the daily support and may continue with a bullish channel formation.
3638.08 level is one area can look for bullish trade setup for this potential uptrending move in the market.

A pullback is an opportunity, go long decisively!Yesterday, the technical analysis of gold first declined and then rose. It was suppressed below the 3650 mark during the Asian and European sessions and showed a continuous decline. It further accelerated its decline before the European and US sessions, breaking through the 3630 mark, and continued to decline to around 3613 to stabilize and rebound. It rebounded strongly during the US session and finally closed above the 3630 mark with a small negative fluctuation. The overall price still held the 3610 mark, forming a support and stabilization pattern. After the opening of today, gold once again rose and broke through the 3640 mark. In the short term, it has experienced continuous retracements to test the 3610 mark support, which is still valid. The long position at the daily level is continuing well, and it is expected to further impact the previous high of 3675 resistance area. Today, the short-term support below is around 3630-3620, and the important support is 3610. If it falls back to this position during the day, the main bullish trend will remain unchanged. The short-term bullish strong dividing line is 3600. If the daily level stabilizes above this position, the rhythm of falling back to low and long and following the trend will continue. The specific execution plan of the counter-trend short order will be updated as soon as possible according to the real-time trend, and I will remind everyone to respond flexibly to ensure that every step of the operation is carried out under controllable risks. Remember to pay attention in time.
Gold operation strategy: Go long when gold falls back to around 3630-3620, with the target at 3650-3660. Continue to hold if it breaks through.

XAUUSD – CPI Today: Liquidity Sweep Scenario & Trading Plan📊 Market View
Gold (XAUUSD) is sliding under short-term resistance (descending trendline), showing sellers are still in control short-term. On the M30 chart, buy-side liquidity levels are clearly stacked: 3,624 → 3,612 → 3,599 → 3,586.
👉 During the European session, expect a breakdown liquidity sweep toward these support zones before any bullish reaction.
📈 CPI View – US Session
Soft CPI (below expectations) → Weaker USD, lower yields → Gold may bounce strongly from 3,612 / 3,599 / 3,586 and retest trendline/resistance.
Hot CPI (above expectations) → Stronger USD, higher yields → Gold may break 3,612, sweep deeper to 3,599 or 3,586, then recover.
⚠️ High risk of news traps: the first reaction can reverse quickly. Wait for retests + confirmation candles before entering.
🔑 Key Levels
Dynamic Resistance (trendline): 3,643 – 3,646
React Zone FIB: 3,650 – 3,654
OBS Sell Zone: 3,665
Support/Liquidity Zones:
3,624.36 (key zone support BUY)
3,612.60 (CP/React FIB)
3,599.31 (BUY ZONE)
3,586.49 (END LIQUIDITY – BUY ZONE)
📌 Trading Plan
🔴 SELL ZONE: 3,646 – 3,648
SL: 3,652
TP: 3,640 → 3,635 → 3,630 → 3,620 → 3,610 → ???
🔵 BUY SCALP: 3,612 – 3,610
SL: 3,605
TP: 3,616 → 3,620 → 3,625 → 3,630 → ???
🔵 BUY ZONE (Primary): 3,600 – 3,598
SL: 3,592
TP: 3,605 → 3,610 → 3,615 → 3,620 → 3,630 → 3,640 → ???
Backup BUY: (if liquidity sweep deepens) 3,58x
Hard SL: 3,578
❗ If 3,578 breaks, don’t rush to re-buy—CPI volatility can extend moves further.
⚠️ Notes & Risk
Reduce position size around the CPI release.
Always wait for confirmation (pin bar / engulfing / retest) before entering.
Use staggered TPs to lock in profits early.
An M30 close above 3,654 invalidates near-term shorts and opens 3,665.
✅ Summary
Gold could sweep liquidity into the buy zones before bouncing. Trade the reaction: SELL at 3,646–48 on rejection, BUY at 3,612/3,600 on clean bounce, and reserve backup BUY at 3,58x with tight risk.
👉 Follow MMFLOW TRADING for real-time updates and BIGWIN setups during CPI volatility.

GOLD ROUTE MAP UPDATEHey Everyone,
This is the 1H chart route map we tracked this week - played out beautifully to completion.
After hitting 3658, we saw no further EMA5 cross and lock, which led to the rejection. As expected, the lower Goldturns acted as support, giving us the planned dip-buying opportunities.
First, 3638 held as support with multiple bounces.
Then we got a cross-and-lock break below 3638, which opened 3613.
That target was hit and provided a support bounce back into 3638 today.
Right now, price action is playing between 3613 and 3638. An EMA5 cross and lock at either level will determine the next range.
We will keep the above in mind when taking buys from dips. Our updated levels and weighted levels will allow us to track the movement down and then catch bounces up.
We will continue to buy dips using our support levels taking 20 to 40 pips. As stated before each of our level structures give 20 to 40 pip bounces, which is enough for a nice entry and exit. If you back test the levels we shared every week for the past 24 months, you can see how effectively they were used to trade with or against short/mid term swings and trends.
As always, we will keep you all updated with regular updates throughout the week and how we manage the active ideas and setups. Thank you all for your likes, comments and follows, we really appreciate it!
Mr Gold
GoldViewFX

Pay attention to the low-buying opportunities above 3630.Gold ultimately broke through the trendline, breaking out of its current high near 3657. During the European trading session, it fluctuated upward between 3648 and 3640. Therefore, if the price doesn't retreat below 3630 before the European session, the probability of an upward breakout will increase in this volatile upward trend. Therefore, the European session's lowest retracement near 3640 is a key bullish target for a second leg higher.
Gold operation suggestion: go long around 3640-3630, target at 3660-3675.

XAUUSD – PPI Ahead: Key Liquidity Levels & Trading Plan🚀 MMFLOW TRADING
Market View:
After yesterday’s sharp drop where sellers dominated the liquidity zone, gold (XAUUSD) is now recovering from 362x → 364x during the Asian session. In the short term, price may range between 362x–365x in Asia/Europe before going sideways to await the PPI release in the US session.
Today’s PPI is expected at 0.3% vs 0.9% previous, signalling cooling inflation. However, actual data could surprise higher – often creating a “news trap”. From a technical view, gold may need to revisit 360x liquidity before resuming its uptrend ahead of CPI & the upcoming FED meeting.
👉 In short: Structure remains bullish, but short-term liquidity sweeps are likely before any continuation move.
Key Levels:
Resistance: 3647 – 3654 – 3665 – 3674 – 3704
Support: 3635 – 3613 – 3600 – 3586
Trading Plan:
🔵 BUY Zone: 3600 – 3598
SL: 3592 (or tighter at 3580)
TP: 3605 → 3610 → 3615 → 3620 → 3630 → 3640 → 3650+
🔴 SELL Zone: 3703 – 3705
SL: 3710
TP: 3698 → 3694 → 3690 → 3680 → 3670 → 3660+
Summary:
✅ Gold remains in an uptrend, but may retest 360x liquidity before heading higher.
✅ PPI today & CPI tomorrow could act as a “news trap” – caution is required.
👉 Watch the key levels and follow MMFLOW TRADING for real-time updates & BIGWIN setups!

GOLD WEEKLY CHART MID/LONG TERM ROUTE MAPWeekly Chart Update
Please see update on our weekly chart idea.
Sunday we stated that we had the weekly body close above the channel top at 3576 and now opened the door to the larger 3659 long-term gap target.
- this target is now complete
We will now look for a close above 3659 for a continuation or failure to lock will follow with a rejection into lower levels for support.
🔹 Range Support Levels
3576 and 3482 now act as layered support levels to keep the bullish case intact within this range.
Updated Levels to Watch
📉 Support – 3482 & 3576
Key supports for this new range. Holding above 3576 strengthens the case for continuation toward 3659. A failure back below 3576 puts 3482 into play as the next defensive level.
📈 Resistance – 3732
This becomes the next upside objective if structure holds above 3659.
Thanks as always for your support,
Mr Gold
GoldViewFX

GOLD 4H CHART ROUTE MAP UPDATEHey Everyone,
This is a follow up update on our 4H chart idea that we shared Sunday stating that we still had the final gap in the range left.
EMA5 cross and cross and lock above 3561 left 3615 open.
- This target was hit this week now completing our 4H chart idea.
Keep an eye out for our NEW 4H chart idea with updated levels and route map.
BULLISH TARGET
3424 - DONE
EMA5 CROSS AND LOCK ABOVE 3424 WILL OPEN THE FOLLOWING BULLISH TARGETS
3499 - DONE
EMA5 CROSS AND LOCK ABOVE 3499 WILL OPEN THE FOLLOWING BULLISH TARGET
3561 - DONE
EMA5 CROSS AND LOCK ABOVE 3561 WILL OPEN THE FOLLOWING BULLISH TARGET
3615 - DONE
As always, we will keep you all updated with regular updates throughout the week and how we manage the active ideas and setups. Thank you all for your likes, comments and follows, we really appreciate it!
Mr Gold
GoldViewFX
