GOLD ROUTE MAP UPDATEHey Everyone,
We are still seeing price action within the retracement range. The full gap below at 3329 remains open from the previous cross-and-lock, and we now have another cross-and-lock confirming this.
We expect a bounce at this level unless we see a further cross-and-lock below 3329, which would open the swing range. Until then, we also expect this level to provide a reaction.
We will keep the above in mind when taking buys from dips. Our updated levels and weighted levels will allow us to track the movement down and then catch bounces up.
We will continue to buy dips using our support levels taking 20 to 40 pips. As stated before each of our level structures give 20 to 40 pip bounces, which is enough for a nice entry and exit. If you back test the levels we shared every week for the past 24 months, you can see how effectively they were used to trade with or against short/mid term swings and trends.
The swing range give bigger bounces then our weighted levels that's the difference between weighted levels and swing ranges.
BULLISH TARGET
3403
EMA5 CROSS AND LOCK ABOVE 3403 WILL OPEN THE FOLLOWING BULLISH TARGETS
3422
EMA5 CROSS AND LOCK ABOVE 3422 WILL OPEN THE FOLLOWING BULLISH TARGET
3439
BEARISH TARGETS
3377 - DONE
EMA5 CROSS AND LOCK BELOW 3377 WILL OPEN THE FOLLOWING BEARISH TARGET
3354 - DONE
EMA5 CROSS AND LOCK BELOW 3354 WILL OPEN THE FOLLOWING BEARISH TARGET
3329
EMA5 CROSS AND LOCK BELOW 3329 WILL OPEN THE SWING RANGE
3304
3281
As always, we will keep you all updated with regular updates throughout the week and how we manage the active ideas and setups. Thank you all for your likes, comments and follows, we really appreciate it!
Mr Gold
GoldViewFX
Goldtrading

GOLD ROUTE MAP UPDATEHey everyone,
Another PIPTASTIC day on the charts today with our chart idea playing out as analysed.
The retracement range continued to provide support once again, allowing us to buy dips, inline with our plans.
We’re now range-bound between 3354 and 3377.
As long as 3354 holds, we can expect continued bounces, tracking the movement upward.
We will keep the above in mind when taking buys from dips. Our updated levels and weighted levels will allow us to track the movement down and then catch bounces up.
We will continue to buy dips using our support levels taking 20 to 40 pips. As stated before each of our level structures give 20 to 40 pip bounces, which is enough for a nice entry and exit. If you back test the levels we shared every week for the past 24 months, you can see how effectively they were used to trade with or against short/mid term swings and trends.
The swing range give bigger bounces then our weighted levels that's the difference between weighted levels and swing ranges.
BULLISH TARGET
3403
EMA5 CROSS AND LOCK ABOVE 3403 WILL OPEN THE FOLLOWING BULLISH TARGETS
3422
EMA5 CROSS AND LOCK ABOVE 3422 WILL OPEN THE FOLLOWING BULLISH TARGET
3439
BEARISH TARGETS
3377 - DONE
EMA5 CROSS AND LOCK BELOW 3377 WILL OPEN THE FOLLOWING BEARISH TARGET
3354 - DONE
EMA5 CROSS AND LOCK BELOW 3354 WILL OPEN THE FOLLOWING BEARISH TARGET
3329
EMA5 CROSS AND LOCK BELOW 3329 WILL OPEN THE SWING RANGE
3304
3281
As always, we will keep you all updated with regular updates throughout the week and how we manage the active ideas and setups. Thank you all for your likes, comments and follows, we really appreciate it!
Mr Gold
GoldViewFX

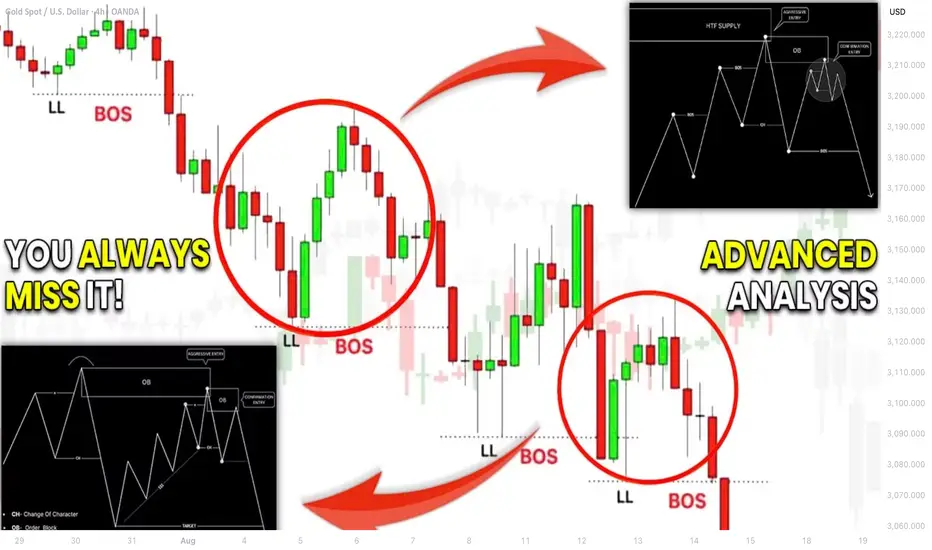
How to Do Structure Mapping with Multiple Time Frames Analysis
If you think that structure mapping is not efficient for profitable trading, you get it wrong .
What newbies traders always miss is that structure mapping works effectively only with multiple time frame analysis.
In this article, I will show you how you can build profitable trading plans and accurate predictions on forex market with structure mapping alone.
Learn top-down analysis secrets and how to map structure properly in Smart Money Concepts SMC ICT.
In order to effectively use structure mapping for scalping, day trading and swing trading , always start it from higher time frames.
Examine my complete structure mapping on USDJPY forex pair on a daily time frame.
You can see that first, the pair was trading in a strong bearish trend.
Then, we had a confirmed bullish reversal with Change of Character.
After that, the market started an extended consolidating movement, not being able to update the highs.
And finally, the last bullish wave managed to update a high , confirming a completion of a consolidation and a resumption of a bullish trend.
Structure mapping reveals that USDJPY is now bullish on a daily and the last bearish movement is a correction in uptrend.
We can expect a start of a new bullish wave soon.
To understand when exactly it is going to happen, you will need to dive your analysis deeper .
You should start structure mapping on lower time frames.
And you should execute a price action analysis there in relation to your structure mapping on a higher time frame.
4H time frame structure mapping will reveal a price action within the last bearish move that we spotted on a daily.
We see that the market is trading in a bearish trend and the price started a local correctional movement after a formation of the last low.
4h time frame structure mapping provided a detailed intra week perspective.
Hourly time frame analysis, we reveal hidden intraday trends that will unveil more insights.
And why are we doing all that?
Remember that big waves always start from minor reversals.
The earlier you are able to find strong confirmations, the earlier you will open a trading position and the more profits you will make.
On an hourly time frame, our structure mapping shows that the market is already bullish. A bearish trend that USDJPY followed is already violated, and the price is updating the highs.
Following our analysis, the only thing that we need to confirm a start of a bullish trend is a confirmed trend reversal and a change of character on a 4H time frame.
It will validate an intra week bullish trend.
We will need the price to break the underlined blue resistance based on the last lower high in a bearish trend.
That will provide an accurate signal for us to buy.
And we can anticipate a rise a least to a current daily higher high then.
When you do structure mapping on forex market, never forget to do that on multiple time frames. Multiple perspectives and short-term/mid-term/long-term projections will help you to build a more efficient trading plan.
Remember that you can expand your structure mapping even for minute time frames. It will provide a unique perspective for scalping forex.
❤️Please, support my work with like, thank you!❤️
Market Analysis: Gold Pulls BackMarket Analysis: Gold Pulls Back
Gold price started a fresh decline below $3,380.
Important Takeaways for Gold Price Analysis Today
- Gold price climbed higher toward the $3,410 zone before there was a sharp decline against the US Dollar.
- A key bearish trend line is forming with resistance near $3,355 on the hourly chart of gold.
Gold Price Technical Analysis
On the hourly chart of Gold at FXOpen, the price climbed above the $3,380 resistance. The price even spiked above $3,400 before the bears appeared.
A high was formed near $3,409 before there was a fresh decline. There was a move below the $3,380 pivot level. The bears even pushed the price below the $3,350 support and the 50-hour simple moving average.
It tested the $3,330 zone. A low has formed near $3,331 and the price is now consolidating losses near the 23.6% Fib retracement level of the downward move from the $3,409 swing high to the $3,331 low.
Immediate resistance on the upside is near a bearish trend line at $3,355 and the 50-hour simple moving average. The next major hurdle is near the 50% Fib retracement level.
The main barrier for the bulls could be near the $3,380 level, above which the price could test the $3,400 zone. Any more gains might call for a move toward $3,410. An upside break above $3,410 could send Gold price toward $3,425.
Initial support on the downside is near $3,330. The next key level is $3,320. If there is a downside break below $3,320, the price might decline further. In the stated case, the price might drop toward the $3,300 zone.
This article represents the opinion of the Companies operating under the FXOpen brand only. It is not to be construed as an offer, solicitation, or recommendation with respect to products and services provided by the Companies operating under the FXOpen brand, nor is it to be considered financial advice.

EURUSD GBPUSD and DXY Analysis todayHello traders, this is a complete multiple timeframe analysis of this pair. We see could find significant trading opportunities as per analysis upon price action confirmation we may take this trade. Smash the like button if you find value in this analysis and drop a comment if you have any questions or let me know which pair to cover in my next analysis.

GOLD ROUTE MAP UPDATEHey everyone,
Following up on yesterday’s update for our 1H chart route map:
The key retracement range continued to provide support, and we saw the reactionary bounce we expected.
Right now, we’re range-bound between 3329 and 3354.
As long as 3329 holds, we can expect continued bounces, tracking the movement upward.
We will keep the above in mind when taking buys from dips. Our updated levels and weighted levels will allow us to track the movement down and then catch bounces up.
We will continue to buy dips using our support levels taking 20 to 40 pips. As stated before each of our level structures give 20 to 40 pip bounces, which is enough for a nice entry and exit. If you back test the levels we shared every week for the past 24 months, you can see how effectively they were used to trade with or against short/mid term swings and trends.
The swing range give bigger bounces then our weighted levels that's the difference between weighted levels and swing ranges.
BULLISH TARGET
3403
EMA5 CROSS AND LOCK ABOVE 3403 WILL OPEN THE FOLLOWING BULLISH TARGETS
3422
EMA5 CROSS AND LOCK ABOVE 3422 WILL OPEN THE FOLLOWING BULLISH TARGET
3439
BEARISH TARGETS
3377 - DONE
EMA5 CROSS AND LOCK BELOW 3377 WILL OPEN THE FOLLOWING BEARISH TARGET
3354 - DONE
EMA5 CROSS AND LOCK BELOW 3354 WILL OPEN THE FOLLOWING BEARISH TARGET
3329
EMA5 CROSS AND LOCK BELOW 3329 WILL OPEN THE SWING RANGE
3304
3281
As always, we will keep you all updated with regular updates throughout the week and how we manage the active ideas and setups. Thank you all for your likes, comments and follows, we really appreciate it!
Mr Gold
GoldViewFX

Has Gold finally topped?Since December 2024, gold has held above a key diagonal support line (see chart).
On 25 July 2025, price broke below a medium-term diagonal support — and recent action looks more like a break-and-retest than a full recovery.
The Chaikin Money Flow is also showing negative divergence, suggesting buying pressure is weakening even as price tried to push higher. That’s often a warning sign for potential trend reversals.
Could this be the start of a deeper move down, or just a pause before new highs?
What’s your take — has gold topped?

XAUUSD Analysis todayHello traders, this is a complete multiple timeframe analysis of this pair. We see could find significant trading opportunities as per analysis upon price action confirmation we may take this trade. Smash the like button if you find value in this analysis and drop a comment if you have any questions or let me know which pair to cover in my next analysis.

GOLD ROUTE MAP UPDATEHey Everyone,
Once again our chart idea is playing out in true level to level fashion.
We started with our bearish gap hit at 3377, followed with ema5 cross and lock opening 3354, which was also hit perfectly.
We are now seeing price play in the retracement range with 3329 also open for test. We expect reaction on this retracement zone, also keeping in mind the Bullish gap above, inline with our plans to buy dips.
We will keep the above in mind when taking buys from dips. Our updated levels and weighted levels will allow us to track the movement down and then catch bounces up.
We will continue to buy dips using our support levels taking 20 to 40 pips. As stated before each of our level structures give 20 to 40 pip bounces, which is enough for a nice entry and exit. If you back test the levels we shared every week for the past 24 months, you can see how effectively they were used to trade with or against short/mid term swings and trends.
The swing range give bigger bounces then our weighted levels that's the difference between weighted levels and swing ranges.
BULLISH TARGET
3403
EMA5 CROSS AND LOCK ABOVE 3403 WILL OPEN THE FOLLOWING BULLISH TARGETS
3422
EMA5 CROSS AND LOCK ABOVE 3422 WILL OPEN THE FOLLOWING BULLISH TARGET
3439
BEARISH TARGETS
3377 - DONE
EMA5 CROSS AND LOCK BELOW 3377 WILL OPEN THE FOLLOWING BEARISH TARGET
3354 - DONE
EMA5 CROSS AND LOCK BELOW 3354 WILL OPEN THE FOLLOWING BEARISH TARGET
3329
EMA5 CROSS AND LOCK BELOW 3329 WILL OPEN THE SWING RANGE
3304
3281
As always, we will keep you all updated with regular updates throughout the week and how we manage the active ideas and setups. Thank you all for your likes, comments and follows, we really appreciate it!
Mr Gold
GoldViewFX

Will We See a Break Down or a Sharp Rebound to Key Resistance?XAUUSD – Will We See a Break Down or a Sharp Rebound to Key Resistance? | MMFlow Trading 🔥
Market Overview
Gold dropped sharply at the start of the week as profit-taking hit the market and late-week FOMO buyers from last week were stopped out.
Buy-side momentum has clearly slowed, and sellers are waiting for a confirmed breakdown from the rising channel to target lower liquidity zones around 335x and 333x.
At present, price is reacting around the 336x – 337x key support with an H1 long-wick candle showing buying pressure.
Trading Outlook
We need a clear breakdown confirmation (candle close with volume) before executing a short entry.
If price holds and fails to break, we could see a rebound back towards major resistance zones 339x – 340x – 342x.
This week is loaded with high-impact USD data – CPI & PPI – both strong inflation indicators that could put short-term pressure on gold if data comes out USD-positive.
📌 Trading Plan
BUY SCALP
Entry: 3353 – 3351
Stop Loss: 3345
Targets: 3358 → 3362 → 3366 → 3370 → 3375 → 3380
BUY ZONE
Entry: 3332 – 3330
Stop Loss: 3325
Targets: 3336 → 3340 → 3345 → 3350 → 3360 → 3370 → 3380
SELL SCALP
Entry: 3394 – 3396
Stop Loss: 3400
Targets: 3390 → 3385 → 3380 → 3370 → 3360
SELL ZONE
Entry: 3425 – 3427
Stop Loss: 3430
Targets: 3420 → 3415 → 3410 → 3405 → 3400 → 3390 → 3380
⚠ Risk Management Notes
This is a high-impact news week – expect false breakouts before and after CPI/PPI releases.
Avoid oversized positions into news; keep risk tight.
If price breaks above 3430 with strong volume, the current sell setup is invalid → wait for a new market structure before re-entering.
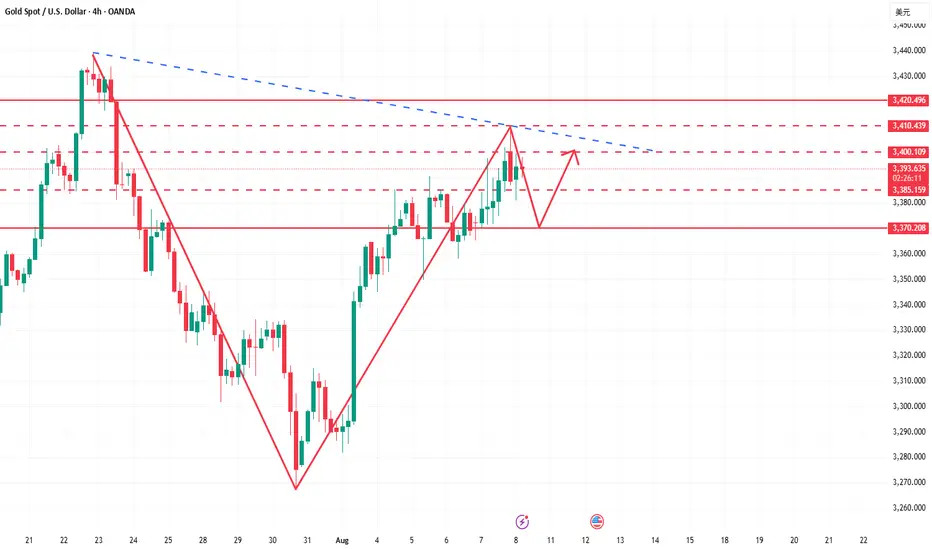
Golden opportunities are not hard to grasp.Gold Market Forecast for Next Week: Gold News Analysis: The US dollar strengthened on Friday, but it is poised for a weekly decline as weak economic data led traders to price in the possibility of more interest rate cuts this year. Investors also assessed US President Trump's Federal Reserve nominations. Gold prices experienced a roller-coaster week from August 4th to 8th, particularly during the past two trading days, when reports of gold bar tariffs sparked market panic. Despite the White House's eventual clarification of the reports, gold prices remained near the peak of uncertainty, hovering around $3,400. Gold prices tested the $3,400 mark several times this week, but despite increasing expectations of a Fed rate cut and Trump's nomination of dovish Fed officials, prices remained above that level. Until Friday's news of gold bar tariffs, gold prices surged above the $3,400 mark, reaching a high of $3,409, the highest level since July 24th. Following the panic caused by the gold bar tariffs, and despite the US clarification of the reports, analysts and retail investors remain bullish on gold prices for next week. Next week, gold prices will focus on the meeting between Trump and Putin, as well as speeches by several Federal Reserve officials on the economic outlook, and the release of the July unadjusted CPI annual rate.
Gold Technical Analysis: Looking at the current gold price trend, after Friday's pullback and negative close, will gold prices continue to decline next week, or will they rebound and rise? I believe the former is unlikely. The possibility of a new low exists, but it is low. Several attempts at the 3380 support level have failed to break. First, looking at recent price trends, gold prices have continued to rise, with higher highs and lower lows, indicating that the 3268 support level is valid. After rebounding to 3409, it began to fall, closing near 3397, demonstrating the 3380 support level and the strength of bullish sentiment. This suggests that gold prices are currently range-bound at a high level. However, given that the support level remained intact and the price closed above it, the possibility of gold prices breaking below 3380 next week is ruled out. Gold prices failed to break below 3380 on Friday as expected, and the overall trend of rising, falling, and closing lower shows that bulls still have the upper hand. However, I think it is not advisable to conclude that bulls will control the market next week. Although bulls have repeatedly tested 3410 without success, the decline has not been strong. In other words, if the bulls were truly strong, there would be no decline the next day, and the opening of next week should continue to rise. However, the current gold price has not only slowed down its rise, but also shown signs of decline, which means that bears are still holding the 3410 resistance level.
Based on the above, we recommend a low-to-long strategy for early next week, supplemented by high-to-short strategies. Regarding support, watch out for 3380. After yesterday's repeated dips, this will become a key defensive point for bulls at the beginning of next week. A test or break of this resistance level is expected. An unexpected break below would disrupt the bullish short-term trend, with a high probability of seeing 3368 or a continuation of the decline to the 3350 area. However, we prefer a move higher above 3380. Regarding resistance, watch out for the 3410 area. Although this area is at 0.382, the dividing line between 3268 and 3500, and also represents resistance from Friday's high, after adjustments and with bullish momentum, the probability of a breakout is increasing. Therefore, we recommend focusing on the 3343 area, which provides strong resistance from the previous high and also represents the dividing line at 0.236. Upon first approaching or touching this area, try to enter a medium-term short position. On the whole, the short-term operation strategy for gold next week is recommended to focus on shorting on rebounds and long on pullbacks. The short-term focus on the upper side is the 3410-3420 line of resistance, and the short-term focus on the lower side is the 3380-3370 line of support.

XAUUSD (Gold) price is ranging between 3248-3428 from April 2025XAUUSD (Gold) price is ranging between 3248-3428 from April 2025 to date, 11th August 2025.
Key level for selling 3380-3428 (before placing an order, must watch the daily candles and H4 for better understanding).
Gold overall has strong bullish momentum. In my view, gold is consolidating at the levels, but in the coming days, any new geopolitical event or any conflict in any country of the world will lead to more bullish momentum in gold.
As I mark it, buying gold is more safe and profitable in current situations, but keep in mind you must have the up-to-date geopolitical events and economic news.
If the price gets ranged and touches 3355, and you see any rejection candles after that and a strong confirmation candle, then you should place a buy trade with proper stop loss and take profit.

GOLD 1H CHART ROUTE MAP UPDATE & TRADING PLAN FOR THE WEEKHey Everyone,
Please see our updated 1h chart levels and targets for the coming week.
We are seeing price play between two weighted levels with a gap above at 3403 and a gap below at 3377. We will need to see ema5 cross and lock on either weighted level to determine the next range.
We will see levels tested side by side until one of the weighted levels break and lock to confirm direction for the next range.
We will keep the above in mind when taking buys from dips. Our updated levels and weighted levels will allow us to track the movement down and then catch bounces up.
We will continue to buy dips using our support levels taking 20 to 40 pips. As stated before each of our level structures give 20 to 40 pip bounces, which is enough for a nice entry and exit. If you back test the levels we shared every week for the past 24 months, you can see how effectively they were used to trade with or against short/mid term swings and trends.
The swing range give bigger bounces then our weighted levels that's the difference between weighted levels and swing ranges.
BULLISH TARGET
3403
EMA5 CROSS AND LOCK ABOVE 3403 WILL OPEN THE FOLLOWING BULLISH TARGETS
3422
EMA5 CROSS AND LOCK ABOVE 3422 WILL OPEN THE FOLLOWING BULLISH TARGET
3439
BEARISH TARGETS
3377
EMA5 CROSS AND LOCK BELOW 3377 WILL OPEN THE FOLLOWING BEARISH TARGET
3354
EMA5 CROSS AND LOCK BELOW 3354 WILL OPEN THE FOLLOWING BEARISH TARGET
3329
EMA5 CROSS AND LOCK BELOW 3329 WILL OPEN THE SWING RANGE
3304
3281
As always, we will keep you all updated with regular updates throughout the week and how we manage the active ideas and setups. Thank you all for your likes, comments and follows, we really appreciate it!
Mr Gold
GoldViewFX

GOLD 4H CHART ROUTE MAP UPDATE & TRADING PLAN FOR THE WEEKHey Everyone,
Please see our updated 4h chart levels and targets for the coming week.
We are seeing price play between two weighted levels with a gap above at 3424 and a gap below at 3371. We will need to see ema5 cross and lock on either weighted level to determine the next range.
We will see levels tested side by side until one of the weighted levels break and lock to confirm direction for the next range.
We will keep the above in mind when taking buys from dips. Our updated levels and weighted levels will allow us to track the movement down and then catch bounces up.
We will continue to buy dips using our support levels taking 20 to 40 pips. As stated before each of our level structures give 20 to 40 pip bounces, which is enough for a nice entry and exit. If you back test the levels we shared every week for the past 24 months, you can see how effectively they were used to trade with or against short/mid term swings and trends.
The swing range give bigger bounces then our weighted levels that's the difference between weighted levels and swing ranges.
BULLISH TARGET
3424
EMA5 CROSS AND LOCK ABOVE 3424 WILL OPEN THE FOLLOWING BULLISH TARGETS
3499
EMA5 CROSS AND LOCK ABOVE 3499 WILL OPEN THE FOLLOWING BULLISH TARGET
3561
BEARISH TARGETS
3371
EMA5 CROSS AND LOCK BELOW 3371 WILL OPEN THE FOLLOWING BEARISH TARGET
3293
EMA5 CROSS AND LOCK BELOW 3293 WILL OPEN THE SWING RANGE
3236
3171
EMA5 CROSS AND LOCK BELOW 3171 WILL OPEN THE SECONDARY SWING RANGE
3089
3001
As always, we will keep you all updated with regular updates throughout the week and how we manage the active ideas and setups. Thank you all for your likes, comments and follows, we really appreciate it!
Mr Gold
GoldViewFX

GOLD WEEKLY CHART MID/LONG TERM ROUTE MAPHey Everyone,
Weekly Chart Update = Gap Completed, Levels Playing Out Perfectly
Just a quick follow up on the ongoing weekly structure, the precision in level respect continues to be impressive, with price action unfolding exactly as we’ve been mapping.
After the previous bounce from 3281, price moved cleanly back up and completed the gap at 3387 last week, exactly as projected in last weeks post. This time, we now have a candle body close above 3387, which changes the dynamic and leaves 3482 open as a long term upside target. An EMA5 lock from here would further confirm the breakout potential.
Updated Structural Notes:
🔹 3281 Support Holds Again
Textbook reaction. Once again, 3281 provided the perfect launch point, reinforcing its strength as a key weekly pivot.
🔹 Gap at 3387 Completed
Price didn’t just revisit 3387, it closed above it on the weekly candle body. This shifts the bias toward potential breakout continuation rather than another immediate rejection.
🔹 3482 Now on the Radar
With 3387 cleared on a closing basis, the next major upside objective becomes 3482, aligning with the broader channel structure and unfilled weekly target. EMA5 confirmation on the long side could accelerate this move.
Updated Levels to Watch:
📉 Support – 3281
Key long-term pivot and buy zone. As long as this holds, dips remain constructive.
📈 Resistance Turned Support – 3387
Now potentially acting as a base. Watching retests here for hold confirmation.
📈 Upside Target – 3482
Primary long-term resistance now in focus if 3387 support holds and momentum sustains.
Plan:
The breakout above 3387 opens a new chapter for this range. We now watch for confirmation that 3387 has flipped to support. Holding here keeps 3482 firmly in play, while any decisive break back below could send us rotating toward 3281 again. Structure still leads, but bias shifts bullish with this weekly close.
Thanks as always for your continued support.
Mr Gold
GoldViewFX

GOLD (XAUUSD): Support & Resistance Analysis For Next Week
Here is my latest support & resistance analysis for Gold
Support 1: 3380 - 3390 area
Support 2: 3327 - 3358 area
Support 3: 3246 - 3275 area
Resistance 1: 3431 - 3450 area
With a high probability, the market will continue rising to Resistance 1.
❤️Please, support my work with like, thank you!❤️
I am part of Trade Nation's Influencer program and receive a monthly fee for using their TradingView charts in my analysis.

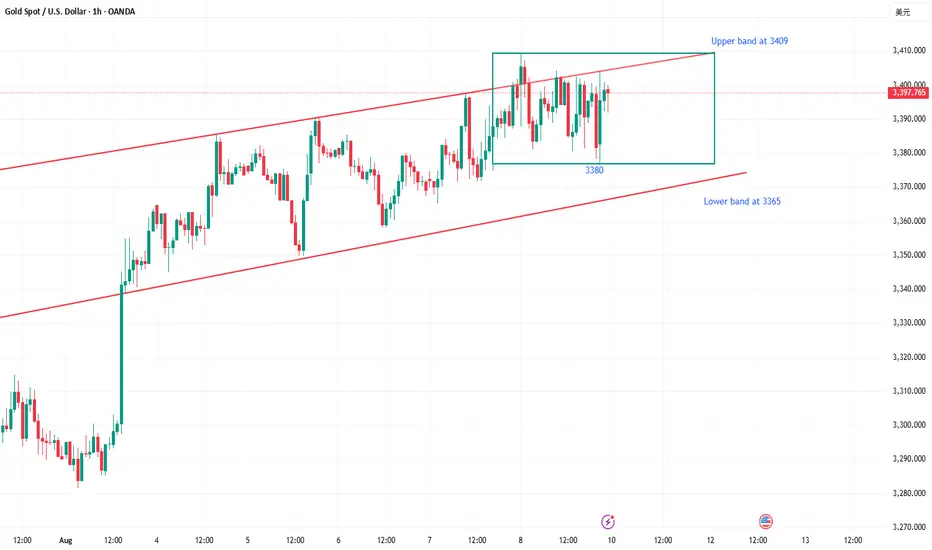
It’s that simple to catch the golden trend.On Friday, gold did not break through the highs or the bottoms, and maintained the range of 3400 to 3380, which was in line with our expectations. In the analysis layout on Friday, I made it clear that I would short at the pressure of 3400 during the day, and go long at the support near 3380 before and after the US market, with an overall gain of 580pips. The points were accurate and there was no error. It was proven by strength that in this market, as long as you don’t chase orders, it is relatively easy to make some profits. Don’t always think about betting on the breakout of the market. Wait for the breakout before doing anything. Just do well in the present. It's better to miss than to do it wrong. The key is how you choose. Stability comes first.
Gold continued to close positively on the weekly chart this week, and after hitting the bottom at 3368 and rebounding, it rebounded with large volume. It is in the process of gradually touching the upper track of the range. Normally, there is still room above, and the range pressure is at 3450. Therefore, we will continue to maintain a bullish mindset next week. In the daily cycle, it fluctuated and washed out repeatedly on Friday, and finally closed with a negative cross star. In the short term, it will maintain operation in the small range of 3409-3380. In terms of operation, continue to go high and buy low before the range is broken, and follow the trend after the breakthrough; an upward breakthrough can be seen at 3425 and 3450, and a downward breakthrough can be seen at 3365 and 3345. For the specific operation rhythm, pay attention to the real-time notification at the bottom.
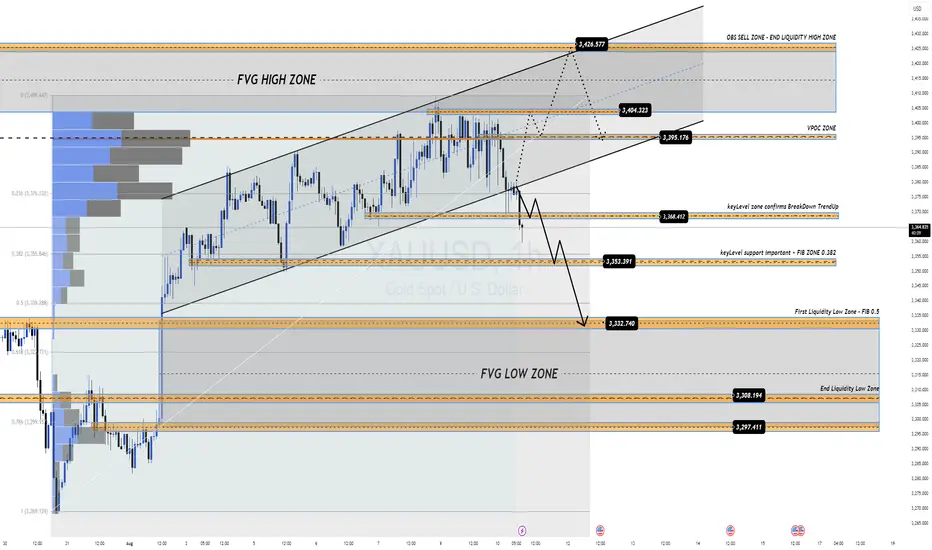
XAUUSD Weekly Plan a Liquidity Clean-Up?XAUUSD Weekly Plan – The Final Bullish Push Before a Liquidity Clean-Up?
Are you ready for a high-volatility week?
Last week, Gold continued to move steadily inside its bullish channel, reaching the FVG High Zone and pushing towards the strong resistance cluster at 3426–3428 (OBS Sell Zone).
The bullish structure on H2–H4 remains intact, but as price enters the distribution zone, candles are tightening, and volume is fading — a clear sign that buying pressure is weakening.
Macro Backdrop – What’s on the Calendar?
This week is packed with high-impact USD data:
CPI (Aug 12) – Major inflation reading, key driver for USD & Gold.
PPI (Aug 14) – Producer inflation, often a leading indicator for CPI trends.
Unemployment Claims (Aug 14) – Short-term labour market indicator.
💡 Expectations:
CPI & PPI are forecast to improve compared to last month.
If confirmed, this could trigger a sharp Gold pullback as USD strengthens.
However, a weak CPI/PPI could give Gold one last bullish spike before reversal.
Technical Outlook
The H2 bullish channel is well-defined.
The top of the channel aligns with the FVG High Zone — a key area for big player sell limits and profit-taking.
Likely scenario:
Price extends to test 3426–3428 Sell Zone.
Bearish reaction → Channel breakdown.
Retest VPOC 3395–3400 → Drop towards liquidity pools below.
Key Trading Levels
SELL Zone: 3426 – 3428
SL: 3434
TP: 3420 → 3415 → 3410 → 3405 → 3400 → 3395 → 3390 → 3380 → 3370 → 3360
BUY Zone: 3330 – 3328
SL: 3322
TP: 3335 → 3340 → 3350 → 3360 → 3370 → 3380
Risk Management Notes
⚠️ This is a high-risk news week — false breaks are highly possible before & after CPI/PPI.
Avoid holding heavy positions during key data releases.
If price breaks above 3434 with strong volume, bearish scenarios are invalid → wait for a new structure.
📌 Summary:
Primary bias → Sell from 3426–3428, target downside liquidity pools.
Secondary play → Buy from 3330–3328 if liquidity sweep occurs.
Stay disciplined. Manage risk. Don’t get caught in the volatility trap.
— MMFlow Trading

Grasp the trend accurately and have a crazy weekend!After testing the 3380 support level several times in a row today, gold maintained an oscillating upward trend. Today's layout of 3380 repeatedly went long, and 3400 shorts were all successfully closed with profits, with a total profit of 580pips. Currently, gold is oscillating at a high level in the 3404-3380 range. The possibility of a direction choice cannot be ruled out in the evening. If the market continues to be bullish in the evening, it is necessary to pay attention to whether the price will fall below 3380 when it tests the support level for the third time. If the support level is effectively broken, it is expected to fall to the key support level of 3370. If the price firmly stands above the 3400 mark, it may continue to test 3410. If there is no breakthrough either above or below, it will still maintain a range of oscillations, and the idea of selling high and buying low will be the main focus.

Bullish momentum weakens, and bearish opportunities emergeThe 4-hour gold chart shows a slow, volatile upward trend. While gradually climbing higher, it has failed to effectively break through key resistance areas. This suggests the market is not in a one-sided bullish trend, but rather in a state of sustained oscillation. Current price momentum is weakening, so it's not advisable to continue chasing higher prices. Today's strategy is to short on rallies, focusing on the key resistance area around 3410-3420. Opportunities are open for short positions. If prices trade within the 3400 range, this would be an ideal entry point for a short position. The main trend is to short on rebounds from higher levels, with strict risk management.
Gold Recommendation: Short in batches between 3400-3415, with a target of 3385-3370.
GOLD (XAUUSD): Road to 3430
Quick update for my yesterday's analysis for Gold.
The price broke through the trend line with a local Break of Structre BoS,
updating an intraday-high.
The road to 3430 is now empty, and the market will most likely
continue rising steadily to that.
❤️Please, support my work with like, thank you!❤️
I am part of Trade Nation's Influencer program and receive a monthly fee for using their TradingView charts in my analysis.

Opportunities only come to those who are preparedThe market expects the probability of the Federal Reserve cutting interest rates in September to be over 70%, with some institutions even predicting as high as 93.6%. Fed officials have recently released dovish remarks. If the rate cut is implemented, it will reduce the opportunity cost of holding gold, which is good for gold prices. The US has imposed tariffs on India and Switzerland, exacerbating global trade tensions and boosting demand for gold as a safe haven. The deadlock in the Iran nuclear talks and the shipping risks in the Red Sea have increased market risk aversion. Focus is on US initial jobless claims data and speeches by Fed officials. If the data is stronger than expected, it may suppress expectations of a rate cut and be bearish for gold. If the US dollar strengthens or geopolitical risks ease, gold prices may come under pressure and fall. Today, gold mainly showed a high-level fluctuation trend, hitting a high of $3397.25/oz in European trading before falling sharply. It is currently trading around $3382. Although gold prices are still in an upward channel, they have recently shown a high sideways trend. The market lacks unilateral driving factors. Gold can be shorted at high levels. It is recommended to short gold in batches around the highs of 3390-3405.

GOLD ROUTE MAP UPDATEHey Everyone,
This is a follow-up update on our 1H chart and what can I say, another amazing result!
After hitting our bullish target at 3370 earlier this week, we confirmed the EMA5 cross and lock above 3370 confirming 3392, which I continued to highlight and remind as we bought the dips throughout the week. And today, we finally completed 3392 to perfection.
Next, we’ll be watching for an EMA5 lock above 3392 for a potential continuation. If that fails to lock, we may see some range play between 3392 and 3370.
We will keep the above in mind when taking buys from dips. Our updated levels and weighted levels will allow us to track the movement down and then catch bounces up.
We will continue to buy dips using our support levels taking 20 to 40 pips. As stated before each of our level structures give 20 to 40 pip bounces, which is enough for a nice entry and exit. If you back test the levels we shared every week for the past 24 months, you can see how effectively they were used to trade with or against short/mid term swings and trends.
The swing range give bigger bounces then our weighted levels that's the difference between weighted levels and swing ranges.
BULLISH TARGET
3370 - DONE
EMA5 CROSS AND LOCK ABOVE 3370 WILL OPEN THE FOLLOWING BULLISH TARGETS
3392 - DONE
EMA5 CROSS AND LOCK ABOVE 3392 WILL OPEN THE FOLLOWING BULLISH TARGET
3416
EMA5 CROSS AND LOCK ABOVE 3416 WILL OPEN THE FOLLOWING BULLISH TARGET
3429
EMA5 CROSS AND LOCK ABOVE 3429 WILL OPEN THE FOLLOWING BULLISH TARGET
3439
BEARISH TARGETS
3348
EMA5 CROSS AND LOCK BELOW 3348 WILL OPEN THE FOLLOWING BEARISH TARGET
3328
EMA5 CROSS AND LOCK BELOW 3328 WILL OPEN THE FOLLOWING BEARISH TARGET
3313
EMA5 CROSS AND LOCK BELOW 3313 WILL OPEN THE SWING RANGE
3296
3281
As always, we will keep you all updated with regular updates throughout the week and how we manage the active ideas and setups. Thank you all for your likes, comments and follows, we really appreciate it!
Mr Gold
GoldViewFX
