Invest in Gold? Exploring the Impact of Diwali
The price of gold has reached unprecedented heights in the retail market, setting a new record as the Hindu festival of Diwali draws near. Factors, including increased demand, global economic uncertainties, and geopolitical tensions have driven this price surge.
The Multi Commodity Exchange (MCX) December contracts for gold have also witnessed a significant uptick, reflecting the broader upward trend in the precious metal's value. This positive momentum is largely attributed to favorable global cues, such as concerns over the US debt ceiling and ongoing geopolitical tensions.
Factors Driving the Gold Price Surge
• Diwali Demand: The festival of Diwali, known for its celebrations and gift-giving, is a significant driver of gold demand in India. As the festival approaches, consumers are increasingly purchasing gold jewelry, coins, and bars as a symbol of prosperity and wealth.
• Global Economic Uncertainties: The lingering effects of the COVID-19 pandemic, coupled with geopolitical tensions and concerns about global economic growth, have made gold a safe-haven asset for investors. As uncertainty persists, investors are turning to gold as a hedge against market volatility.
• Inflationary Pressures: Rising inflation rates, both domestically and internationally, have also contributed to the increase in gold prices. As purchasing power declines, consumers may seek to preserve their wealth by investing in gold.
• Geopolitical Tensions: Ongoing geopolitical conflicts, such as the Russia-Ukraine war and tensions in the Middle East, have created a sense of unease and uncertainty in global markets. This has led to increased demand for gold as a safe-haven asset.
Impact on Retail Market
The surge in gold prices has had a significant impact on the retail market. Jewelry stores and bullion dealers have reported a surge in demand for gold products, leading to increased prices and longer waiting times for certain items. Some consumers may find it challenging to afford the higher prices, while others may view it as an opportunity to invest in a valuable asset.
Government Measures and Outlook
In response to the rising gold prices, governments may consider implementing measures to curb demand or stabilize prices. These measures could include import restrictions, increased taxes on gold purchases, or the release of gold from government reserves.
However, the outlook for gold prices remains positive, particularly in the short term. As Diwali approaches and global uncertainties persist, gold prices will likely continue to be supported by strong demand and a favorable market environment.
Conclusion
The record-high gold prices witnessed in the retail market as Diwali nears are a reflection of a confluence of factors, including increased demand, global economic uncertainties, and geopolitical tensions. While the surge in prices may pose challenges for some consumers, it also presents opportunities for investors seeking to preserve their wealth and hedge against market volatility. As the festival of Diwali approaches, it is anticipated that gold prices will remain elevated, driven by strong demand and a favorable market environment.
Goldtradingstrategy

Gold is in the Bearish Direction after Formation ManipulationHello Traders
In This Chart GOLD HOURLY Forex Forecast By FOREX PLANET
today Gold analysis 👆
🟢This Chart includes_ (GOLD market update)
🟢What is The Next Opportunity on GOLD Market
🟢how to Enter to the Valid Entry With Assurance Profit
This CHART is For Trader's that Want to Improve Their Technical Analysis Skills and Their Trading By Understanding How To Analyze The Market Using Multiple Timeframes and Understanding The Bigger Picture on the Charts

Short-Term Rebound and Conservative Short StrategyAfter shorting at 2668 yesterday, it dropped about 7-9 points to 2659. Then it started to consolidate sideways, which is consistent with my speculation in the short term. However, after the overnight gold price was affected by the news that "Israel's attack plan on Iran is ready", it continued to rise to 2683, close to the historical high. But the detailed events have not been updated. So will the war break out again?
At present, the gold price is at 2678, and I continue to short. At present, there is still buying pressure near 2685. So the gold price will continue to be under pressure and fall in the short term. Of course, if the market releases "smoke bombs" again. I think the gold price will fall again and then rebound to test the upper pressure position.
Short the gold price first, and then go long.
sell:2683-2679
buy:2660-2665
Waiting for the arrival of the New York market.

Along position on XAUUSD on the 15mn chartAs you can see from the chart.I'm on a long position on goal.4X.I'm setting setting My target at 2689.In making my my.Stop loss.My stop loss at At 2662 and.Sitting on my hands and.I I saw, I saw that, I saw that the market started correcting and making a move downward, but that was just a correction. That's a normal.A normal.Process in the market.Whenever there is a move upward or downward, the market should have some kind of rest and then.Retain its original direction. Here we are having a move upward and we're waiting to reach our target.You have to be patient and sit on your hands, do not panic after making your setups and everything, uh, do not try to close your position earlier so that you miss the opportunity to make money on the market.So let's wait and see what's gonna happen. There is a high probability that the market is going to hit our target. Once it hits the target, we might see some reversal.To the downside because.The goal has reached all time high record and there will be probably a move downward and if you want to take another trade, a short trade, you may take that. But.Make your target.To the next level, then you can see on a chart.All right, go log everyone and let's make money together.

Gold fluctuates at a high level on 10.16, waiting for a pullbackGold has fluctuated at a high level in the past two days, and there are many resistances above. Don't chase long at high levels for the time being. However, the recent risk aversion sentiment has continued to support the rise of gold. Gold should wait patiently for a decline to go long. Pay attention to the resistance above 2680.
The 1-hour chart of gold is now fluctuating at a high level. Gold fell to 2638 yesterday to bottom out and rebounded. In the morning, it was long on dips above 2638, and it can continue to go long when it falls back to around 2640; gold is not rising directly unilaterally now. If you go long, you must wait patiently for a decline. Don't chase long easily at high levels, otherwise you will be at a loss again after a pullback. Continue to pay attention to the historical high of 2685 resistance above. You can go short in the short term. At this strength, gold does not have the momentum to set a new high in one fell swoop.
Gold longs and shorts are in a state of anxiety again; gold does not break highs, don't chase long easily, wait patiently for a decline opportunity, and follow up if it breaks through a new high directly.
Operation idea:
SELL: 2678 Stop loss: 2685 Target 2655--50
BUY: 2640, stop loss 2630, target 2660-2670;

The Perfect Setup Unfolding: Don’t Miss This High-Prob TradeIWhat’s Changed and What to Look for Now?
1. Structure and Pattern Focus: Wedge and Correction Identified
The yellow descending lines still highlight a wedge-shaped correction after the price made an upward impulsive move. Wedges often act as continuation patterns, meaning the trend (in this case, bullish) is likely to resume once the wedge is broken.
Price has already broken out of the wedge and pulled back, hinting that the market might continue upward after this slight retracement.
🔍 What to Do:
If you spot a wedge breakout like this, wait for a retest—which seems to be forming now—before entering the trade. This increases the chance of entering at a safer spot rather than chasing the move.
2. Identifying the "Potential Buy Zone"
You have a Potential Buy Zone marked around the 2,636–2,647 range, which aligns with both:
Key Fibonacci levels: 61.8% and 78.6% retracement levels.
Demand area: The price previously bounced from this region, showing there’s buying interest.
📝 What to Do:
Watch for price action signals within the buy zone, such as:
Pin bars (candles with long lower wicks).
Engulfing candles (strong green candles that close above the previous red ones).
Mini flags or pullbacks to signal buyers stepping in.
3. Set Entry and Stop-Loss Levels Smartly
If you enter within the buy zone, place your stop-loss below the 78.6% Fibonacci level (around 2,620). This ensures you’re protected if the trade goes against you.
Target One: 2,675.051
Target Two: Around 2,700
These targets are based on previous highs and Fibonacci extensions (-27.2% and -51.8%).
🔍 Pro Tip:
Always plan 2:1 or 3:1 risk-reward ratios. In this case, the stop-loss is relatively tight compared to the potential reward, making this a high-reward trade setup if price respects the buy zone.
4. Using "The Rule of Three" to Confirm the Setup
Based on the Rule of Three, you should always have three confirmations before entering a trade. In this scenario, here’s how it applies:
First confirmation: Price has entered the Fibonacci zone and buy zone (2,636–2,647).
Second confirmation: A bullish reaction or candlestick signal forms (like a pin bar).
Third confirmation: If price breaks above a mini-flag or consolidates slightly above this zone, it’s a strong sign to enter the trade.
5. What to Watch for as a Beginner
If price touches the buy zone and starts to show signs of rejection (like a wick or small bullish candles), that’s your signal to consider entering.
Be patient: If the price doesn’t give a clear signal, stay on the sidelines. Waiting for a proper entry reduces losses from impulsive trades.
How to Back-Test This Setup:
Look at past trades where the price pulled back into a similar buy zone with Fibonacci overlap.
Record how often these setups worked and whether waiting for the confirmation signals improved your success rate.
Summary for New Traders
This chart is a great example of a continuation setup:
Trend identification: The trend is still up, with a correction (wedge).
Entry zone: The buy zone is based on Fibonacci and prior support.
Wait for confirmation: Use candlestick patterns or break/retest setups.
Targets and stop-loss: Define a stop below the buy zone, and target the next highs (2,675 and 2,700).
This is an excellent opportunity to practice patience and discipline—wait for the right signals, and trade according to the plan. Use small positions if you're new, or try this setup in a demo account to build confidence!

XAUUSD: Golden Thoughts for a Beautiful Day: 15-OCT-2024Discover today's Gold trading zones and refine your market analysis skills.

XAUUSD IDEA FOR 30 MINUTES TIME XAUUSD, 30-minute timeframe chart
XAUUSD retested the resistance level of 2,667.00
General outlook
XAUUSD has been under buying pressure within the last day. The pair moved up to the resistance level of 2,667.00.
Possible scenario
The best way to use this opportunity is to place a sell order at 2,666.30.
Set your stop loss at 2,671.30 below the previous low ($5.00 loss for 0.01 lot) and take profit at 2,656.30 ($10.00 profit for 0.01 lot).
The risk-reward ratio for this order is 1:1.

Gold OutlookAs i told in my previous anylisis gold will break its Resistance level and after a retest it will retouch its previous ATH, so exactly gold has broken its Resistance level above, and going to test it 💪, if price sustains over the Resistance and Resistance becomes Support , it will be a potential buy another confluence for being Bullish is we have observed a 1H Bullish morobozou Momentum candle,
and price is above its high which is not yet broken , if price Hits its low (not high) then we will be thinking 🤔 about being bearish, another confluence is 50 SMA which also tells us price is in buy Mode on Monthly to weekly to daily to H4 to H1 timeframe, so after seeing these many confluences we will remain bullish on Gold until next move to either side

Gold’s Push to 2766—But an $80 Correction May Be Coming!Gold is eyeing key levels at 2719, 2738, and up to 2766, but let’s not ignore the potential for an $80+ correction along the way. I’ll walk you through the key targets and where the market might throw us a curveball.
Join me as we break down the technical and figure out if gold is set to rally or hit a correction. If this analysis helped (or at least gave you something to think about), give it a like, drop your comments below, and hit follow for more updates. Your support keeps the content rolling—unlike gold, which might need a timeout soon!
Mindbloome Trader
Happy Trading

Gold's low has been confirmed, and the rise will be unstoppableIn yesterday's article, I clearly said that you can buy gold boldly when it falls back to the support area of 2642-2630. Although this trend did not come out yesterday, I bought it without hesitation when the gold price fell today, and took profits at 2654. But this does not mean that the gold price has reached its limit. I think as long as the gold price falls back to 2650 later, you can consider buying here, and the high point is definitely not the previous high of 2666.
From yesterday's 1H chart, we can see that 2642 is 0.618. Although the gold price hit 2638 today, the real closing line is still around 2642. Therefore, according to the recent three callback trends, as long as it does not effectively fall below the support of 0.618 in the short term, it can be regarded as a bullish trend.
At the same time, I think the previous high of 2666 is definitely not a short-term high point. This rise is likely to break through here. The first target above can be seen in the range of 2670-2680. If it can stand at 2680, the gold price is likely to test the 2700 integer mark again.
The above is my view on gold today. Recently, my gold trading strategy has maintained a hot state of continuous profit. If you want to copy my trading details, you can contact me

Short-Term Rebound and Conservative Short StrategyAs gold prices approach the market closure phase, technical indicators indicate a bullish momentum in the shorter timeframes. However, the potential upside is limited, anticipated to be around 5-6 points, and may require several hours of consolidation to reach. A significant resistance level exists in the 2670-2673 range, primarily driven by selling pressure from concentrated trading volumes and the appreciation of the US dollar. Currently, the market lacks effective news catalysts for momentum; thus, a conservative trading strategy should focus on short positions at elevated levels. The anticipated target range for this strategy is between 2646 and 2653. Compared to going long, the profit potential from shorting is expected to be more substantial.
OANDA:XAUUSD CAPITALCOM:GOLD COMEX:GC1! COMEX_MINI:MGC1!

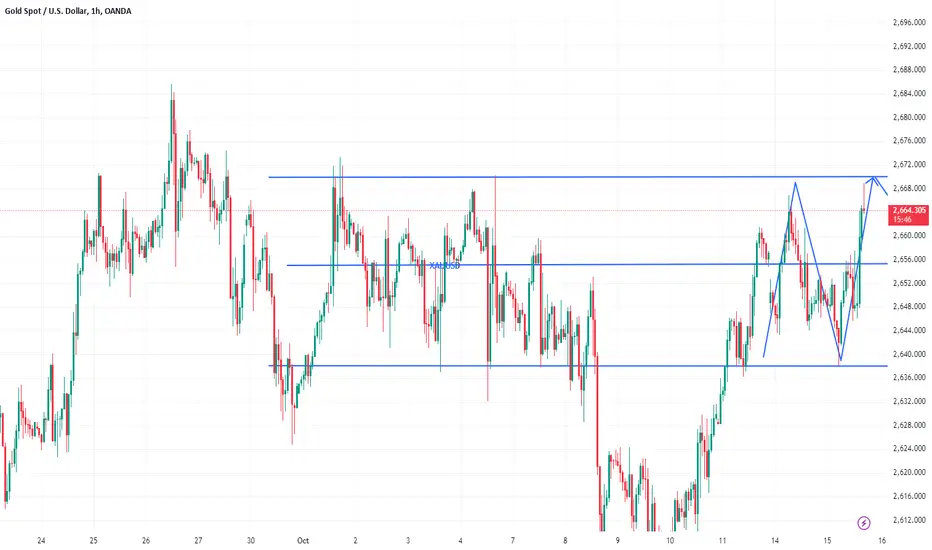
10.15 XAUUSD Trading strategyGold continues to surge higher. From the technical point of view on the candlestick chart, it is now just at the pressure level of the downward trend line and resistance line of the hourly chart. As long as it is suppressed at 2672 later, it is still possible to drop again.
Therefore, in trading, it is recommended to short gold directly at the current price of 2668, with a target of 2655.Because the area of 2655 is the previous intensive trading area, the point of 2655 has a certain support effect, so this wave of decline will most likely come to the point of 2655!
XAUUSD Operation Strategy
XAUUSD rebounded 2668-2670 line short, stop loss 2676, take profit 2655 line
Short-term strategy. Short around 2670 to around 2655The 8th day when the signal continues to make accurate profits
Trading strategy for the New York time period on October 15
There is upward pressure on the trend. The news is good for the US dollar.
Short-term trading can make money.
Let's witness the market's decline together.

Gold washes the market, peaks and buys the bottomIn the morning, the price of gold did not continue the rise of last Friday. Instead, it opened lower and fell rapidly, creating the illusion of short-term adjustment, which continued until it stopped falling near $2,643.
After that, the strength of the European session also created the illusion of breaking through the new high. The violent rise directly hit the high of last Friday, $2,660, and then traders began to turn bullish, and even waited for a pullback to go long.
Today, from the perspective of the market, it continues to fluctuate. Today's support is no longer $2,640-36, but the pressure point of last night's high of 2,653 in the early morning. The high point moved down and the low point broke. The large box shock has not ended. It is estimated that it will take a few days. Only when the position of 2,653 is re-established, will we consider intervening in the long position, otherwise the weak shock will continue today.
At present, the high pressure of gold is at the position of 2672 US dollars. The first support point below is at the previous rising position of 2636/37 US dollars, and the second is the top and bottom conversion position of 2624/22 US dollars. It is too early to talk about gold peaking now, but the high box has not ended. Considering the long-term grabbing area is still within the range of 2630/00. The higher the safety margin, the better the mentality of holding positions.
Therefore, today gold will continue to fluctuate downward based on the 2668 long-short dividing point. If it can reach below 2624/22, consider intervening more. Yesterday's continuous decline has already induced today's pullback to long, especially relying on the support position of 2640-36. Break through 2653 and then consider the pullback. For the time being, the callback will remain oscillating downward.

Short the gold price first. Then buy the gold priceJudging from the trend. There is some intention to fall in the market. But the short-selling force is not strong. We can take the opportunity to do some swing trading. The support strength of the position of 2646 is very low. I think it is only a matter of time before it falls to 2633-2637. Because the support there will be stronger and it is a good time to go long. So if you don’t know how to trade now, you can refer to a transaction in the quick trading strategy.
Simple sharing. Investors who like it remember to keep paying attention. CAPITALCOM:GOLD OANDA:XAUUSD COMEX:GC1! COMEX_MINI:MGC1!
