Arm - Positive outlook ahead of earnings - Value to collect?Hi guys we would be looking into our analysis for ARM Holdings before their earnings call!
ARM Holdings (ARM) – Positive Outlook Ahead of Earnings
ARM Holdings plc, a leading provider of semiconductor intellectual property, is poised to deliver a strong earnings report, driven by robust demand for its advanced chip architectures, continued growth in AI and data center markets, and deepening strategic partnerships across the tech ecosystem. As we approach the upcoming earnings announcement, several key factors support a bullish thesis on ARM's stock.
1. Strong Market Position and Licensing Growth
ARM continues to dominate the RISC-based processor architecture market, with its designs powering over 99% of smartphones and making significant inroads into the computing and server space. The company's royalty and licensing model provides a resilient revenue base, which has historically performed well even during industry slowdowns. Recent licensing agreements with leading tech companies, including NVIDIA, Apple, and Amazon, signal continued reliance on ARM's technology.
In Q1 2025, analysts expect double-digit year-over-year growth in licensing revenue, reflecting heightened demand for ARMv9 architecture, which powers next-generation AI and machine learning workloads. This growth is being further fueled by increased adoption in automotive and IoT sectors.
2. AI and Data Center Tailwinds
The surge in AI demand is transforming the semiconductor landscape. ARM's energy-efficient designs are increasingly being integrated into AI accelerators, edge devices, and cloud data centers. The company's Neoverse platform has been gaining traction, especially as hyperscalers seek alternatives to x86 architectures for power- and cost-efficiency. Amazon Web Services’ Graviton processors, based on ARM, are a prominent example of this trend.
As AI infrastructure spending accelerates globally, ARM stands to benefit significantly. Positive forward guidance around AI-related royalties and design wins would further validate this tailwind in the upcoming earnings report.
3. Financial Strength and Margin Expansion
Analysts anticipate revenue growth of 20-25% YoY in the upcoming report, accompanied by improved gross and operating margins. ARM’s high-margin royalty revenue stream contributes significantly to profitability, and recent cost controls have enhanced operational efficiency.
The IPO in 2023 provided a strong capital base, enabling increased R&D investment while maintaining financial flexibility. Shareholder sentiment has been buoyed by ARM's prudent capital allocation and expanding free cash flow profile.
4. Ecosystem Momentum and Strategic Partnerships
ARM’s ecosystem-first approach—collaborating with chipmakers, software developers, and system integrators—has become a key competitive advantage. The company's recent partnerships in the automotive and industrial sectors highlight growing non-smartphone revenue streams. Additionally, ARM is collaborating closely with AI chip startups and hyperscalers, reinforcing its central role in the evolving semiconductor landscape.
Investors should also watch for updates on ARM’s role in emerging verticals such as AR/VR, smart cities, and secure edge computing, all of which could significantly boost its long-term growth narrative.
5. Technical and Sentiment Indicators
From a technical standpoint, ARM stock has shown resilience, trading above key moving averages and gaining momentum in recent weeks. Options activity suggests bullish sentiment, with increased call buying ahead of earnings. If the company delivers a beat-and-raise quarter, it could catalyze a breakout to new highs.
📌 Trade Plan
📈 Entry: 121
✅ Target: 144 Below the strong resistance
❌ SL: 95 - Above the strong support
Growth

NATRIUM | Investing | Why BILL GATES is Betting on NATRIUMBill Gates is betting big on Natrium - should you be, too?
Natrium is this next-generation nuclear reactor design that's attracting a lot of attention from people like Bill Gates and other major investors. What's particularly interesting about it is that it combines a fast reactor with a built-in molten salt "battery." Essentially, it can generate a steady output of power and then provide an extra boost during peak demand by drawing on its stored heat. This design aims for greater flexibility in meeting fluctuating electricity needs.
The technology is a joint development by TerraPower, the company co-founded by Bill Gates, and GE Hitachi. They're presenting it as a zero-carbon power source capable of reliably backing up intermittent renewables like wind and solar, ensuring a consistent supply of clean energy.
The excitement from investors like Bill Gates appears to be driven by the need to address climate change and secure reliable energy supplies. They view Natrium as a way to deliver large-scale, carbon-free power while potentially overcoming some of the limitations of older nuclear reactor designs. Gates has emphasized the enhanced safety features and potential for lower operating costs. Furthermore, Natrium's specific design to complement the intermittency of solar and wind, through its energy storage, is a significant draw for investors looking at future energy solutions. The substantial public and private investment, including government funding and bipartisan legislative support, also signals strong confidence in this technology.
The description of TerraPower as a "Bill Gates-backed" firm developing this multi-billion dollar demonstration plant highlights the high-profile nature of the project. The fact that corporate partners, such as the data center company exploring Natrium for their power needs, are also getting involved indicates a broader recognition of its potential beyond just government initiatives.
Compared to traditional nuclear reactors, Natrium offers some potential advantages. Its sodium coolant operates at near-atmospheric pressure, simplifying safety compared to the high-pressure water systems in older designs. This allows for natural heat dissipation in case of issues, reducing the risk of large steam explosions. Another key aspect is Natrium's potential for more efficient fuel utilization and reduced long-lived waste generation. The design aims for better fuel efficiency and a smaller volume of long-term radioactive waste compared to current light-water reactors.
Natrium's primary advantage over wind and solar is its dispatchability. Unlike the intermittent nature of renewables, Natrium can provide power consistently, 24/7. The integrated energy storage allows it to complement renewables by absorbing excess energy or releasing power during periods of low renewable output. This firm grid support is a significant benefit for utilities concerned about grid stability and the variability of renewable sources.
For utilities transitioning away from coal, Natrium offers a carbon-free, relatively direct replacement in terms of power output. It also has a smaller land footprint compared to large-scale wind or solar installations.
There are inherent challenges with a first-of-a-kind system like Natrium. The prototype is still under construction, lacking a proven operational track record. Construction and licensing processes could face delays and cost overruns. Critics also raise valid points about the actual safety and cost-effectiveness compared to projections. The use of sodium coolant, while offering safety advantages, also presents risks due to its reactivity with air and water, requiring robust containment systems. Regulatory scrutiny will undoubtedly be extensive.
And fuel supply is a critical uncertainty. Natrium requires high-assay, low-enriched uranium (HALEU), which is not currently widely available. Disruptions in the supply chain and limited existing production capacity pose a significant risk to the timely and cost-effective operation of Natrium plants.
Looking ahead, Natrium is being considered for deployment in regions needing reliable power to complement renewables and to power energy-intensive industries. The long-term vision involves integrating Natrium with renewable energy sources to create a more stable and decarbonized grid.
The speculative outlook for Natrium in the next 5-10 years is heavily dependent on the successful completion of the Wyoming demonstration plant. If it meets its targets, it could pave the way for wider adoption. However, the timeline is ambitious, and challenges related to fuel supply and regulatory approvals remain. A successful demonstration could trigger significant investment and adoption in the coming decades, positioning Natrium as a key player in the energy transition.
If you're interested in investing in companies involved with TerraPower's Natrium reactor, several publicly traded firms are integral to its development and supply chain:
🔧 Engineering & Construction
KBR Inc. | (NYSE: KBR)
KBR has formed a strategic alliance with TerraPower to commercialize and deploy Natrium reactors globally. The collaboration focuses on creating a replicable contracting framework to reduce financial risk and ensure cost transparency in deploying Natrium technology.
terrapower.com
⚛️ Nuclear Fuel & Components
BWX Technologies Inc. | (NYSE: BWXT)
BWXT has been awarded a contract by TerraPower to design the Intermediate Heat Exchanger for the Natrium demonstration project. This component is critical for transferring heat within the reactor system.
Centrus Energy Corp. | (NYSE American: LEU)
Centrus Energy is collaborating with TerraPower to establish domestic production capabilities for high-assay, low-enriched uranium (HALEU), which is essential for fueling the Natrium reactor.
⚙️ Manufacturing & Industrial Partners
Doosan Enerbility Co., Ltd. | 034020.KQ (KOSDAQ)
Doosan Enerbility is supplying critical components for the Natrium reactor, including the core barrel and internal supports.
HD Hyundai | 329180.KQ
HD Hyundai is manufacturing the reactor vessel for the Natrium project.
🌍 International Collaborators
SK Inc. | 034730.KQ
SK Inc., a South Korean conglomerate, has invested $250 million in TerraPower to support the demonstration and commercialization of the Natrium reactor.
Korea Hydro & Nuclear Power (KHNP) | 15760.KS (KOSPI)
KHNP has entered into a strategic collaboration with TerraPower to support the Natrium project, leveraging its expertise in nuclear power development.
OTHERS:
1. Mirion Technologies (NYSE: MIR)
Mirion is supplying the Radiation Monitoring System (RMS) and Nuclear Instrumentation System (XIS) for the Natrium Reactor Demonstration Project in Wyoming.
2. GE Vernova (NYSE: GEV)
Through its subsidiary, Global Nuclear Fuel–Americas (GNF-A), GE Vernova is partnering with TerraPower to establish the Natrium Fuel Facility in Wilmington, North Carolina. This facility aims to produce high-assay, low-enriched uranium (HALEU) fuel essential for the Natrium reactor.
3. NuScale Power Corporation (NYSE: SMR)
While not directly involved with the Natrium project, NuScale is a prominent developer of small modular reactors (SMRs), a category that includes Natrium. The company's advancements in SMR technology contribute to the broader nuclear energy landscape.
4. Southern Company (NYSE: SO)
Southern Company is collaborating with TerraPower on the development of a molten chloride fast reactor (MCFR), a separate advanced nuclear project. Their involvement in advanced nuclear technologies aligns with the innovations seen in the Natrium project.
________________________________
Sources: Recent industry reports and news articles and TerraPower press releases provide the data above. Also put together with the help of AI.
world-nuclear-news.org, ans.org, gatesnotes.com, scientificamerican.com, terrapower.com, reuters.com

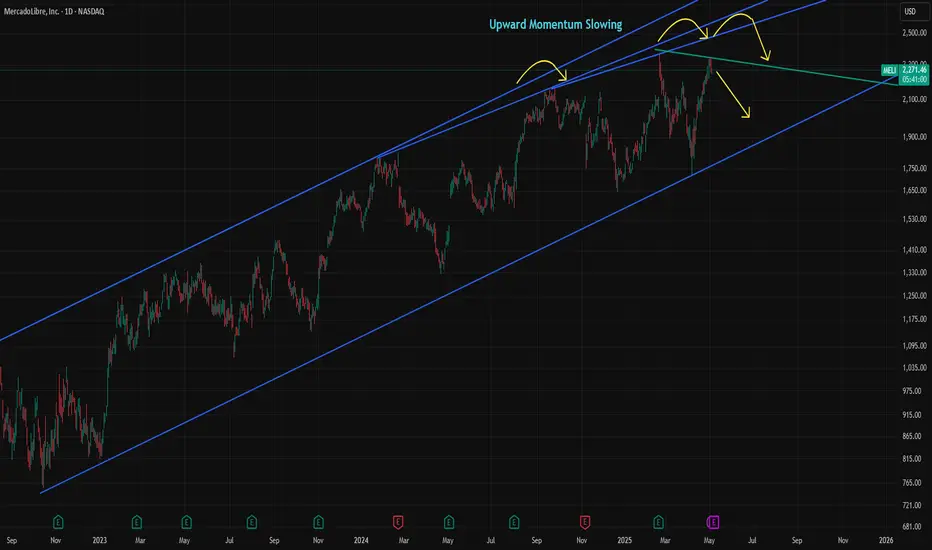
MELI at Risk from Momentum Shift and High ValuationMELI has gained over 35% since the April dip, but momentum has been fading since September. The slowdown has become increasingly visible, and last week's high may remain the top for some time unless Wednesday’s earnings report surprises the market on the upside.
The consensus estimate for MELI’s revenue is $5,497.05 million, representing a 26.86% year-over-year increase but a 9.27% decline quarter-over-quarter. MELI is currently trading at a forward P/E of 41.9x, which is significantly higher than the 19.8x average of comparable companies. Its geographic advantage over U.S.-based peers gave MELI an edge in April, but without strong earnings to support the high valuation, the stock could become vulnerable.
Over the past five years, MELI averaged 56.2% annual sales growth. That figure is expected to fall to an average of 22.1% over the next three years, which remains solid but signals a clear deceleration.
MELI could move more than 7% on earnings day, depending on the report. If the stock falls below 2,000, it may present a buying opportunity. However, the loss of momentum is usually a negative signal for sustaining trends, so the risk of buying the dip is higher than before.
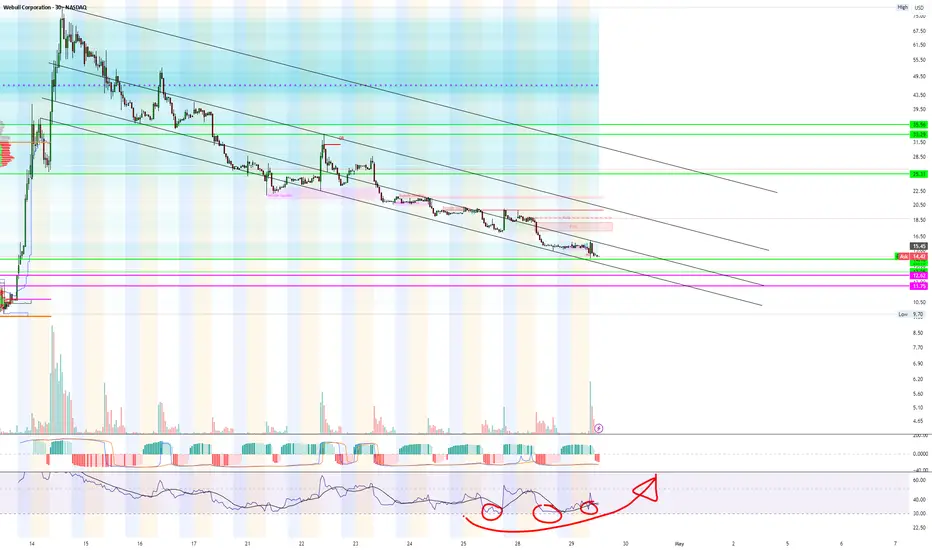
Wow, Id be dumping my life savings into this.First target is $25 and the $30 once we start to see price move closer to its volume profile gap down at my pink lines.
The key price level I see for support is 12.62$ but honestly, this looks like it could rip any day now.
Im longing until we break below $12
Microsoft - Positive earnings expectation , value to collect?Hi guys we would be looking forward to our next stock analysis for Microsoft!
Microsoft Corporation continues to demonstrate robust financial performance, underpinned by its strategic investments in artificial intelligence (AI) and cloud computing. The company's strong earnings and forward-looking initiatives position it favorably for sustained growth.
In Q4 FY2024, Microsoft reported revenue of $64.7 billion, marking a 15% increase year-over-year. Net income rose to $22.0 billion, with diluted earnings per share (EPS) of $2.95, surpassing analysts' expectations of $2.90 . For the full fiscal year, revenue reached $245.1 billion, reflecting a 16% increase, while net income grew by 22% to $88.1 billion.
Microsoft's Intelligent Cloud segment, which includes Azure, generated $28.5 billion in revenue for Q4 FY2024, a 19% increase year-over-year. Azure's revenue alone grew by 29%, driven by strong demand for cloud services and AI integration . The company's AI initiatives, such as the integration of Copilot across Microsoft 365 applications, have been pivotal in enhancing productivity and driving adoption.
📈 Positive Overall Outlook
Analysts maintain a bullish outlook on Microsoft's stock, with expectations of continued growth in earnings and revenue. For fiscal year 2025, analysts forecast an EPS of $13.04, up 10.5% from the previous year . The company's strategic focus on AI and cloud computing, coupled with its strong financial results, support this positive sentiment.
Microsoft's commitment to expanding its AI capabilities is evident in its planned $80 billion investment to enhance its global network of computing centers . This investment aims to support the growing demand for AI services and solidify Microsoft's position as a leader in the AI and cloud computing markets.
To summarize, Microsoft's strong financial performance, driven by its cloud and AI initiatives, positions the company for continued success in the evolving technology landscape.
📌 Trade Plan
📈 Entry: 390 -
✅ Target: 430 - Just below the ATH / around the strong resistance
❌ SL: 365 - Just around the current rejected support zone

Bitcoin - consolidation will lead to continuation (up)
Very basic chart.. only needs one markup !
- Institutional buyers are scared the price will drop
- Retail buyers are worried it drops (like so many are predicting)
But nobody knows where it will go next.
Common sense - After consolidation comes continuation... it wont go sideways much longer, its lightly to go up at least to the 100+ range.
That's my short summary for the next few weeks.

-14% 95 incomingBack down to retest the lows snagged 100 95 90 5/23 P before the close today then SMCI drops it 2% with a BILLION dollar miss not the news I was anticipating but I'll take it very fragile stock not holding up well GDP tm could accelerate loss.

Expect ENPH breakout by EOY 2025. Buy <$60Trends:
- LT parallel channel shown marks some key trendlines for the company since IPO
- LT falling wedge intersects the bottom of this channel H2 2025 --> a buying opportunity above $50. If that breaks, falling wedge ends around $35, a 30% downside (or 40% vs today's price).
- The early 2023 peak aligned with peak in revenue and net income (decline matched stock decline). We're now seeing revenue and net income growth again (growth can bring back stock growth)
My Bias:
I'm a long-term believer in solar. ENPH plays mostly in the residential solar space (and is expanding into small commercial). They are often lauded for their high levels of customer service.
Investment Thesis:
We're back to financial growth but the stock is down. We're in a few months window before LT trends converge mid / H2 2025. If we break bullish from falling wedge and hit LOWEST point of parallel channel by EOY 2026, we'd be at $70/share (16% upside from $60; 40% upside from $50). This is my expected worst case scenario, meaning anything under $60/share is now a buying opportunity.

Clean set up Bouncing of the lower trend line yet again, CleanSpark plans to sell mined Bitcoin each month and has secured a $200M credit line from Coinbase Prime as it shifts toward self-funding operations.
I'm a fan of more cash on hand giving the room to scale.

Under 400$ is a steal Strong move off 150 support. They had a 180 sell downgrade announced from some clowns today they'll be revising there targets shortly. COIN will be used be everyone and there grandma soon enough. Consumer/government dollars pouring in is insane this company is not going anywhere they also just realsed plans for BTC Yield Fund, offering 4-8% APY to non-US institutional investors through a limited leverage cash-and-carry trade strategy.
I don't think we'll be falling below 178 would be a great entry if your lucky enough.

META - Another great earnings, allowing us to collect value?Hi guys ,we would be looking into our analysis for META stock.
Meta Platforms Inc. has demonstrated robust financial performance, underscoring its strategic investments in artificial intelligence (AI) and digital advertising.
Strong Financial Performance
In Q4 2024, Meta reported revenue of $48.39 billion, marking a 21% increase year-over-year. Net income surged by 49% to $20.84 billion, with diluted earnings per share (EPS) rising 50% to $8.02. The company's operating margin improved to 48%, up from 41% the previous year, reflecting enhanced operational efficiency.
AI-Driven Advertising Growth
Meta's advancements in AI have significantly bolstered its advertising capabilities. In Q3 2024, advertising revenue grew by 18.6% year-over-year, reaching $39.89 billion. The integration of AI technologies has enhanced ad targeting and delivery, contributing to this growth.
Our Confidence
Overall analysis maintains a bullish outlook on Meta's stock, with an average price target of approximately $634, suggesting a potential upside of around 17% from current levels. The company's strategic focus on AI and its strong financial results support this positive sentiment.
In summary, Meta's strong earnings report, driven by AI advancements and advertising growth, positions the company favorably for continued success in the evolving digital landscape.
📌 Trade Plan
📈 Entry: 550
✅ Target: 630 - below the ATH to give an achievable destination
❌ SL: 480 - below the support zone to protect the trade

StoneCo | STNE | Long at $8.76StoneCo NASDAQ:STNE revenue rise is staggering.
Position started at $8.76. Chart looks ready for a move up, but nothing is guaranteed.
Price Targets into 2027:
$10.00
$12.00
$14.00
$16.00
$30.00 (long-term view)

PAPL - Good epxectation for earnings, collect potential?Hi guys we would be looking into Paypal Today
Analysts maintain a "Moderate Buy" consensus on PYPL, with 17 buy, 17 hold, and 2 sell ratings. The average 12-month price target is $84.69, suggesting a potential upside of about 29.6% from the current price. Price targets range from $49 to $125.
Earnings Performance
In the most recent quarter, PayPal reported adjusted earnings per share (EPS) of $1.20, a 22% year-over-year increase, surpassing expectations. However, revenue grew by 6% to $7.85 billion, slightly below forecasts. Notably, PayPal has exceeded EPS estimates in each of the last four quarters.
Growth Initiatives and Strategic Outlook
Branded Checkout Enhancements: Efforts to improve user experience and competitiveness against rivals like Apple Pay
Venmo Monetization and Debit Card Expansion: Initiatives to increase revenue through Venmo and broader payment options.
Fastlane Guest Checkout: A new feature aimed at streamlining the checkout process, with significant monetization expected in 2025.
Valuation and Future Prospects
PayPal's current valuation at 14 times forward 2025 earnings is below its five-year average P/E of 50.5, indicating potential for multiple expansion. Forecasts suggest revenue could reach $35.1 billion in 2025, with EPS around $4.93.
Our Conclusion
Given its strategic initiatives, consistent earnings performance, and favorable valuation, PayPal appears poised for growth. While challenges like competition in digital payments persist, the company's focus on innovation and user experience may drive its stock price upward in the coming years.
📌 Trade Plan
📈 Entry: 65.50
✅ Target: 75.50 - Targeting the weak resistance
❌ SL: 55.50 - protecting the trade above the bottom zone

Solana | BULLISH ON SOL | SOL Dominates Blockchain RevenueEven with a dip in activity particularly around memecoins, Solana has managed to hold its ground impressively when it comes to generating revenue.
While you might think fewer transactions would automatically mean less money coming in, Solana's performance shows otherwise. This ability points to the solid value being created by the different applications and uses on the network right now.
A big reason for this financial resilience is the continued strength of dApps on Solana. These apps have been really effective at bringing in fees and adding value to the network. It seems that while the hype around certain speculative tokens has died down significantly, the core utility and economic activity within Solana's dApps are still going strong. This shift towards more fundamental uses for generating revenue is a really positive sign for how the network can keep growing in the long run.
Looking ahead the future for SOL is bright imo as more projects are linking Artificial Intelligence with Solana, taking advantage of its speed and low costs to build new things. Plus, the introduction of Solana ETFs in Canada is a big step.
Other Solana-based alts including Official Trump (TRUMP), Jupiter (JUP), Raydium (RAY), and Bonk (BONK), have followed SOL with good price increases.
It seems like the focus is shifting towards building more lasting and useful applications. With ongoing support for developers and increasing interest from the traditional financial world, Solana seems well-positioned to handle market ups and downs and keep finding new ways to create value in the future. I'll definitely be watching to accumulate for the long-term.
______________________________
BINANCE:SOLUSDT

$3.9 Billion At Support?Long term buy structure forming now.
Large volume sweeps and blocks are being made here. Very large trade at this level happened last week and I think this is going to explode in the coming weeks/months.
Target #1 - $35
Target #2 - $40

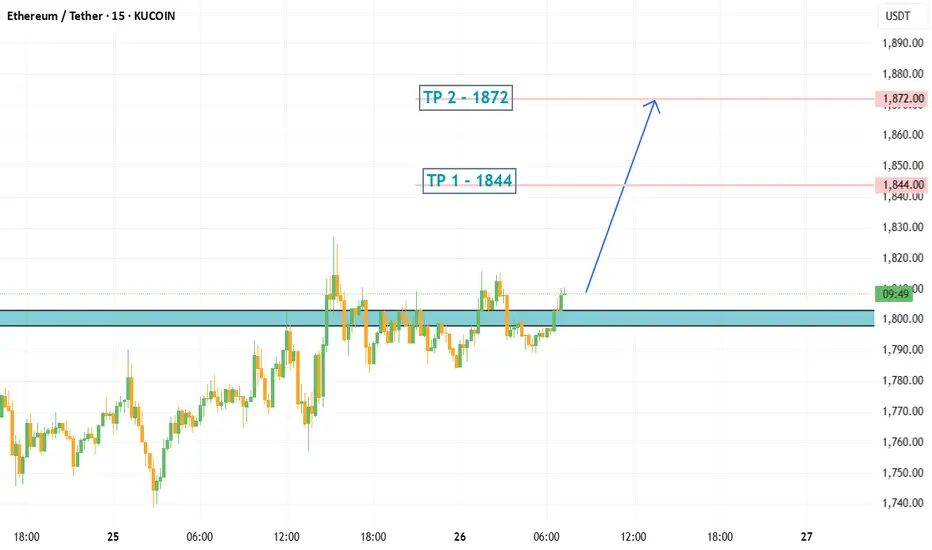
ETH/USDT LONG IDEAPosition opening range 1798~1803 USDT in batches
Total Position Recommendation Within 5% of total funds (or 1~2% of total account loss)
Stop Loss 1784 USDT, liquidate the position when triggered.
Take Profit First Target 1844, Second Target 1872
Cooling-off rule: 24 hours cooling-off after stop loss
Prohibition Prohibition of chasing high, prohibit the increase of positions, prohibit continuous trading
FTM Delisting | OFICIALLY Becoming SONIC (S)Although a name change for FTM was announced in Aug 2024 already, many exchanges still list FTM, and this will soon change.
It is expected the Fantom will officially be delisted and become SONIC within the next two months.
In August 2024, Sonic Labs announced that they would be replacing Fantom with a new token called Sonic (S). Sonic Labs have confirmed that all existing FTM holders would be able to convert to S at a fixed rate of 1 FTM : 1 S. However, many exchanges will only transfer now, as they will finally be delisting FTM for good and converting all FTM S. This will be done at a conversion rate of 1:1.
_________________________
Make sure you don't miss the latest ETH update, since BTC is likely heading towards a new ATH and ETH stands much more to gain.
_________________
CRYPTO:SONIUSD
POLONIEX:FTMUSDT

9 Simple Ratios Every Great Investor Uses - Buffett Included!Forget the hype, headlines, or hope. These 9 financial ratios are what real investors actually use to pick winners, but...
P/E? ROE? EPS? 🧐
- What are they, or better yet, WHO are they? 🤯
- How high is “too high”?
- Is a low number always good, or just a trap?
- Do all industries follow the same rules… or is that another myth?
Buffett. Greenblatt. Graham. Lynch.
They didn’t rely on vibes — they trusted fundamentals
After years of relying on charts, I built a 9-point fundamentals checklist to filter stocks faster and smarter. Now I’m sharing it with real-life examples and key insights to help you spot what really makes a stock worth owning:
Easy enough for new investors diving into fundamentals
Sharp enough to level up seasoned pros
Real enough to avoid hype
…but the truth is: these numbers did flag companies like Amazon, Apple, and Nvidia before the market gave them credit.
-----------------------------------------------------
✅ Quick Reference Table
Scan the table, then dive into the stories…
First Pro Tip: Bookmark this. You’ll check these before every stock pick.
-----------------------------------------------------
📊 1. P/E Ratio | Price-to-Earnings
What it tells you: How much you pay for each dollar of a company’s profit.
Short Example: A P/E of 20 means you pay $20 for $1 of profit. High P/E? Expect big growth or risk overpaying.
Strong: Between 15 and 25
Caution: Above 30 (unless fast growth)
Industry Averages:
- Tech: 25–40
- Utilities: 10–15
- Consumer Staples: 15–20
- Energy: 10–20
- Healthcare: 20–30
Story: In early 2023, NVIDIA’s P/E ratio hovered around 25, near the low end for tech stocks. Investors who saw this as a steal amid the AI boom were rewarded—NVIDIA’s stock made 4x by the end of 2024 as AI chip demand soared.
Contrast that with Tesla in Q1 2025, when its P/E spiked above 40 with slowing sales and Tesla’s stock dropped 50% in weeks.
Pro tip: A low P/E is not always good. If growth is weak or falling, it's often a trap.
Example: A utility company with a P/E of 30 is probably overpriced. A tech stock with 35 might still be fair — if growth justifies it.
-----------------------------------------------------
🧠 2. PEG Ratio | Price-to-Earnings-to-Growth
What it tells you: If a high P/E is worth it based on future profit growth. Whether the earnings growth justifies the price.
Short Example: A PEG below 1 means you’re getting growth at a fair price. High PEG? You’re overpaying.
Strong: Below 1
Caution: Above 2
Industry Averages:
- Software: below 1.5 is solid
- Consumer Goods: Below 2 is more realistic
- Tech: Below 1
- Consumer Staples: Below 1.5
- Healthcare: Below 1.2
- Financials: Below 1.5
- Energy: Below 1.3
Story: In mid-2022, Salesforce’s PEG was 0.8 (P/E 35, forward EPS growth 45%) as cloud demand surged. Investors who spotted this steal saw the stock climb 130% by the end of 2024. Meanwhile, Peloton in 2023 had a P/E of 20 but near-zero growth (PEG above 3). Its stock cratered -50% as fitness trends faded.
Story: NVIDIA’s PEG hit 0.9 in Q3 2023 (P/E 30, growth 35%) during AI hype, a steal for tech (average PEG below 1.2).
PEG filters hype. A stock can look expensive until you factor in growth.
-----------------------------------------------------
🧱 3. P/B Ratio | Price-to-Book
What it tells you: How much you pay compared to what the company owns (like buildings or cash).
Short Example: A P/B below 1.5 means you’re paying close to the company’s asset value. High P/B? Expect strong profits or risk.
Strong: Below 1.5
Caution: Below 1 + poor earnings = value trap
Industry Averages:
- Banks: Below 1.5
- Insurance: Below 1.3
- REITs: Use NAV (aim below 1.2)
- Tech: Often ignored
- Energy: Below 2
Story: In 2024, JPMorgan Chase’s P/B was 1.4, solid for banks (average below 1.5). Investors who bought enjoyed 100% gains.
n 2023, Bed Bath & Beyond’s P/B fell below 1 with collapsing earnings. It looked cheap but filed for bankruptcy that year.
Tip: Only use this in asset-heavy sectors like banking or real estate.
-----------------------------------------------------
⚙️ 4. ROE | Return on Equity
What it tells you: How well a company turns investor money into profits.
Short Example: An ROE above 15% means the company makes good money from your investment. Low ROE? Weak returns.
Strong: Above 15%
Caution: Below 10% unless in slow-growth industries
Industry Averages:
- Tech: 20–30%
- Consumer Staples: 15–25%
- Utilities: 8–12%
- Financials: 10–15%
- Healthcare: 15–20%
Story: Coca-Cola (KO) has kept ROE above 35% for years, a sign of brand power and pricing strength.
Eli Lilly’s (LLY) ROE stayed above 25% from 2022–2024, a healthcare leader (average 15–20%). Its weight-loss drug Mounjaro drove consistent profits, lifting the stock 150%+ in two years. Checking ROE trends helped investors spot this winner.
Tip: If ROE is high but D/E is also high, be careful, it might just be leverage.
-----------------------------------------------------
💰 5. Net Margin | Profitability
What it tells you: How much profit a company keeps from its sales or what % of revenue ends up as pure profit.
Short Example: A 10% margin means $10 profit per $100 in sales. Low margin? Tough business or high costs.
Strong: Above 10-15%+
Caution: Below 5%
Industry Averages:
- Software: 20–30%
- Retail: 2–5%
- Manufacturing: 8–12%
- Consumer Staples: 10–15%
- Energy: 5–10%
- Healthcare: 8–15%
Story: Walmart’s (WMT) 2% net margin looks tiny — but it’s expected in retail.
A software firm with 5%? That’s a warning — high costs or weak pricing.
In 2023, Zoom’s (ZM) net margin fell to 5% (down from 25% in 2021), well below software’s 20–30% average. Pricing pressure and competition crushed its stock quite a lot. Meanwhile, Apple’s 25% margin in 2024 (tech average 20%) remained a cash cow.
Tip: Margins show whether the company owns its pricing or competes on price.
-----------------------------------------------------
💣 6. D/E Ratio | Debt-to-Equity
What it tells you: How much debt a company uses compared to investor money.
Short Example: A D/E below 1 means more investor cash than debt. High D/E? Risky if profits dip.
Strong: Below 1
Caution: Above 2 (except REITs or utilities)
Industry Averages:
- Tech: 0–0.5
- Industrials: 0.5–1.5
- REITs: 1.5–2.5 (manageable due to structure)
- Utilities: 1–2
- Energy: 0.5–1.5
Story: In 2024, Tesla’s D/E dropped below 0.3 (tech average 0–0.5) as it paid down debt, signaling strength despite sales dips - a massive rally afterward.
Tip: Rising debt + falling profits = a storm coming. Always check both.
-----------------------------------------------------
💵 7. Free Cash Flow (FCF)
What it tells you: Cash left after paying for operations and growth investments.
Short Example: Apple’s $100 billion cash pile in 2024 funded stock buybacks, boosting shares. Low cash? Trouble looms.
Strong: Positive and growing
Caution: Negative for multiple years
Sector notes:
- Tech: Lots of cash (think billions)
- Industrials: Up and down, check trends
- REITs: Look at FFO (cash from properties), aim high
- Energy: Has cash, but swings with oil prices
- Healthcare: Steady cash, not too high
Story: Netflix had negative FCF while scaling content. Once costs stabilized, FCF turned positive and stock re-rated sharply.
Pro tip: Profits don’t mean much without real cash. FCF is often more honest.
Cash is king: Companies need cash to pay bills, reduce debt, or fund growth. If FCF is falling, they might be burning through cash reserves or borrowing, which isn’t sustainable.
Potential issues : This mismatch could signal problems like poor cash collection, heavy spending, or even accounting tricks to inflate profits.
-----------------------------------------------------
🚀 8. EPS Growth | Earnings Power
What it tells you: How fast a company’s profits per share are growing.
Short Example: EPS up 10% yearly means more profit per share, lifting stock prices. Flat EPS? No growth, no gains.
Strong: Above 10%
Caution: Below 5%, flat/negative for 3+ years
Industry Averages:
- Tech: 15–30%
- Staples: 5–10%
- REITs: 3–6% (via FFO growth)
- Healthcare: 10–15%
- Financials: 5–10%
- Energy: 5–15% (cyclical)
Story: In Q1 2024, NVIDIA’s forward EPS growth of 30% (tech average 20%+) fueled a rally as AI chips dominated. Checking forward estimates helped investors avoid traps like Intel, with flat EPS and a drop.
Pro tip: A stock with flat EPS and no dividend? There’s no reason to own it.
-----------------------------------------------------
💵 9. Dividend Yield | Passive Income
What it tells you: How much cash you get yearly from dividends per dollar invested.
Short Example: A 3% yield means $3 per $100 invested. High yield? Check if it’s sustainable.
Good: ~3–4%
Red Flag: Above 6% with a payout ratio above 80-90%
Industry Averages:
- Utilities: 3–5%
- REITs: 3–6%
- Consumer Staples: 2–4%
- Tech: 0–2%
- Energy: 2–5%
-----------------------------------------------------
💡 Final Thought: How to Use All of This
Top investors don’t use just one metric. They look at the whole picture:
Good growth? Check PEG.
Good profits? Confirm with ROE and margin.
Safe balance sheet? Look at D/E and cash flow.
Fair valuation? P/E + FCF Yield + P/B.
Real power = Combining metrics.
A company with P/E 15, PEG 0.8, ROE 20%, low debt, and positive FCF? That’s your winner.
A stock with P/E 8, but no growth, high debt, and negative cash flow? That’s a trap.
-----------------------------------------------------
Real-World Combos
🎯Winners:
Tech Gem: P/E 20, PEG 0.8, ROE 25%, D/E 0.4, growing FCF, EPS 20%+ (e.g., NVIDIA 2023: AI-driven growth, stock soared).
Energy Steal: P/E 15, P/B 1.5, FCF positive, Dividend Yield 3.5% (e.g., Chevron 2023: Cash flow king).
⚠️Traps:
Value Trap: P/E 8, flat EPS, D/E 2.5, negative FCF (e.g., Peloton 2023).
Overhyped Tech: P/E 50, PEG 3, Net Margin 5%, D/E 1.5 (e.g., Rivian 2024).
-----------------------------------------------------
🚀 Share your own combos!
What do you personally look for when picking a stock?
If you spotted something off in the numbers, or have a valuable insight to add — please, drop it in the comments.👇
💡 Let’s turn this into a thread that’s not just good but superb and genuinely helpful for everyone.
-----------------------------------------------------
Final Thought
“Buy great companies at fair prices, not fair companies at great prices.” – Warren Buffett
This guide gives you the map.
Charts, tell you when.
These numbers tell you what, and why.
And this post?
It’s just the beginning!
These 9 metrics are part one of a bigger series I’m building — where we’ll go even deeper, with more advanced ratios, smarter combos, and real case studies.
If this guide helped you see financial numbers a little clearer, there’s a good chance it’ll help your investor friend too, especially if they’re just starting their journey...🤝Share it with them!
I built this as much for myself as for anyone else who wants to get better.👊
If you made it this far — thank you! 🙏
...and super thankful if you hit "The Boost" on this post 🚀
Cheers,
Vaido

JPFA is callingAfter 22 April 2025, IDX:JPFA drop 190 (-9.97%) from the current price.
With the distributed dividen value Rp 70 (estimated 3% from the price)
Technical:
At the lowest area Fibb Retracement
Still above support line 1,740
Above EMA 200 (Weekly TF)
Fundamental
Growth Revenue each quarter
Good Debt to Equity Ratio (show good progress)
Target 1 : 1,945
Target 2 : 2,200
Thankyou for your time!
I hope everyone get the best for your life!

Arista Networks (NYSE: $ANET): Positive Outlook Amid AI Growth Arista Networks Inc. (NYSE: ANET) closed the latest trading session at $68.67, gaining 1.48% on the day. The stock has recently experienced a steep decline from its 52-week high near $134, yet it remains a key player in the edge computing space. As of Q4 2024, 78 hedge funds held positions in Arista, signaling strong institutional interest.
The company’s infrastructure supports edge computing by delivering ultra-fast, programmable switches and routers. These tools are vital for real-time data management in environments such as data centers and IoT systems. With the growing demand for AI-driven workloads at the network edge, Arista’s technology is well-placed to support this shift.
In 2024, Arista recorded $7 billion in revenue, marking a 19.45% increase from the previous year. Its net income rose by 36.3% to $2.85 billion. In Q4 alone, revenue jumped by 25.3% year-over-year to $1.93 billion. To enhance AI workload management, Arista launched the EOS Smart AI Suite with Cluster Load Balancing, a solution aimed at improving system efficiency under large-scale processing demands.
The edge computing market is on track to grow significantly, with global spending expected to reach $261 billion in 2025. This trend is supported by broader interest in Internet of Things (IoT) and AI technologies. Analysts predict this spending will climb to $380 billion by 2028.
Technical Analysis
Arista's price action shows it tested a key support zone at around $60, with the 200-day moving average at $65.95. The stock previously attempted to rebound above resistance at $77 but failed, forming a bearish setup. Current RSI stands at 31.16, suggesting the stock is close to oversold reading.
If it holds above the $60 support, a potential bounce could target $77, followed by $90 and above, aligning with the 100-day moving average. A break below $65 could open a path toward $60 or lower. Volume has been heavy during the downtrend, indicating strong selling pressure.

Barclays Raises TechnipFMC (FTI) Price Target to $43TechnipFMC (NYSE: NYSE:FTI ) closed at $31.23 on the previous trading day, staying close to its one-year high of $33.45. Evercore ISI analyst Jason Bandel maintained a Buy rating on the stock, setting a price target of $39. Meanwhile, Barclays reaffirmed its Buy rating with a higher target of $43 in a report dated March 26.
Currently, the consensus among Wall Street analysts rates TechnipFMC as a “Strong Buy.” The average price target stands at $37.22, suggesting an upside of 19.18% from current levels. The stock has an average daily trading volume of 4.33 million shares. TechnipFMC’s performance is under close watch, though analyst Jason Bandel has posted a -5.4% average return with a 31.58% success rate. He follows the energy sector, covering companies like Helmerich & Payne and NOV in addition to FTI.
Insider activity on the stock shows negative sentiment. Over the past quarter, 55 corporate insiders have sold shares. Earlier this month, Director Eleazar de Carvalho Filho sold 9,381 shares worth $279,178.56.
Technical Analysis
The stock recently bounced off a key support zone around $22, close to the 200-day moving average at $21.86. This bounce formed a bullish reversal setup. The price is now hovering near $25.20. If it holds this area, the next resistance is around the $28.00 level, followed by a possible move back toward its recent high of $33.45.
The volume profile shows increased buying near the bottom of the bounce, suggesting accumulation. RSI is around 42, indicating neutral momentum but potential for recovery if buying pressure continues. A break above $28 may signal continuation toward $33.45.

$LNTH Potential Healthcare sector leader NASDAQ:LNTH holds a negative net debt to ebitda ratio, with a forward p/e ratio around 16. Revenue growth was up over 18% for the TTM, and operating margin was around 40% compared to ~15% for healthcare companies in the drug manufacturing industry.
Technically, there is a potential wedge forming, though I can see a breakout bounce off of the .382 fib coming too. Strength showing relative to the S&P.

FET LONG/BUY SETUPHello, TradingView community and my subscribers, please if you like ideas do not forget to support them with your likes and comments, thank you so much and we will start a LONG/BUY outlook on #FETUSDT.P explained
