USDJPY – 1H | Bullish Continuation SetupFX:USDJPY
After a strong decline into support, price rejected aggressively and shifted structure. The sideways consolidation phase acted as accumulation before the bullish breakout. As long as the price continues to hold above the 155.678 support zone, bullish continuation toward higher levels remains likely. Any corrective pullback to the mid-channel or support may offer better entry refinement.
Key Scenarios
✅ Bullish Case 🚀
Hold above support + channel trend continuation:
🎯 Target: 156.728 → 156.975 zone
Trigger: bullish rejection at support/entry region.
❌ Bearish Case (Invalidation)
Break and H1 close below 155.678 may signal weakness:
🎯 Downside draw to 155.200–155.000 support pocket.
Current Levels to Watch
Resistance 🔴: 156.728 – 156.975
Support 🟢: 155.678 / 155.000
⚠️ Disclaimer: This analysis is for educational purposes only, not financial advice.
Harmonic Patterns

Quant signals V3 GOOG Katy AI 1M Forecast: Bearish Drift AheadGOOG QuantSignals Katy 1M Prediction 2025-12-02
QuantSignals Katy AI Stock Analysis
Analyzed 1 stock(s): GOOG
GOOG Analysis:
Current Price: $318.32
Final Prediction: $316.01 (-0.73%)
30min Target: $315.65 (-0.84%)
Trend: BEARISH
Confidence: 54.9%
Volatility: 21.3%
Summary: Generated 0 trade signals from 1 successful analyses out of 1 symbols.

NVDA QuantSignals Alert: High-Volatility Bearish Move IncomingNVDA QuantSignals Katy 1M Prediction 2025-12-02
QuantSignals Katy AI Stock Analysis
Analyzed 1 stock(s): NVDA
NVDA Analysis
Current Price: $183.28
Final Prediction: $181.20 (-1.14%)
30min Target: $180.13 (-1.72%)
Trend: BEARISH
Confidence: 57.6%
Volatility: 37.9%
🎯TRADE SIGNAL:
Direction: SHORT
Entry: $183.28
Target: $181.62
Stop Loss: $186.03
Expected Move: -1.14%
Summary: Generated 1 trade signals from 1 successful analyses out of 1 symbols.

CRWD Bearish Move Expected — High-Confidence Katy AI PUT SignalCRWD QuantSignals Katy 1M Prediction — 2025-12-02
Ticker: CRWD
Current Price: $515.85
Trend: BEARISH 📉
Confidence: 60.2%
Volatility: 83.0%
Trade Signal: PUT
Entry: $515.85
Target 1: $509.53
Target 2 (optional): $503.29
Stop Loss: $523.59
Expected Move: -1.53%
Analysis Highlights:
Katy AI predicts strong short-term downside, 1M horizon.
High volatility (83%) suggests possible sharp swings — use tight risk management.
Momentum and trend indicators align with bearish bias.
Trading Notes:
Keep position small due to elevated risk and volatility.
Watch for any reversal signals or news catalysts.
Ideal for swing traders looking for 1M bearish setups.

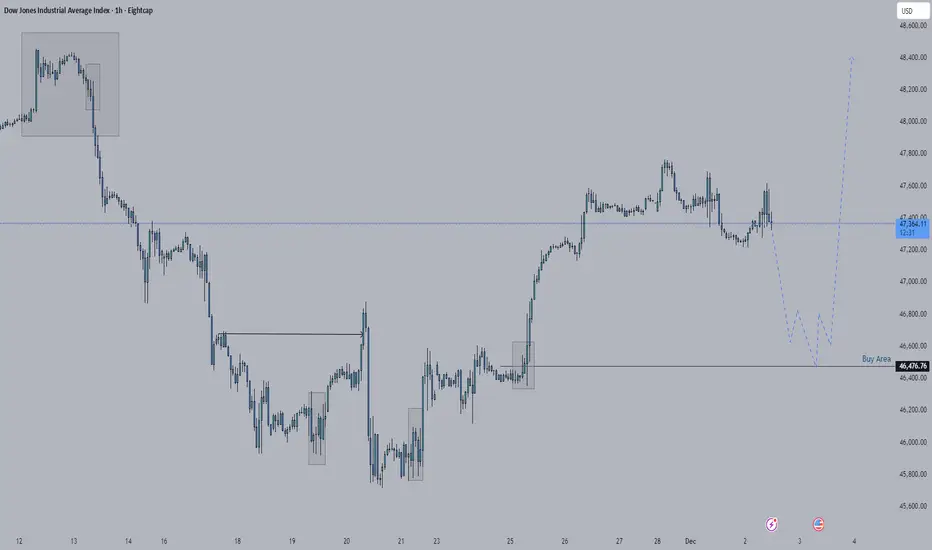
US30 Bullish AnalysisThis upcoming days US30 is going short, but I have an area I'm watching for buy. In daily tf the short movement that the market is currently doing right now is just a retest for it to go buy.
SPY Dual Opportunity Day: SPY Calls + Puts Both Showing Edge📢 SPY Weekly — Clean Breakdown (Calls & Puts Both Valid Today)
Here’s a simplified and community-friendly version you can post:
📊 SPY QuantSignals V3 Weekly | 2025-12-02
We have two valid angles today based on timeframe differences:
🟢 WEEKLY FRAME (Composite Score) → BUY CALLS
Direction: CALLS
Confidence: 58%
Expiry: Dec 5
Strike Focus: 680
Entry: 0.03
Target: 0.06
Stop: 0.01
Notes: Weekly momentum is neutral, but multi-timeframe alignment leans bullish.
🔻 KATY AI (Full 168-point Prediction) → BUY PUTS
Direction: PUTS
Confidence: 58%
Reason:
Katy predicts steady downside drift (-0.33%).
RSI overbought (73.8).
Weak volume (0.2× average).
P/C ratio 1.22 → bearish flow.
PUT Setup:
Entry: 0.02–0.03
Target: 0.06–0.09
Stop: 0.01
Risk: Moderate–High

WTI OIL targeting at least $56.00 on the short-term.WTI Oil (USOIL) continues to expand its 4-month Channel Down and has repeatedly been rejected on its 1D MA50 (blue trend-line) in the past 40 days.
As mentioned before, this is similar to September's price action, which eventually tested the previous Support before breaking it and move to a new Lower Low on the 1.5 Fibonacci extension.
As a result, we are still expecting to see $56.00 on the short-term.
---
** Please LIKE 👍, FOLLOW ✅, SHARE 🙌 and COMMENT ✍ if you enjoy this idea! Also share your ideas and charts in the comments section below! This is best way to keep it relevant, support us, keep the content here free and allow the idea to reach as many people as possible. **
---
💸💸💸💸💸💸
👇 👇 👇 👇 👇 👇

Update CADCHFSince our analysis yesterday, the price hasn’t changed much, and our outlook is still a short position toward the bottom of the channel. A break of the trendline that has formed, followed by a pullback, could give us a good trigger. If the price breaks to the upside instead, we’ll reassess the situation and decide at that moment whether to enter a long position or not.

ETHUSD (30m) – Liquidity Trap & Bearish Continuation OutlookFX:EURUSD
Price has already cleared several liquidity points and broken a major descending trendline. As long as the structure remains intact and support holds, continuation toward the next premium level is likely.
Key Scenarios
✅ Bullish Case 🚀
If price retests and holds above 4,154 zone
→ 🎯 Target 1: 4,210
→ 🎯 Target 2: 4,250–4,270 major resistance
❌ Bearish Case 📉
Break and close below 4,129 invalidation zone
→ 🎯 Downside Target: 4,105–4,070
Current Levels to Watch
Resistance 🔴: 4,210 🡆 4,250–4,270
Support 🟢: 4,154 🡆 4,129 (invalidation)
Liquidity Swept: Prior highs cleared
⚠️ Disclaimer: This analysis is for educational purposes only — not financial advice

Update BTCUSDAfter Bitcoin reached the price of 83,800, it found support and reversed the entire move, forming a V-pattern. We now have to see whether this pattern will actually play out or not. For it to activate, strong volume needs to enter the market — but so far it looks more emotional than logical.
In any case, we need to wait and see how the price reacts to the 92,125 resistance level. Will it break through, or is this just profit-taking before sellers take control again?

Bullish GartleyShort a correction back to ~$83k
Long to $100k+
SL for short above local highs
SL for long below $80k low

S&P500 Next stop.. 6925The S&P500 index (SPX) is about to complete the Right Shoulder of the Inverse Head and Shoulders (IH&S) pattern that took it from the bottom of the 1D MA100 (green trend-line) contact to having recovered the 0.786 Fibonacci level of the whole correction.
The next technical Target is of course the 6925 All Time High (ATH). Since however we are about to form a 4H MA50/100 Bullish Cross, a technical pull-back is expected as both previous such crosses since August 13, resulted into a short-term Top.
If the IH&S completes its technical expansion, then after this correction, a test of the 2.0 Fibonacci extension at 7200 is possible.
---
** Please LIKE 👍, FOLLOW ✅, SHARE 🙌 and COMMENT ✍ if you enjoy this idea! Also share your ideas and charts in the comments section below! This is best way to keep it relevant, support us, keep the content here free and allow the idea to reach as many people as possible. **
---
💸💸💸💸💸💸
👇 👇 👇 👇 👇 👇

Evening star on copperCopper is a metal and act like silver and gold most the time.
Mainly I'm telling you that gold and silver will correct some,
because of that morning star on the copper
I'm not gridy
Target is only 5.17

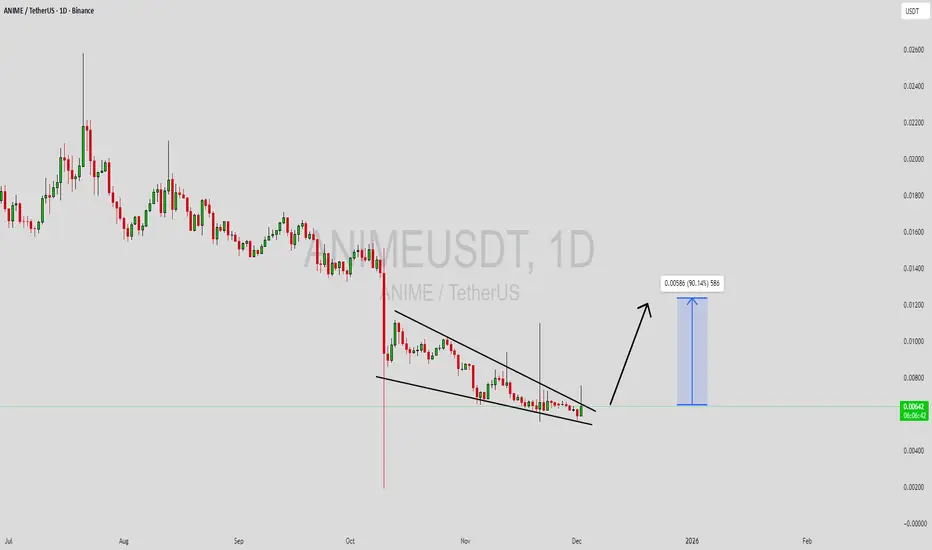
ANIMEUSDT Forming Falling WedgeANIMEUSDT is forming a clear falling wedge pattern, a classic bullish reversal signal that often indicates an upcoming breakout. The price has been consolidating within a narrowing range, suggesting that selling pressure is weakening while buyers are beginning to regain control. With consistent volume confirming accumulation at lower levels, the setup hints at a potential bullish breakout soon. The projected move could lead to an impressive gain of around 80% to 90% once the price breaks above the wedge resistance.
This falling wedge pattern is typically seen at the end of downtrends or corrective phases, and it represents a potential shift in market sentiment from bearish to bullish. Traders closely watching ANIMEUSDT are noting the strengthening momentum as it nears a breakout zone. The good trading volume adds confidence to this pattern, showing that market participants are positioning early in anticipation of a reversal.
Investors’ growing interest in ANIMEUSDT reflects rising confidence in the project’s long-term fundamentals and current technical strength. If the breakout confirms with sustained volume, this could mark the start of a fresh bullish leg. Traders might find this a valuable setup for medium-term gains, especially as the wedge pattern completes and buying momentum accelerates.
✅ Show your support by hitting the like button and
✅ Leaving a comment below! (What is your opinion about this Coin?)
Your feedback and engagement keep me inspired to share more insightful market analysis with you!
BANDUSDT UPDATEBANDUSDT is forming a clear falling wedge pattern, a classic bullish reversal signal that often indicates an upcoming breakout. The price has been consolidating within a narrowing range, suggesting that selling pressure is weakening while buyers are beginning to regain control. With consistent volume confirming accumulation at lower levels, the setup hints at a potential bullish breakout soon. The projected move could lead to an impressive gain of around 90% to 100% once the price breaks above the wedge resistance.
This falling wedge pattern is typically seen at the end of downtrends or corrective phases, and it represents a potential shift in market sentiment from bearish to bullish. Traders closely watching BANDUSDT are noting the strengthening momentum as it nears a breakout zone. The good trading volume adds confidence to this pattern, showing that market participants are positioning early in anticipation of a reversal.
Investors’ growing interest in BANDUSDT reflects rising confidence in the project’s long-term fundamentals and current technical strength. If the breakout confirms with sustained volume, this could mark the start of a fresh bullish leg. Traders might find this a valuable setup for medium-term gains, especially as the wedge pattern completes and buying momentum accelerates.
✅ Show your support by hitting the like button and
✅ Leaving a comment below! (What is your opinion about this Coin?)
Your feedback and engagement keep me inspired to share more insightful market analysis with you!

Update XAUUSDGold hasn’t made any significant move since our analysis yesterday, and our previous outlook is still valid.
Look at that large bearish candle — when such a big candle appears in a downtrend, if the price doesn’t continue dropping afterward, meaning the trend doesn’t follow through, it can be considered the sellers’ “last push,” and the price will likely move upward afterward.
Right now, we can’t say for sure whether that candle was the sellers’ last effort or simply strong selling pressure. We need to wait for the next candles to form to understand it clearly.

Update NZDCADThe compression we talked about yesterday is still there, and the longer it lasts, the sharper the next move will be. Our preference is for a break to the downside because it aligns with the longer-term trend. On this pair, you can place a sell-stop, but waiting for confirmation is safer since it goes against the trend of the smaller cycle.

BANDUSDT UPDATE#BAND
UPDATE
BAND Technical Setup
Pattern: Falling Wedge Pattern
Current Price: $0.448
Target Price: $0.584
Target % Gain: 149.72%
Technical Analysis: BAND is breaking out of a falling wedge pattern on the 1D chart, signaling a bullish reversal after a prolonged downtrend. Price has compressed between descending trendlines and has now pushed above the wedge resistance with strong momentum. The breakout structure suggests continuation to the upside, with the projected target derived from the height of the wedge pointing toward the highlighted resistance zone. Sustained price action above the breakout area strengthens the bullish setup.
Time Frame: 1D
Risk Management Tip: Always use proper risk management.

Update USDCHFSince our analysis yesterday, the market hasn’t made any significant moves and our outlook from last night is still valid. Volatility has dropped a lot, and there’s a high chance we’ll see a sharp move soon. To make sure we don’t miss that sharp move, a sell-stop option is very suitable.

02.12.25 Daily ForecastPairs on Watch -
FX:AUDNZD
FX:EURNZD
FX:EURAUD
A short overview of the instruments I am looking at for today, multi-timeframe analysis down to what I will be looking at for an entry. Enjoy!

Update AUDNZDAs we mentioned yesterday, the price had formed a compression and was likely to break to the upside, allowing us to enter a position using a stop-buy order. Today, we saw that our position was activated.

USDJPY - Sell BiasPrice tapped into a major supply zone above 158.000 and immediately rejected, forming a clear shift in momentum.
Price is also attempting to break below the trendline of the most recent upward structure, suggesting that bullish momentum is weakening.
Let's see how it goes.

