GOLD Gold (XAU/USD) May 2025 Outlook: Dollar Dynamics and Directional Bias
Optimism about potential tariff reductions and trade agreements has reduced safe-haven demand for gold, pressuring prices to two-week lows near $3,200-3204
A finalized deal could further strengthen the US Dollar (DXY), exacerbating gold’s decline.
US Dollar Strength:
The DXY has rallied on trade relief and mixed Fed rate expectations, making gold more expensive for foreign buyers.
Interest Rate Differential: While futures price in Fed cuts starting June (four total in 2025), the dollar’s near-term resilience limits gold’s upside.
Technical Breakdown:
Gold broke below a multi-week symmetrical triangle, signaling a bearish wave which will be targeting $3,100–$3,000
Immediate resistance sits at $3,3287–$3,2780; a break above this zone is needed to invalidate the bearish structure.this level represent a broken demand floor and calls for retest.
US Jobs Data (May 2): Weak Non-Farm Payrolls (<130K) could revive rate-cut bets, supporting gold. Strong data (>150K) may extend dollar gains.
Fed Policy (May 7 Meeting): No rate changes expected, but hints of June cuts could trigger volatility.
May Directional Bias
Factor Impact on Gold (XAU/USD)
Trade Deal Progress Bearish (dollar strength, risk-on sentiment)
DXY Rally Bearish (inverse correlation reasserted)
Weak US Data Bullish (safe-haven flows, rate-cut speculation)
Geopolitical Shock Bullish (flight to safety)
Gold faces downside pressure in May, targeting $3,100-3000 driven by dollar strength and fading safe-haven demand. A close below $3,200 would confirm the bearish trend.
Upside Risks:
Escalation in Middle East tensions or renewed US-China tariff threats.
Disappointing US economic data (e.g., jobs, CPI) reviving aggressive Fed cut bets
Conclusion
The dollar’s strength and trade optimism dominate gold’s near-term trajectory, favoring a bearish bias in May. However, gold remains a critical hedge against unexpected geopolitical shocks or dovish Fed pivots. Traders should monitor the May 2 NFP report and Fed rhetoric for directional cues.
Harmonic Patterns

Goldfinch makes a beautiful Wyckoff patternThis a small diagram to help with identifying Wyckoff patterns.
GFI made a pretty one that is very easy to see.
PSY - Preliminary Supply
BC - Buying Climax
AR - Automatic Response
ST - Secondary Test

Meta - The Correction Is Officially Over!Meta ( NASDAQ:META ) is retesting the previous all time high:
Click chart above to see the detailed analysis👆🏻
For more than 7 years, Meta has been perfectly trading in a reverse triangle formation. And just three months ago, Meta once again retested the upper resistance trendline and reversed towards the downside. But with the retest of the previous all time high, this correction is over.
Levels to watch: $500, $800
Keep your long term vision,
Philip (BasicTrading)

VIRTUAL PERPETUAL TRADE , Sold at $1.74VIRTUAL PERPETUAL TRADE
VIRTUAL SELL SETUP
Currently $1.74
Sold at $1.74
(Trading plan If VIRTUAL up to $1.85
we will add more shorts)
Expecting target $1.64 OR DOWN
Incase of early exist will update this anaylsis
Its not a Financial advice

AUDJPYAUD/JPY Interest Rate Differential and May 2025 Fundamental Outlook
Current Interest Rate Differential
RBA Cash Rate: 4.10% (held steady in April 2025, with gradual easing expected later in 2025).
BoJ Policy Rate: 0.50% (maintained in May 2025 amid trade war risks).
Interest Rate Differential: 3.60 percentage points (AUD yield advantage).
This significant gap typically supports AUD/JPY appreciation as investors favor higher-yielding AUD assets. However, the BoJ has signaled willingness to hike rates if economic conditions improve, while the RBA plans further cuts, which could narrow the differential later in 2025.
Key May 2025 Fundamental Events
Australia (AUD)
Retail Sales (May 2):
March retail sales beat expectations (0.4% vs. 0.2% forecast). A repeat could bolster AUD.
Services/Composite PMI (May 4):
Forecast: 51.6 (Services) and 51.6 (Composite). A reading above 50 indicates expansion, supporting AUD.
Monthly CPI Indicator (May 28):
Critical for RBA policy. Persistent inflation may delay rate cuts, favoring AUD strength.
Japan (JPY)
Q1 GDP (May 16):
BoJ slashed 2025 GDP growth forecast to 0.5% due to trade war impacts. Weak data could pressure JPY.
BoJ Rhetoric:
Governor Ueda emphasized uncertainty over tariffs and delayed inflation targets. Dovish tones may weaken JPY.
Global Risk Factors
US-China Trade War: Escalating tariffs threaten export-reliant Japan and commodity-driven Australia. Risk-off sentiment could boost JPY as a safe haven.
RBA vs. BoJ Policy Paths:
RBA’s gradual easing (forecast: 2.6% by 2026) vs. BoJ’s conditional hikes creates a dynamic rate gap.
Directional Bias for May 2025
Scenario AUD/JPY Impact
Bullish AUD/JPY - Strong AU retail sales/PMI data
- Sticky AU inflation (delays RBA cuts)
- Weak Japan GDP
Bearish AUD/JPY - Risk-off sentiment (JPY safe-haven demand)
- BoJ hints at future hikes
- Soft AU data
Base Case:
AUD/JPY likely trades with an upward bias in May, supported by the wide rate differential and resilient Australian data. However, JPY strength could emerge if global risk aversion spikes or BoJ adopts a hawkish tilt. Monitor:
May 2 (AU Retail Sales), May 4 (PMIs), May 16 (Japan GDP), May 28 (AU CPI).
In summary, the interest rate differential and AU fundamentals favor AUD/JPY gains, but trade war risks and BoJ policy nuances warrant caution.

#GBPCHF: Major Swing Sell Opportunity! GBPCHF, there are two areas where you can sell it from. The first is the current market, where you can take a risk sell entry. However, if you’re looking for a safer entry, you may want to consider taking a second entry. This will be safer since the price would have filled the liquidity area.
Good luck and trade safely!
Thank you for your unwavering support! 😊
If you’d like to contribute, here are a few ways you can help us:
- Like our ideas
- Comment on our ideas
- Share our ideas
Team Setupsfx_
❤️🚀

SPY - short-term analysishi traders,
Let's have a look at SPY on 1h time frame.
As we can see the price created a double bottom and with the catalyst (Trump paused tariffs), the price pumped 11%.
It's approaching the resistance area and bulls are not out of the woods yet.
I expect a short-term pullback.
RSI is very overbought in 15 15-minute time frame which confirms this thesis.
Entry, target, and stop loss are shown on the chart.
Risk-reward ratio: 3,13

Bitcoin the Big Bearish TrapIn my opinion we are forming an extended right shoulder on the weekly
1 Scenario: It's expected to see an impulse to 107-112k area but I wouldn't buy spot/long btc in here under any circumstance.
Based on weekly RSI, we might top somewhere there, or sooner
2 Scenario: We don't go above 100k and start a sudden move down, as SPX just retested it's previous highs and a retrace is expected as well.
Regarding Altcoins, if btc goes above 115k, it's worth the risk with proper management but not sooner, or you risk being the exit liquidity in a very big downward move.
Or, btc retraces to sub 80k and we have one more leg left of 20-30% on alts before doom

GOLD - Bearish Continuation PatternsCAPITALCOM:GOLD has been trending downwards after weeks of bullish price action. Price has formed bearish AB=CD and bearish rectangle patterns. These are both bearish continuation patterns, which indicate potential downward pressure on price.
Bullish divergence has formed on 1 hr chart and if price breaks the lower high, we can expect bullish momentum in the short term!

Will Bitcoin see $134,000?I expect a correction at current prices.
To the areas of 86 and 84 and then the start of the next uptrend.
Whether we have a correction or not, the main goal in the future will be $134,000.

ETHEREUM 2025.05.01***Follow SEOVEREIGN to receive alerts.
**Boosts help SEOVEREIGN analyze more assets.
**Our team regularly publishes analysis reports on the cryptocurrency market.
Asset Overview – Ethereum (ETH)
🎯 Target 1: 1,820
🎯 Target 2: 1,787
Ethereum has currently confirmed the 1.13 Bat Pattern,
indicating a potential short-term downside move.
This may offer an opportunity to consider a short position for futures traders.
Of course, from a long-term perspective, we continue to expect upward momentum for Ethereum.
However, a short-term technical correction is possible, so please take this into account in your trading decisions.
This also serves as a good example for those interested in trading strategies based on harmonic patterns.

Today is oct 14th 1929 I have moved back to Long puts at 105%The chart posted was in the forecast written dec 8th 2024 We have now reached my targets of 5669 area I have been buying the dips in calls and made $ I am now 105 % long in the money puts and I do Not see a bottom until july once we break and a second bottom mid oct The market should see a drop of 38 % into july and form a small double bottom in oct at 41 % off the highs . I will move to 125 % long puts on a sell stop at 5300 even the math at 5334 is key Best of trades WAVETIMER

BTC 2025.05.01***Follow SEOVEREIGN to receive alerts.
**Boosts help SEOVEREIGN analyze more assets.
**Our team regularly publishes analysis reports on the cryptocurrency market.
🎯 Short-Term Bitcoin Downside Scenario
While we still envision long-term upward potential,
we are sharing a short-term bearish outlook based on the 15-minute chart for those engaged in futures trading.
A classic Crab Pattern has been identified,
which may serve as a helpful reference for those interested in harmonic patterns.
Target 1: 95,705
Target 2: 94,650
As long as the pattern remains valid, a correction toward these levels can be considered a natural move.
Please exercise caution and manage your risk appropriately when trading.

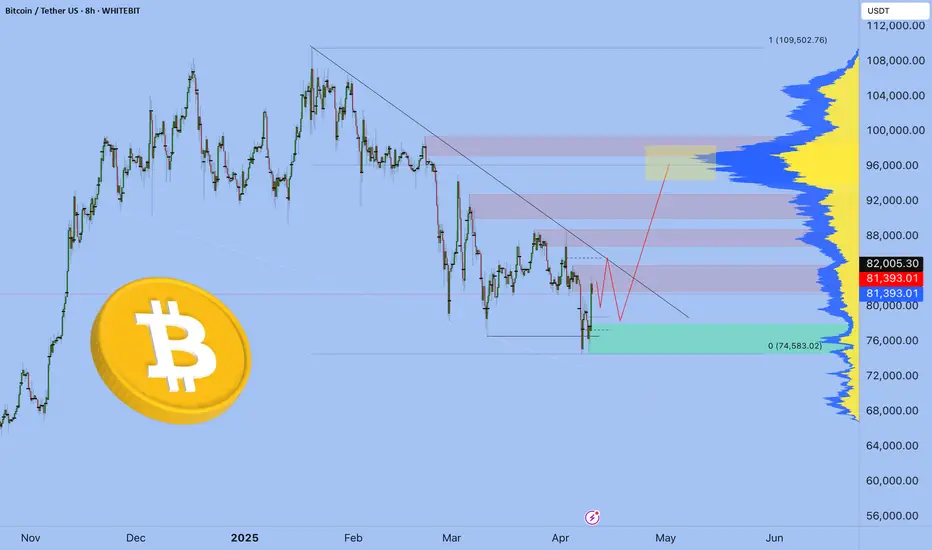
Bitcoin update 10.04.2025 - BTC - 98k in May🔥 The Markets Are on Fire — and We Know Who Lit the Match.
The last few weeks have been pure chaos.
Markets are crashing, confidence is shaking, and crypto is confused.
And let’s not pretend we don’t know who’s behind it.
Donald Trump.
Even a Korean guy selling panda souvenirs on the street told me:
“This Trump is ruining everything.”
And he’s not wrong.
Billions wiped. Positions wrecked.
But here’s the thing — this isn’t random. This is tactical drama.
Trump sees himself as a master negotiator, and here’s how he plays the game:
🎭 The Trump Cycle (Get Ready for the Loop)
Pressure — tariffs, chaos, media hysteria. We’ve seen it.
Relaxation — 90-day delays, fake calm.
Talks — and boom, “positive developments.”
Good News —
• “Bitcoin added to U.S. reserves.” in MAY?
• “Americans to receive new stimulus.”
• “China’s our friend again!”
Charm & Flirt Mode — improving global relations, smiling at cameras.
More good news — stock markets fly, crypto rips and everyone screams, “New bull run!”
And then?
💥 Back to pressure.
📆 September 2025 is the punchline.
That's when this cycle hits the weaker economies like a freight train:
✅ Broken supply chains
✅ Collapsing currencies
✅ Defaults
✅ And where there’s chaos — there’s war. Expect escalation in fragile regions like the Middle East.
✅ Crude oil falling to 40$
Markets will top on pure euphoria.
The reversal begins when everyone’s drunk on hopium and “good news”.
💼 My Plan? Ruthlessly Simple:
🔹 May I will participate in the first Offline/Online International Crypto Trading Cup 2025 by WhiteBIT
🔹Jun-August -Euphoria in the market
🔹 September - Take profits
🔹 Either short — or sip something cold on a quiet beach. But we will see
We’ve officially entered the Turbulence Zone.
The following 10 years will be insane — for those who adapt, evolve, ride the trends, and harness AI and tech.
If not?
You get left behind.
It’s not the strongest who survive — it’s the fastest to adapt.
Best regards, EXCAVO
BTC - Inversion Play at Resistance With IFVG Breakdown PotentialPrice has tapped into a previously established resistance zone and is now showing signs of exhaustion. A reactive short setup is in play, contingent on further bearish confirmation.
---
1. Resistance Zone — Key Supply Area
The marked red zone above highlights:
- Repeated Rejections: Price has failed multiple times to break and hold above this level.
- Order Block & Liquidity: Likely an area where institutional selling interest remains.
This zone offers a prime location for short setups, especially if price fails to hold above it and begins to roll over.
---
2. IFVG Inversion — Breaker-Type Setup
We are watching for:
- Inversion of a Bullish IFVG: A common signal of shifting order flow.
- Breaker Behavior: A previously supportive zone now acting as resistance — a hallmark of smart money reversals.
This structure suggests an intent to trap late longs and transition into lower pricing.
---
3. Internal Liquidity Sweep — Fuel for the Drop
The local high served to:
- Clear Short-Term Liquidity: Wick just above resistance suggests engineered breakout bait.
- Trigger Buyer Commitment: Which could now get trapped if momentum fails.
This liquidity event sets up the conditions for a more sustained push downward.
---
4. Downside Targeting the Discount Zone
Price is projected to revisit the blue discount zone:
- 0.618–0.65 Retracement Levels: Classic Fibonacci discount area often targeted after a premium rejection.
- Reaccumulation Potential: Watch for signs of buyer interest returning here.
This forms the logical destination for price following a confirmed rejection.
---
5. Summary:
- Price Rejecting Resistance & IFVG Inversion Signals Reversal Bias
- Liquidity Sweep Confirms Trap Setup
- Discount Zone Below Offers High-Probability Reaction Area
A strong short scenario may unfold if bearish order flow confirms beneath the resistance region.

GBPJPY Sell swing ideaFollowing the harmonic pattern strategy. for it to be true. we should wait for a reversal pattern because it's alot of points. and then when the market shifts, we enter.
support and resistances plays a big role in it.
happy trading

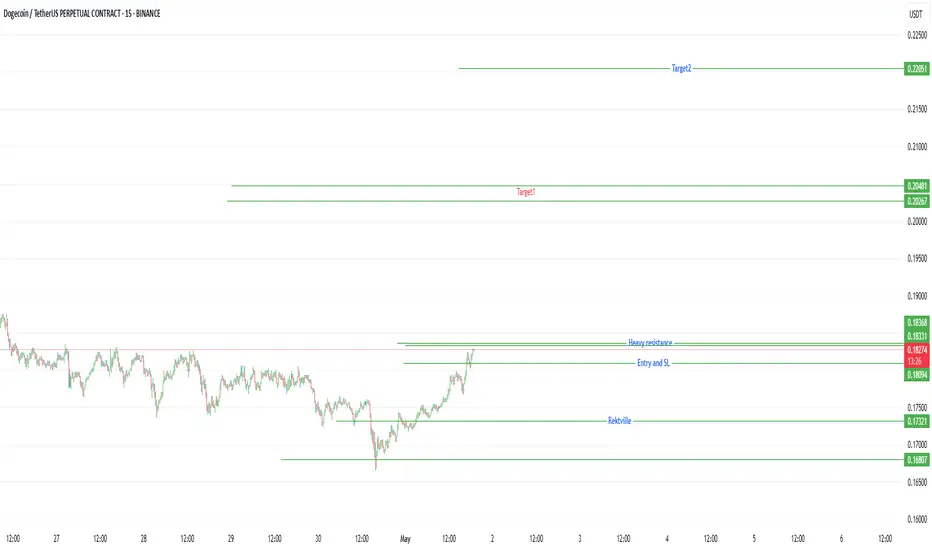
Doge chartDoge chart.
Key levels of support and resistance.
You want the price to stay above heavy resistance and use that as support before going bullish.
ETHUSDT: Progressing Well 01/05/2025 UPDATEThe ETHUSDT price is moving well, currently trading above the 1700$ area. We anticipate a continuous rise, potentially reaching $2400 first and then $3000. Our swing target remains at $4500. The current price behaviour and momentum suggest an extremely bullish outlook.
Good luck and trade safely!
Thank you for your unwavering support! 😊
If you’d like to contribute, here are a few ways you can help us:
- Like our ideas
- Comment on our ideas
- Share our ideas
Team Setupsfx_
❤️🚀

3236 becomes the dividing line between long and shortGold 3243 is the watershed between long and short positions. As long as this point is not broken, shorting at highs is still the main theme. You can continue to arrange short positions based on the suppression of 3236. The 3195-3190 area below is an important support. If the market retreats to this area, you can consider going long based on the actual situation and seize the opportunity of long-short conversion.


BUY AUDUSDIt looks as though the inverse head and shoulders pattern has matured. I would like to see a reversal towards 0,6444. Let the bears breath

BITCOIN is filling all gaps as it should.Bitcoin (BTCUSD) is having its strongest 1D green candle since April 22 (for now) and basically today's analysis is a continuation/ modification of our April 14 buy call (see chart below):
Our Target was $99500 but we now update it to $106000 as we see a different pattern through filling the Lower Highs gaps. As you can see, since BTC's April 07 bottom, the rebound has filled one Lower High of the downtrend after the other.
At the same time, it has posted identical rallies before consolidating, the 1st one +15.37% and the 2nd +15.11%. We are currently on the 3d and if it makes again +15.11%, then it gets us to $106.9k. That is marginally above the Lower High of January 30, practically the first Lower High after the January 20 All Time High (ATH).
Moreover, the 2.0 Fibonacci extension level is at $106k and this is why we've moved our short-term Target there. This fills all dynamic conditions of this uptrend.
Do you think that's a fair estimate? Feel free to let us know in the comments section below!
-------------------------------------------------------------------------------
** Please LIKE 👍, FOLLOW ✅, SHARE 🙌 and COMMENT ✍ if you enjoy this idea! Also share your ideas and charts in the comments section below! This is best way to keep it relevant, support us, keep the content here free and allow the idea to reach as many people as possible. **
-------------------------------------------------------------------------------
💸💸💸💸💸💸
👇 👇 👇 👇 👇 👇
