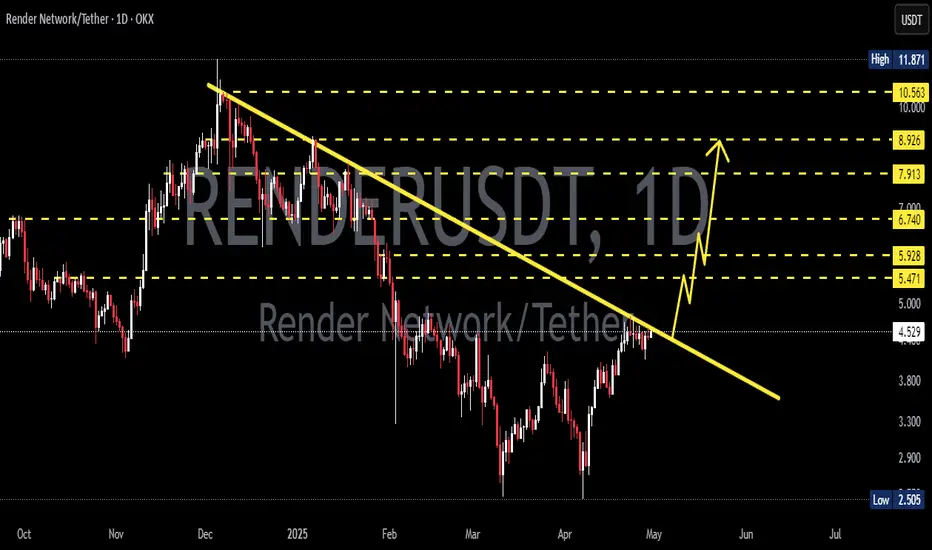
RENDERUSDT 1D AnalysisRENDER ~ 1D Analysis
#RENDER Buy after successfully penetrating this resistant line with a short -term target of at least 10%+ from here.
Harmonic Patterns

AAVEHere I see two possible scenarios. AAVE has been ranging for quite a while and I would be looking for shorting at 184 or long at 150. At 184 there is a clear OB which I would closely monitor if it holds and then short after confirmation. And at 150 I would wait for price to fill the breaker block and after confirmation enter the trade. I will be posting all of this free of charge as well as entries to my trades. Stay tuned.

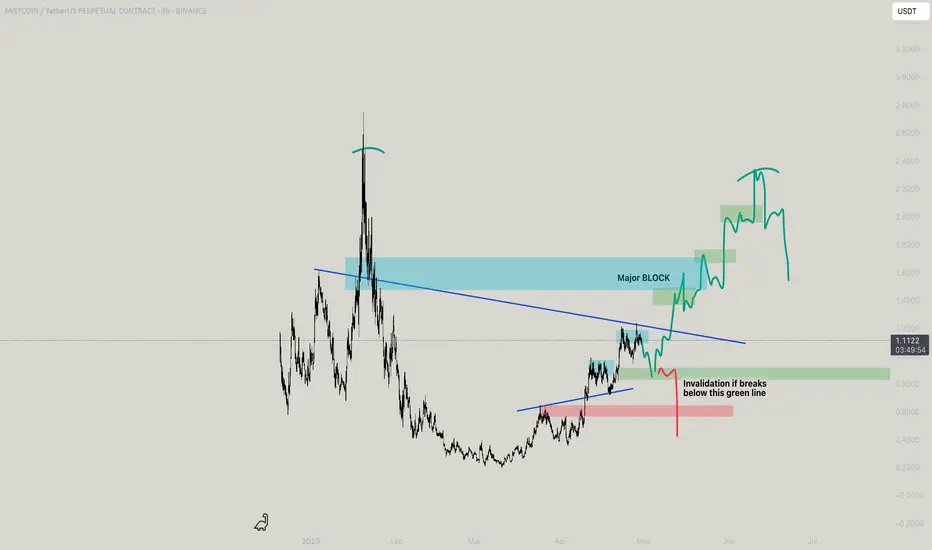
Mega FartCoin Analysis - Is it the beginning? $3 when?SO previously if you have seen me analyzing fartcoin, its on this basis that all OB works in place so well, So would decipher it better. Also you can see my old posts to get a conclusion on whats to be done.
Coming to the Market Profile -
we can see that the market has built a solid volume base around the $1.08–$1.11 zone, with multiple POCs (Point of Control) stacking here — indicating strong buyer interest and fair value acceptance. This region is acting as a strong demand zone. The structure is developing a higher-low pattern since April 22nd, suggesting bullish intent, especially as price is trying to hold above the VAL/POC levels of the last two profiles. However, each upward push is still getting capped near the $1.14–$1.16 VAH area, which now becomes a critical breakout zone. If price can close above $1.16 with volume, we can expect expansion towards $1.20+. On the flip side, if price loses $1.08 and starts building value below it, that would shift the bias bearish again with potential retest of $1.03–$1.00.
Now based on this, ive drew a lower TF 1H parabolic steep curve, which is also marked on my channel for better understanding. Now at this very point of time on 4H LTF the same pattern is being formed where invalidation is done (which is a prior to a swing before a UTAD move)
As you see cyan boxes say the pattern to get achieved and for the green is yet to be achieved!! Also have marked a major block, where most settlement of big longs and new buyers would be encouraged!!
Gold is still on a volatile downward trendGold continues to fluctuate in the 1-hour chart, and the amplitude of fluctuations is beginning to narrow, which indicates that a change is getting closer. As for gold's current fluctuations, it is still in a downward trend.
Trading idea: short gold near 3318, stop loss 3330, target 3300

Gold price up or down?Gold has been fluctuating at the bottom in recent days. The large range is obviously 3260-3370, and the small range changes every day. On Tuesday, it was 3352-3300. The overall trend was first falling and then rising, but the decline was stronger than the rise. For the time being, gold is still weak. On the upside, pay attention to the break of 3370. If 3370 breaks, look at 3420-3500. The operation idea remains unchanged. Today, we still look for low points to go long. The support below the small cycle is around 3300-3280. These two supports are necessary points for going long today.

BITCOIN consolidation or reversal why is 95k impotantMarket Update: Bitcoin Holding Strong Amid Broader Market Weakness
As mentioned earlier, Bitcoin has shown resilience amid broader market declines triggered by Trump-era policies and ongoing tariff tensions. While it's not on par with gold as a traditional safe haven, Bitcoin has remained well above the critical 73K risk zone.
Global trade negotiations continue, with a particular focus on US-China relations. Progress in this area suggests potential easing of tensions, which could support broader market sentiment.
Technical Outlook: On the daily and weekly charts, Bitcoin has broken above trend resistance and moved from the sell zone into a buy zone, attracting renewed interest. Currently, it's consolidating within the 92K–95K range. A recent false breakout at resistance triggered a correction, and we’re now closely watching for where that correction stabilizes—this will help define key support for potential consolidation.
Resistance levels: 95K, 100K, 102.5K
Support levels: 93.5K, 92.9K, 92K, 91K
To break above 95K and aim for 100K+, Bitcoin needs to establish a solid consolidation pattern. At present, such a formation hasn’t developed. The key zone to monitor is 95K–92K. If Bitcoin holds this range and resumes testing the 95K level, we could see a breakout toward 100K. Failure to hold this support may open the door for a deeper correction down to 91K–88K.
Please hit the like button and
Leave a comment to support for My Post!
Your likes and comments are incredibly motivating and will encourage me to share more analysis with you.
Best Regards, JAMES_GOLD_MASTER_MQL5
Thank you.

DRIFT your way to the ocean of profits!Well am late but on demand posted this, looks seriously dope at this point of time where preecedence is marked!

Would BTC ever touch 100k?This is 12H and based on pure pattern, Normally this pattern is made bullish where it would touch up, but while the market is moving, its shaking both the shorts and up-s liquidity, which means BTC would try to defy the pattern by rolling it dowm, remember when this type is made on big coins, it takes and falls down, however its based pure on PA

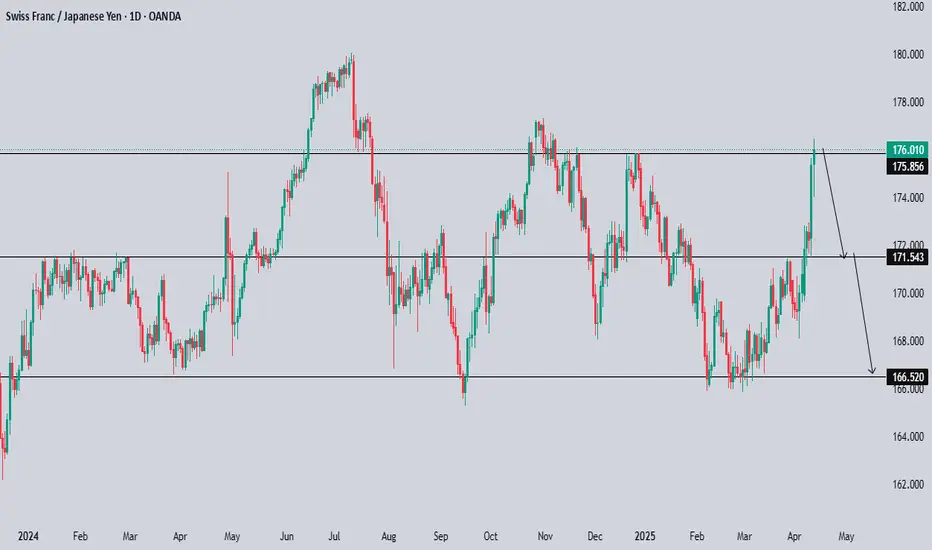
CHFJPY Technical and Order Flow AnalysisOur analysis is based on multi-timeframe top-down analysis & fundamental analysis.
Based on our view the price will fall to the monthly level.
DISCLAIMER: This analysis can change anytime without notice and is only for assisting traders in making independent investment decisions. Please note that this is a prediction, and I have no reason to act on it, and neither should you.
Please support our analysis with a like or comment!
EURCHF Technical and Order Flow AnalysisOur analysis is based on multi-timeframe top-down analysis & fundamental analysis.
Based on our view the price will rise to the monthly level.
DISCLAIMER: This analysis can change anytime without notice and is only for assisting traders in making independent investment decisions. Please note that this is a prediction, and I have no reason to act on it, and neither should you.
Please support our analysis with a like or comment!

NEARUSDT 1D AnalysisNEAR ~ 1D Analysis
#NEAR Buy after successfully penetrating this resistant line with a short -term target of at least 10%+ from here.

REZUSDT 1D AnalysisREZ ~ 1D Analysis
#REZ Buy after successfully penetrating this resistant line with a short -term target of at least 10%+ from here.

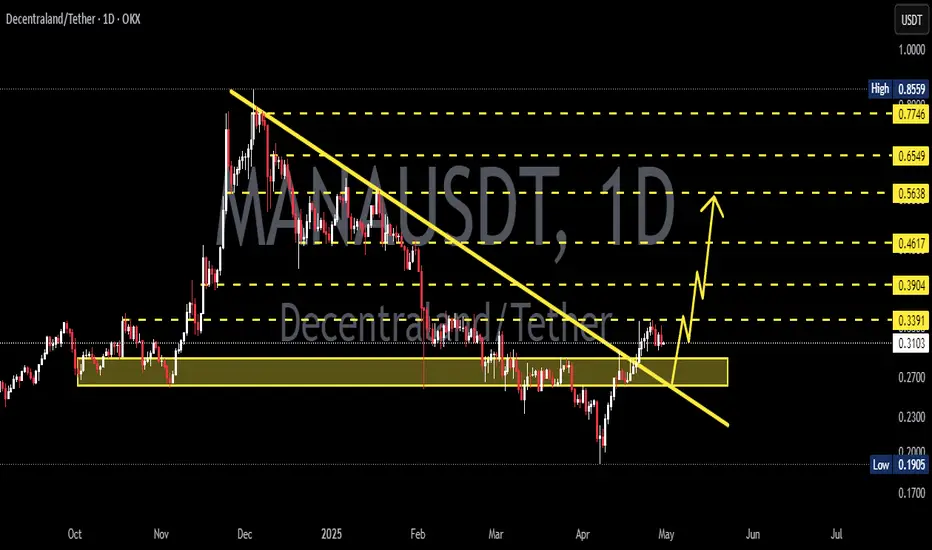
MANAUSDT 1D AnalysisMANA ~ 1D Analysis
#MANA Buy gradually when re -testing this support with a short -term target of at least 15%+ from here.
EURUSD H4 | Bearish Drop Based on the H4 chart analysis, we can see that the price has just reacted off our sell entry at 1.1374, which is a pullback resistance.
Our take profit will be at 1.1144, a pullback support level that aligns with the 61.8% Fibo retracement.
The stop loss will be placed at 1.1573, which is a swing high resistance level.
High Risk Investment Warning
Trading Forex/CFDs on margin carries a high level of risk and may not be suitable for all investors. Leverage can work against you.
Stratos Markets Limited (tradu.com):
CFDs are complex instruments and come with a high risk of losing money rapidly due to leverage. 63% of retail investor accounts lose money when trading CFDs with this provider. You should consider whether you understand how CFDs work and whether you can afford to take the high risk of losing your money.
Stratos Europe Ltd (tradu.com):
CFDs are complex instruments and come with a high risk of losing money rapidly due to leverage. 63% of retail investor accounts lose money when trading CFDs with this provider. You should consider whether you understand how CFDs work and whether you can afford to take the high risk of losing your money.
Stratos Global LLC (tradu.com):
Losses can exceed deposits.
Please be advised that the information presented on TradingView is provided to Tradu (‘Company’, ‘we’) by a third-party provider (‘TFA Global Pte Ltd’). Please be reminded that you are solely responsible for the trading decisions on your account. There is a very high degree of risk involved in trading. Any information and/or content is intended entirely for research, educational and informational purposes only and does not constitute investment or consultation advice or investment strategy. The information is not tailored to the investment needs of any specific person and therefore does not involve a consideration of any of the investment objectives, financial situation or needs of any viewer that may receive it. Kindly also note that past performance is not a reliable indicator of future results. Actual results may differ materially from those anticipated in forward-looking or past performance statements. We assume no liability as to the accuracy or completeness of any of the information and/or content provided herein and the Company cannot be held responsible for any omission, mistake nor for any loss or damage including without limitation to any loss of profit which may arise from reliance on any information supplied by TFA Global Pte Ltd.
The speaker(s) is neither an employee, agent nor representative of Tradu and is therefore acting independently. The opinions given are their own, constitute general market commentary, and do not constitute the opinion or advice of Tradu or any form of personal or investment advice. Tradu neither endorses nor guarantees offerings of third-party speakers, nor is Tradu responsible for the content, veracity or opinions of third-party speakers, presenters or participants.

ZKUSDT 2D AnalysisZK ~ 2D Analysis
#ZK Buy back from here with a short -term target of at least 15%+ from here.

GBPUSD H1 I Bullish Bounce Off the 61.8%Based on the H1 chart analysis, the price is falling toward our buy entry level at 1.3339, a pullback support that aligns with the 61.8% Fibonacci retracement.
Our take profit is set at 1.3411, an overlap resistance.
The stop loss is placed at 1.3285, an overlap support.
High Risk Investment Warning
Trading Forex/CFDs on margin carries a high level of risk and may not be suitable for all investors. Leverage can work against you.
Stratos Markets Limited (tradu.com):
CFDs are complex instruments and come with a high risk of losing money rapidly due to leverage. 63% of retail investor accounts lose money when trading CFDs with this provider. You should consider whether you understand how CFDs work and whether you can afford to take the high risk of losing your money.
Stratos Europe Ltd (tradu.com):
CFDs are complex instruments and come with a high risk of losing money rapidly due to leverage. 63% of retail investor accounts lose money when trading CFDs with this provider. You should consider whether you understand how CFDs work and whether you can afford to take the high risk of losing your money.
Stratos Global LLC (tradu.com):
Losses can exceed deposits.
Please be advised that the information presented on TradingView is provided to Tradu (‘Company’, ‘we’) by a third-party provider (‘TFA Global Pte Ltd’). Please be reminded that you are solely responsible for the trading decisions on your account. There is a very high degree of risk involved in trading. Any information and/or content is intended entirely for research, educational and informational purposes only and does not constitute investment or consultation advice or investment strategy. The information is not tailored to the investment needs of any specific person and therefore does not involve a consideration of any of the investment objectives, financial situation or needs of any viewer that may receive it. Kindly also note that past performance is not a reliable indicator of future results. Actual results may differ materially from those anticipated in forward-looking or past performance statements. We assume no liability as to the accuracy or completeness of any of the information and/or content provided herein and the Company cannot be held responsible for any omission, mistake nor for any loss or damage including without limitation to any loss of profit which may arise from reliance on any information supplied by TFA Global Pte Ltd.
The speaker(s) is neither an employee, agent nor representative of Tradu and is therefore acting independently. The opinions given are their own, constitute general market commentary, and do not constitute the opinion or advice of Tradu or any form of personal or investment advice. Tradu neither endorses nor guarantees offerings of third-party speakers, nor is Tradu responsible for the content, veracity or opinions of third-party speakers, presenters or participants.

BTCUSDT 1W UpdateYes, history is likely to repeat itself, making it possible for Bitcoin to reach a new all-time high in the range of $130K to $150K this year.
Are you ready?

Gold is in a long-short tug-of-war, waiting for a breakGold enters the range fluctuation in the 4-hour chart. From the chart, we can see that the trend is triangular, with high points gradually moving down and low points gradually moving up. When the space cannot be expanded, there will be a breakthrough in one direction. There will be news this week. Therefore, short-term trading still depends on highs and lows. The daily chart MACD begins to cross downward. The daily chart is horizontally consolidated and paused, unable to set a new high, and there is still a need for short-term correction. In summary, I suggest that short-term operations should focus on long and short positions, supplemented by long positions.

Gold suffers from short selling and may fall sharply!The market is basically in a weak decline during the day, and the rebound is not strong. The hourly chart shows more negatives than positives, which shows that there is still a decline. As for the position selection, it is not recommended to chase the short position. If it can reach the high point of 3323-3324, it is still possible to continue to short. The support below is 3287-3270. If it falls below the low point of 3260, then pay attention to the top and bottom conversion position of 3245.

Gold prices are expected to break upwardGold prices are expected to break upward
As shown in Figure 4h:
The rising channel, sideways channel and falling channel of gold prices form a triangular oscillation pattern
At present, the average price of triangular oscillation converges around 3320
I think the gold price is likely to break upward and return to the high of 3400+ again, and form an M top with the previous high near 3500, forming a double top structure.
Focus on the suppression near 3330-3340.
Once an effective breakthrough is formed, continue to follow up and do more.
In fact, we have arranged to do more in the 3310-3320 range and have been holding it, with a stop loss set at 3288-3295.
Today is April 30th, and the Asian market is about to enter the closed stage.
We need to pay attention to the chain changes brought by the Asian market.
Due to the May Day holiday, the Asian market is closed for 4 days, and the Asian market is currently the main purchasing power of gold prices. Will there be a superposition of risk aversion, or a direct squeeze?
This will inevitably bring some uncertainty.
Today's strategy:
Buy around 3300-3310
Stop loss: 3288-3295
Target: 3340-3360-3400
Hold firmly

Is the gold price trend bullish or bearish today?From a technical perspective, gold prices reversed their decline on Monday and rose. Gold repeatedly tested the 3260-3270 area for support. Gold has formed multiple bottom structures in the short term, so the short-term adjustment of gold may end. This time, gold has already adjusted, and it is unlikely to adjust again. Therefore, as long as the low of 3260 is not broken in the near future, gold will rise and there will be room for growth. As for the high point, there are two dividing points, one is the 3337 high point. If it breaks 3337, it will be a strong shock. The other is the 3370 high point. If it breaks 3370, it will be absolutely strong. Then, the upper space will open up, and we can look at 3420-3500.
It is recommended to go long if it falls back to 3300, stop loss at 3295, and target at 3315-3320; go short if it touches 3345-3340, stop loss at 3350, and target at 3330-3320;

The gold daily line switches between yin and yang in a cycle!Gold fell back after hitting the 3500 mark, and the current low is temporarily stable around 3260. The daily cycle shows that the gold price has failed to test the support level for three consecutive trading days, and the pattern shows a wide range of fluctuations with alternating Yin and Yang lines. In this market, blindly chasing orders is risky because the price lacks sustainability and the long and short forces frequently switch. On the 4-hour chart, gold showed a small range consolidation, and the Bollinger Bands contracted, further confirming the oscillating pattern. The current trend is waiting for external factors to stimulate it, and the fluctuation of the US dollar index and the change of risk aversion will become the key drivers.
