Gold prices are expected to break upwardGold prices are expected to break upward
As shown in Figure 4h:
The rising channel, sideways channel and falling channel of gold prices form a triangular oscillation pattern
At present, the average price of triangular oscillation converges around 3320
I think the gold price is likely to break upward and return to the high of 3400+ again, and form an M top with the previous high near 3500, forming a double top structure.
Focus on the suppression near 3330-3340.
Once an effective breakthrough is formed, continue to follow up and do more.
In fact, we have arranged to do more in the 3310-3320 range and have been holding it, with a stop loss set at 3288-3295.
Today is April 30th, and the Asian market is about to enter the closed stage.
We need to pay attention to the chain changes brought by the Asian market.
Due to the May Day holiday, the Asian market is closed for 4 days, and the Asian market is currently the main purchasing power of gold prices. Will there be a superposition of risk aversion, or a direct squeeze?
This will inevitably bring some uncertainty.
Today's strategy:
Buy around 3300-3310
Stop loss: 3288-3295
Target: 3340-3360-3400
Hold firmly
Harmonic Patterns

Is the gold price trend bullish or bearish today?From a technical perspective, gold prices reversed their decline on Monday and rose. Gold repeatedly tested the 3260-3270 area for support. Gold has formed multiple bottom structures in the short term, so the short-term adjustment of gold may end. This time, gold has already adjusted, and it is unlikely to adjust again. Therefore, as long as the low of 3260 is not broken in the near future, gold will rise and there will be room for growth. As for the high point, there are two dividing points, one is the 3337 high point. If it breaks 3337, it will be a strong shock. The other is the 3370 high point. If it breaks 3370, it will be absolutely strong. Then, the upper space will open up, and we can look at 3420-3500.
It is recommended to go long if it falls back to 3300, stop loss at 3295, and target at 3315-3320; go short if it touches 3345-3340, stop loss at 3350, and target at 3330-3320;

The gold daily line switches between yin and yang in a cycle!Gold fell back after hitting the 3500 mark, and the current low is temporarily stable around 3260. The daily cycle shows that the gold price has failed to test the support level for three consecutive trading days, and the pattern shows a wide range of fluctuations with alternating Yin and Yang lines. In this market, blindly chasing orders is risky because the price lacks sustainability and the long and short forces frequently switch. On the 4-hour chart, gold showed a small range consolidation, and the Bollinger Bands contracted, further confirming the oscillating pattern. The current trend is waiting for external factors to stimulate it, and the fluctuation of the US dollar index and the change of risk aversion will become the key drivers.

CORZ / 4hThere is no change in the prior NASDAQ:CORZ 's analysis in this frame. The wave structure of the 34% advance would suggest that the countertrend rally of Minor degree wave A should be underway.
The price might reach the origin of the diagonal wave ((v)) >> 9.45. In which case, the rising tide since mid-April will be revealed in a thorough five-wave impulsive sequence and highly confirmed, continuing the advance towards the anticipated Fib-targets >> 10.75 >> 12.24.
#CryptoStocks #CORZ #BTCMining #Bitcoin #BTC

Gold fluctuates, waiting for data to guide the directionIn the recent volatile market, we must restrain the impulse to chase the rise and sell the fall. In terms of operation, it is recommended to go high and sell low in the range of 3270-3360: do not chase long above 3340, and go short on highs; do not chase short below 3280, and go low on callbacks. If the trend effectively falls below 3260 and stabilizes, it will be regarded as a medium-term long signal, rather than a stop-loss exit opportunity. The 1-hour moving average of gold begins to converge, but it continues to diverge downward. It seems that the surge of gold is just to lure more. Gold has been up and down recently, but the overall shock is still bearish. Whether the current shock of gold will eventually reverse upward, or is it just a relay of the decline, the data of gold in the second half of the week may give the answer. Since gold also rushed up and fell under the stimulation of risk aversion, it means that gold is still under pressure from above.
Investment strategy: Gold 3335 short, stop loss 3345, target 3270

WULF / 4h#TeraWulf has continued to advance >> 54% in April, suggesting that the countertrend rally of Minor degree wave A should be underway.
The price might reach the origin of the ending diagonal wave ((v)) >> 3.52 in the coming days. In which case, the rising tide will be thoroughly revealed in a five-wave impulse and highly confirmed, continuing the NASDAQ:WULF 's advance towards the anticipated Fib-targets >> 4.38 >> 5.23.
#CryptoStocks #WULF #BTCMining #Bitcoin #BTC

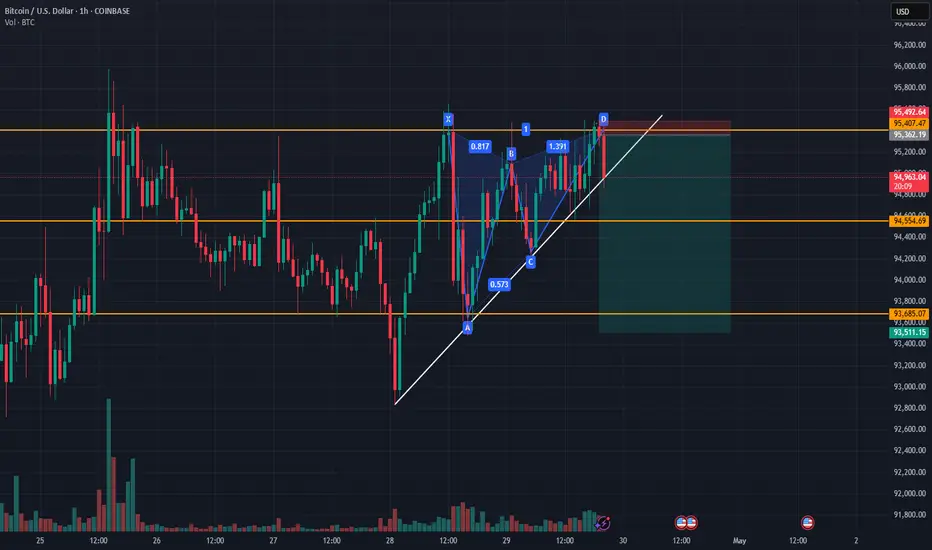
BTCUSDT BEARISH BUTTERFLY IN 1HBTCUSDT BEARISH BUTTERFLY IN 1H I go short it's only and a idea it's not a obligation to invest
Disclaimer: This is my personal opinion and not financial advice. Please manage your risk accordingly.
Xauusd down trend. XAUUSD Update
Current Price: 3317.00
I've entered a sell position.
Stop Loss: 3369.94
Take Profit: 3265.67
Risking 52.94 points for a potential gain of 51.33 points.
Let’s see how this plays out.
Trust your setup. Stay disciplined.

Btc longTight stop loss , i think we break out of this wedge to the upside . Seems like it is just waiting for shorts to accumulate and liquidate them.
98k is an area of interest for me to get those shorts in.

MUBARAK May Go Higher Than expected This chart illustrates the upside potential for Mubarak
Some coins did pullback today!
They may need to retest support
Bitcoin seems bullish
So altcoins could play ketchup
Mubarak can pump like Pengu did, could get volatile.

Volatile, Bearish Bias: Gold Trend Analysis & Trading TipsThe market is in a volatile trend with a bearish bias. Analysis of the gold market trend and trading suggestions
On Tuesday (April 29th), spot gold plummeted😲. Current price: 3306.49, down 1.14%. Opened at 3341.30, high of 3348.36, low of 3299.68
News in Brief
Trump's tough moves keep failing in the financial market😔. Bond market turmoil forced him to delay tariffs. Stock, bond & dollar slumps made him drop the Fed chair firing threat. His trade war "maximum pressure" strategy backfired against a major Asian nation💥. With losses piling up, he may cut tariffs. Legal battles at home are also mounting⚖️. Policy uncertainty could boost gold, but Fed rates or a soft landing might weigh on prices⏳.
Technical Analysis of Gold: After hitting 3500, gold declined😕. The current low is at 3260, which hasn't been broken in three daily trading days. With the pattern of alternating bull and bear candles, it's a clear wide-swing market😣. Don't chase trades as there's no continuity; it just moves back and forth.
On the daily chart, the trading range shifted from 3380-3260 last week to 3260-3330 but rebounded last night, returning to the wide range😲. The alternating bull-bear pattern makes the trend unsustainable these days. Today, the 5-day MA crossed below the 10-day MA, yet the opening price was above the 5-day MA, a divergence🤔. So, a downward correction was expected below 3332. Now there's a small bearish candle, and a small one with a long lower shadow may follow😏.
⚡️⚡️⚡️ XAUUSD ⚡️⚡️⚡️
🚀 Sell@3330 - 3320
🚀 TP 3300 - 3280
Accurate signals are updated every day 📈 If you encounter any problems during trading, these signals can serve as your reliable guide 🧭 Feel free to refer to them! I sincerely hope they'll be of great help to you 🌟

NZDCHF at a Turning Point: Bullish Breakout and Risky Setup? NZDCHF at a Turning Point: Bullish Breakout and Risky Setup?
NZDCHF is on the verge of confirming a bullish Inverse head-and-shoulders pattern.
If the price moves above the neckline at 0.4870, the chances of an upward continuation increase, potentially solidifying a new bullish trend.
However, a major risk remains: The Swiss National Bank (SNB) continues to intervene in the Forex market, strengthening the CHF in ways that seem unpredictable.
Their unconventional monetary policy has often benefited Switzerland at the expense of other economies, and these interventions show little regard for market stability.
Should the SNB interfere, NZDCHF could experience a bearish wave, possibly when least expected. This adds a significant risk and uncertainty to this setup.
You may find more details in the chart!
Thank you and Good Luck!
❤️PS: Please support with a like or comment if you find this analysis useful for your trading day❤️
Disclosure: I am part of Trade Nation's Influencer program and receive a monthly fee for using their TradingView charts in my analysis.

Alibaba - This Chart Speaks In Money!Alibaba ( NYSE:BABA ) prepares for a significant pump:
Click chart above to see the detailed analysis👆🏻
Basically since Alibaba was listed on the NYSE, it always perfectly respected market structure. With the recent rejection away from the key neckline, Alibaba is now creating a bullish break and retest. After bullish confirmation, this forms a bottom and we might see new all time highs.
Levels to watch: $110, $140
Keep your long term vision,
Philip (BasicTrading)

Gold shock pulls long and short without continuationFrom the daily line, the K-line closed with a hammer-shaped small positive line with a long lower shadow, showing a trend of falling back and oscillating from a high position, which intensified the change in the K-line pattern of the top. The 4-hour level analysis shows that the short-term important suppression of gold is at 3360-3366. In terms of operation strategy, it is still mainly based on shorting if the rebound does not break this suppression level. The important support level of 3260-3268 should be paid attention to below. The middle track of the Bollinger band at the hourly level is near 3322, which can be used as a watershed of strength and weakness. After the gold price falls below the middle track of the Bollinger band, it is likely to go to the lower track of the Bollinger band, and it is more likely to test the oscillation bottom position of 3260. In terms of short-term operation ideas for gold, it is recommended to mainly short on rebounds, and to supplement on pullbacks.

Gold is short, gold may plummet!As the current price is basically fluctuating within the large range of 3260-3370, the overall trend is fluctuating downward, the high point is constantly moving down, and the low point is tested many times. The more tests are made, the greater the probability of breaking. Therefore, the continuity of the rebound is not strong. In the morning, we stepped back to 3319 and bought more. In the afternoon, we rebounded to 3323 and left the market with a small profit and then went short. It basically maintained a weak consolidation at a low level. This trend means that there will be further declines.

Bullish bounce off pullback support?USD/JPY is falling towards the pivot which is a pullback support and could rise to the 1st resistance.
Pivot: 141.63
1st Support: 141.00
1st Resistance: 142.75
Risk Warning:
Trading Forex and CFDs carries a high level of risk to your capital and you should only trade with money you can afford to lose. Trading Forex and CFDs may not be suitable for all investors, so please ensure that you fully understand the risks involved and seek independent advice if necessary.
Disclaimer:
The above opinions given constitute general market commentary, and do not constitute the opinion or advice of IC Markets or any form of personal or investment advice.
Any opinions, news, research, analyses, prices, other information, or links to third-party sites contained on this website are provided on an "as-is" basis, are intended only to be informative, is not an advice nor a recommendation, nor research, or a record of our trading prices, or an offer of, or solicitation for a transaction in any financial instrument and thus should not be treated as such. The information provided does not involve any specific investment objectives, financial situation and needs of any specific person who may receive it. Please be aware, that past performance is not a reliable indicator of future performance and/or results. Past Performance or Forward-looking scenarios based upon the reasonable beliefs of the third-party provider are not a guarantee of future performance. Actual results may differ materially from those anticipated in forward-looking or past performance statements. IC Markets makes no representation or warranty and assumes no liability as to the accuracy or completeness of the information provided, nor any loss arising from any investment based on a recommendation, forecast or any information supplied by any third-party.

$SPY Bullish and Bearish TA signals, but leaning BullishShowing multiple time frames with different TA patterns--some harmonizing, while some are conflicting. When I put it all together the sum for me is slightly bullish.

AUDCHFThe current head of the Reserve Bank of Australia (RBA) is Governor Michele Bullock, who commenced her term on 18 September 2023 and is serving through at least February 2025.
The current head of the Swiss National Bank (SNB) is
Martin Schlegel, Chairman of the Governing Board, Zurich
Antoine Martin, Vice Chairman of the Governing Board, Berne
Petra Tschudin, Member of the Governing Board, Zurich
Interest Rate Differential and Swiss National Bank (SNB) Policy
The Swiss National Bank (SNB) has historically maintained a low or negative interest rate policy to curb the Swiss franc's strength and support the Swiss economy.
Meanwhile, the Reserve Bank of Australia (RBA) has been adjusting rates in response to inflation and economic conditions, often maintaining higher interest rates relative to Switzerland.
This interest rate differential typically supports the Australian dollar against the Swiss franc, as higher Australian rates attract yield-seeking capital.
However, recent global economic uncertainties and risk-off sentiment have strengthened the safe-haven Swiss franc, offsetting some of the interest rate advantage of the AUD.
The head of the Swiss National Bank, in recent years, has emphasized cautious monetary policy, aiming to prevent excessive franc appreciation while managing inflation and economic stability.
Directional Bias is Bearish to neutral with potential for further declines in 2025
Interest Rate Differential RBA rates generally higher than SNB, supporting AUD, but SNB's low/negative rates and safe-haven status of CHF create mixed pressures
SNB Policy Cautious, focused on preventing franc appreciation, maintaining low rates
Market Sentiment Risk-off environments tend to strengthen CHF, weighing on AUD/CHF
In conclusion, despite the interest rate advantage of the Australian dollar, the AUD/CHF pair faces bearish pressure due to broader market sentiment favoring the Swiss franc as a safe haven and technical indicators signaling potential downside. Traders should watch SNB communications and global risk sentiment closely for directional cues
The interest rate differential between Australia and Switzerland is a key driver of the AUD/CHF exchange rate. When the Reserve Bank of Australia (RBA) raises interest rates relative to the Swiss National Bank (SNB), the Australian dollar (AUD) generally appreciates against the Swiss franc (CHF), and vice versa.
How Interest Rate Differentials Influence AUD/CHF
Higher Australian Interest Rates: When the RBA sets higher interest rates compared to the SNB, it attracts foreign capital seeking better yields. This increased demand for AUD leads to its appreciation against CHF, pushing the AUD/CHF exchange rate higher
Lower Swiss Interest Rates: Switzerland traditionally maintains very low or even negative interest rates to prevent excessive appreciation of the CHF and support its economy. This low yield makes CHF less attractive relative to AUD when Australian rates are higher, further supporting AUD strength.
Carry Trade Effect: The positive interest rate gap (for example, RBA at 4.25% vs SNB at 0.5%) incentivizes traders to buy AUDCHF to earn the interest rate differential (positive swap), which can sustain demand for AUD against CHF.
Safe-Haven Status of CHF: Despite the interest rate differential, CHF often strengthens during times of global financial uncertainty due to its safe-haven status. This can offset the interest rate advantage of AUD, causing AUD/CHF to decline even if Australian rates are higher.

Bullish bounce?The Cable (GBP/USD) is falling towards the pivot and could bounce to the 1st resistance.
Pivot: 1.3338
1st Support: 1.3276
1st Resistance: 1.3442
Risk Warning:
Trading Forex and CFDs carries a high level of risk to your capital and you should only trade with money you can afford to lose. Trading Forex and CFDs may not be suitable for all investors, so please ensure that you fully understand the risks involved and seek independent advice if necessary.
Disclaimer:
The above opinions given constitute general market commentary, and do not constitute the opinion or advice of IC Markets or any form of personal or investment advice.
Any opinions, news, research, analyses, prices, other information, or links to third-party sites contained on this website are provided on an "as-is" basis, are intended only to be informative, is not an advice nor a recommendation, nor research, or a record of our trading prices, or an offer of, or solicitation for a transaction in any financial instrument and thus should not be treated as such. The information provided does not involve any specific investment objectives, financial situation and needs of any specific person who may receive it. Please be aware, that past performance is not a reliable indicator of future performance and/or results. Past Performance or Forward-looking scenarios based upon the reasonable beliefs of the third-party provider are not a guarantee of future performance. Actual results may differ materially from those anticipated in forward-looking or past performance statements. IC Markets makes no representation or warranty and assumes no liability as to the accuracy or completeness of the information provided, nor any loss arising from any investment based on a recommendation, forecast or any information supplied by any third-party.

LINK/USDT on the 4H timeframe)Trend:
The market is in a bullish structure with a clear series of higher highs and higher lows.
Support & Resistance:
Support Zone: Around $13.70 – $14.00 (just below current price, previous consolidation area).
Immediate Resistance: Around $15.94 (marked on your chart).
Major Resistance: Around $17.52 (also marked).
---
Trading Plan:
Entry Point (Buy):
Current price zone (~$14.98) is viable if price breaks and holds above $15.00.
Alternatively, a retest entry around $14.50–14.70 (for a safer entry near support).
First Target:
$15.94 (marked as your first target box).
Final Target:
$17.52 (major resistance and final target marked on chart).
---
Stop Loss Suggestion:
Below recent swing low: around $13.90 (under support area).

BTCUSDT Bitcoin (BTC) is the world’s first and most prominent cryptocurrency, introduced in 2009 by the pseudonymous creator Satoshi Nakamoto. It operates on a decentralized, peer-to-peer network using blockchain technology, which ensures transparency, security, and the absence of a central authority. Bitcoin’s supply is capped at 21 million coins, making it a deflationary digital asset
How Bitcoin Works
Blockchain: Bitcoin transactions are validated and recorded on a public ledger called the blockchain, maintained by a global network of nodes.
Mining: New transactions are confirmed through a process called mining, which involves solving complex cryptographic puzzles. Successful miners are rewarded with new BTC, though this reward halves roughly every four years in an event known as the "halving".
Decentralization: Unlike traditional banking systems, no single entity controls Bitcoin. Anyone can participate in the network by running a node or mining.
Security: Bitcoin’s security relies on cryptography and the distributed nature of its ledger. Hardware wallets are recommended for safe storage.
Key Features
Limited Supply: Only 21 million BTC will ever exist, contributing to its scarcity and store-of-value characteristics.
Global and Borderless: Bitcoin can be sent anywhere in the world without intermediaries.
Transparency: All transactions are publicly recorded and verifiable on the blockchain.
Volatility: Bitcoin’s price is highly volatile, influenced by market sentiment, macroeconomic factors, and regulatory developments.
Historical Context
Genesis Block: The first Bitcoin block was mined in January 2009.
First Transaction: In 2010, 10,000 BTC were exchanged for two pizzas, marking the first real-world Bitcoin transaction ("Bitcoin Pizza Day").
Growth: Bitcoin’s price has experienced dramatic increases and corrections, with notable all-time highs in late 2024 and early 2025.
Conclusion
Bitcoin remains the leading cryptocurrency by market capitalization and adoption. Its decentralized nature, capped supply, and robust security model have established it as both a digital currency and a store of value. The current price hovers around $95,000, with ongoing volatility reflecting global economic trends and evolving investor sentiment.

DENT +300%!DENT +300%!
DENT has developed a global marketplace for the buying and selling of Telco assets like eSIM digital SIM cards, mobile data packages, voice minutes and top-ups. Over 25 Million users have already registered for our services, and products with over 220 Telcos already available on the platform.
As a digital and global operator, DENT provide to their customers the most convenient way of staying online while traveling. No more expensive roaming fees!
