EURCHFThe trend was bearish
Bullish divergence
Reversal pattern
Head and Shoulders
No continuation pattern
Head and Shoulders

AUDJPYThe trend is bullish, and now it is making a correction. No divergence also has resistance if it breaks, we will go far, and also have a head and shoulder pattern.

NASDAQ Pressure Still to The DownsideI know many a people are anticipating new ATHs here but I beg to differ.
I think pressure to the downside will likely resume. I am just waiting patiently to see how far up the bullish correction goes so I can continue to short. Or alternatively, a break and retest of the current H1 support if price does not pull back up.
My overall bias is still bearish here.

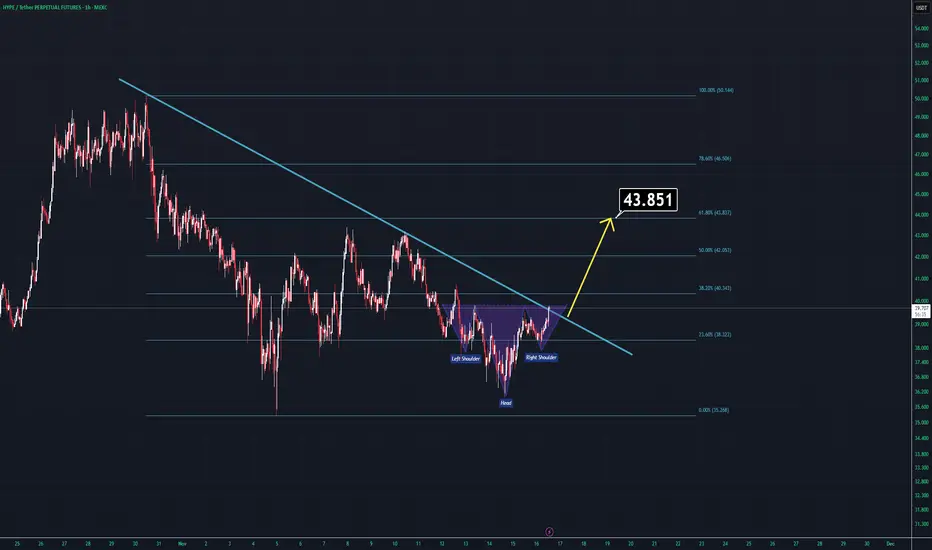
HYPE Analysis (1H)Very basic PA pattern has formed on HYPE/USDT short term chart.
Trendline is about to be gone and there is inverse head and shoulders pattern which is going to be broken very soon.
I believe the target must be around 0.618 retracement levels.
Have a good day.
What the HEX?!Where is the HEX price pointing towards.
This is HEX on #Pulsechain btw.
I suspect a zero will be added in the coming year.
Price is action is getting compressed against a key level which has been tested plaenty of times before.
So in effect a floor that is very likely with minimal strength to uphold an exit stampede during a crypto winter.

Chuck's coin teetering on the brink of a dramatic plunge to 9cCardano, along with many other high market cap tokens, certainly stands out.
As we find ourselves in the crypto bear market,
I would argue that we have actually been in one for quite some time now.
The rapid declines can catch newcomers off guard.
Meanwhile, those who have weathered several cycles tend to quietly withdraw and wait for BTC to undergo its usual year-long downturn.
Will BTC hit a bottom again next November, similar to the previous four-year cycles?
The odds still seem to favor a yes.
Even with the influx of institutional capital.
This situation simply means that the OGs finally have the liquidity to cash out completely.
And they have been doing so with great intensity since the summer.
Unfortunately, altcoins do not benefit from this liquidity, and there are hardly any profitable wallets aside from those of founders and VCs who essentially created the coins or acquired them for a pittance.
Retail investors will likely bear the brunt of falling for the hype once more.

Palantir reversal underway.Here is the #PLTR chart compared to Silver.
We can observe a softness in this ratio.
This has formed a minor head and shoulders pattern, initiating a downward trend.
In the end, I truly believe that the significant inverse head and shoulders breakout is probably going to be tested.
Michael Burry's puts might very well yield substantial returns as a lot of the AI trade experiences a retracement or backing and filling following some massive upward movements.

TFC | Regional Banks Will Rise | LONGTruist Financial Corp. is a financial holding company, which engages in the provision of banking services to individuals, businesses, and municipalities. It operates through the following segments: Consumer Banking and Wealth, Corporate and Commercial Banking, and Other, Treasury and Corporate. The Consumer Banking and Wealth segment consists of Retail Community Banking, National Consumer Finance, Services, Payments, Wealth Management and Banking Products and Professional Services and Mortgage Banking. The Corporate and Commercial Banking segment consists of Corporate and Investment Banking, Commercial Community Banking and Commercial Real Estate. The Other, Treasury and Corporate segment includes management of the company's investment securities portfolio. The company was founded on December 6, 2019, and is headquartered in Charlotte, NC.

MDT | Monster Rally Incoming!!! | LONGMedtronic Plc is a medical technology company, which engages in the development, manufacture, distribution, and sale of device-based medical therapies and services. It operates through the following segments: Cardiovascular Porrtfolio, Neuroscience Portfolio, Medical Surgical Portfolio, and Diabetes Operating Unit. The Cardiovascular Portfolio segment includes products for the diagnosis, treatment, and management of cardiac rhythm disorders and cardiovascular disease. The Neuroscience Portfolio is made up of cranial and spinal technologies, specialty therapies, and neuromodulation divisions. The Medical Surgical Portfolio is comprised of surgical innovations and respiratory, gastrointestinal, and renal divisions. The Diabetes Group segment offers insulin pumps, continuous glucose monitoring systems, and insulin pump consumables. The company was founded in 1949 and is headquartered in Dublin, Ireland.

CADJPY // Inverted head and shoulders formationAlthough there is a reverse head and shoulders formation on the chart, the first target exit is 113.494, which corresponds to Fibo 1.414. If the level is above the level I mentioned, the main target is 117.476.

Inside the falling wedge: H&S followed by ascending triangleWe are here looking at the end of a falling wedge, here a H&S (+double top) was formed causing the price to go down and a retest from the long term uptrend line. We bounced from this and can see a ascending triangke there. We have seen that before inside this same wedge. Will we see a breakout occur (market with orange circle) the closer we get to Dec? What else is expected for Dec? The possible end of QT (which is bullish for us)! See my linked idea also.

Score big with FuboTV: Betting on Messi magic & the World CupThis trade idea leverages the synergy of a next year's marquee sports event with global icons like Messi and Ronaldo.
Which could translate into more streaming subscriptions and longer viewer hours (potentially)
The technical setup is also clear...
With a nice inverse head and shoulders having been formed.

TKC – Multi-Year Inverse Head & Shoulders Formation PotentialA potential multi-year inverse Head & Shoulders structure appears to be developing on Turkcell’s U.S. ADR (TKC) monthly chart.
This is a slow-forming, long-cycle reversal pattern, so completion may take time even few years — also future dividend adjustments will naturally shift the historical price anchors on the ADR chart.
The neckline sits around the 8.00 USD area.
A monthly close above 8.00 would be the structural trigger confirming the reversal.
The measured move from head to neckline projects toward the 13.70 USD area.
This level also aligns with a major Fib confluence zone:
• 61.8% retracement of the 2007 high → 2022 low
• 78.6% retracement — both cluster between ~13–14 USD, reinforcing the significance of that target zone.
Invalidation sits below 4.22 USD.
A sustained move under this level would break the right-shoulder structure and negate the multi-year reversal thesis.
This setup is worth monitoring — high-timeframe reversals can be slow to complete, but meaningful when they do.
Macro note : This stock sensitive to Türkiye’s economical outlook.
Focus on the chart, not the headlines.
(Educational idea – not financial advice.)

Could TRON #TRX 6X v #BITCOIN TRXBTC
has very good market structure
(higher high's , higher lows's)
for the past 3 years.
Overlooked , & under-appreciated it seems like, in my view on it's sentiment on Justin's success of network adoption.
We can see a clear Inverse head and shoulders
with a very key neckline level
that if broken with strength
could a indicate a run at the LOG target.
A disappointing TRX may only reach the linear target and not much beyond.
My TRXUSD chart which I am watching also does point to a stellar Bull market for TRX

SPX – Bounce or Break?The latest sell-off comes as higher yields and softening growth expectations weigh on risk. SPX is now testing the lower bound of the August channel and the anchored VWAP – a crucial confluence.
A reaction here sets the tone. A bounce could keep the structure intact, while a clean break opens the door to a broader correction and more cash waiting on the sidelines.
What’s your read?

XAUUSD Short Trade SetupTrend: Bullish
Divergence: Bearish
Reversal Pattern: Head N Shoulder
Bias: Bearish
Scenario: Entry at Neckline breakout
Trade Plan
Stop Loss: 4216
Entry Level: 4140
TP: 4064

Mazdock 2800 neckline target 3000Mazdock is ready for breakout above 2800
It should hold the level atleast 1 hr above 2800
To achieve 3020 target.
2800 is neckline of head and shoulder and also a crucial resistance.
Given the good quarterly result strong possibility of the target to meet within a month.

Bullish Inverted Head & Shoulders - GBPUSDHello traders,
The GBPUSD price has formed an Inverted Head & Shoulders pattern.
Currently, the neckline is broken, confirming bullish momentum! 🚀
📈 Expecting a bullish move
🎯 Target: 1.32475

SILVER | Inverse Head & Shoulder Forming – Big Move Ahead?#SILVER is currently moving sideways and forming a perfect Inverse Head & Shoulder pattern on the 1-hour timeframe
This pattern often signals a potential bullish reversal, but we’ll wait for confirmation — a clean breakout above the neckline or resistance zone.
Trade Plan:
Wait for breakout and retest of the neckline/resistance
Enter long after confirmation
Use proper risk management (SL below the right shoulder)
If the breakout holds, #SILVER could start a strong bullish rally soon!
What’s your view on this setup? Are you bullish or waiting for more confirmation?
Drop your thoughts in the comments!
#Silver #XAGUSD #PriceAction #TechnicalAnalysis #TradingSetup #ChartPattern #HeadAndShoulders #BullishReversal #TradingViewCommunity

$TZA: BULLISH PATTERNS AMEX:TZA : This chart is quite interesting.
Starting point: The MACD indicates a buy signal, and the 14-period RSI is at 60 (though not shown). Therefore, everything considered, the trend appears to be bullish.
I can identify two possible patterns:
1) Since the low on October 27, AMEX:TZA is unfolding a Zigzag (ABC) pattern. The 1x1 extension for the wave (C) at 9.22. Additionally, a double bottom pattern is present with a target of 9.45.
2) AMEX:TZA has formed an inverse head and shoulders (IHS) pattern with a target at 10.52. It’s worth noting that the right shoulder may be somewhat indistinct.
In any case, we will see how the price develops.

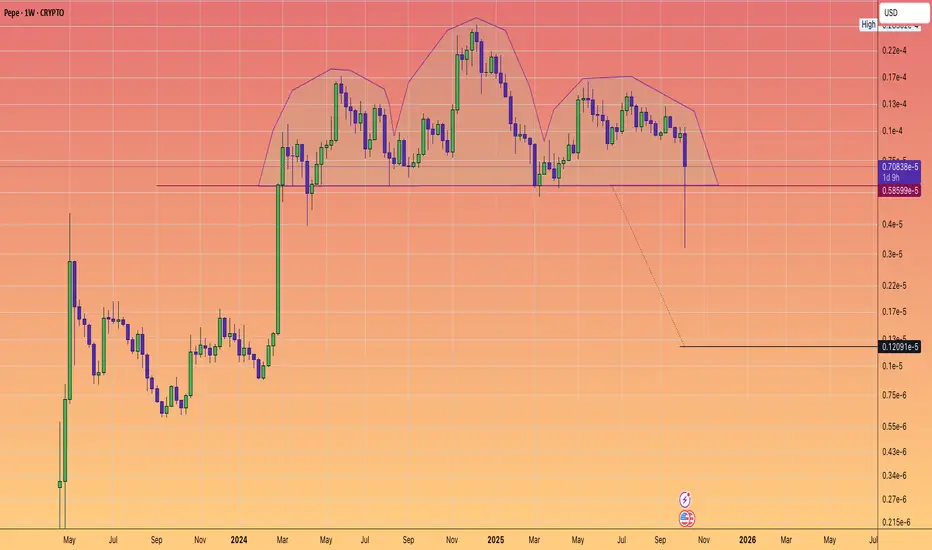
$PEPE: MAJOR HEAD and SHOULDERS BREAKDOWN WARNING.🐸🐸🐸
⚠️⚠️⚠️
Pattern formed, Big Move Ahead?
The weekly chart of #Pepe has confirmed a classic head and shoudlers pattern - a powerful bearish setup.
After over 1.5 years of building this structure, price decisively pierced the neckline with a sharp drop.
Suggesting that a weekly close below the neckline could trigger an accelerative towards the pattern target.
Key Levels
Neckline: $0.0000058599
Target: $0.0000012091
Why does it matter?
Head and shoulders are the most trusted reversal technical patterns. Coupled with declining and weakening sentiment. This pattern warns of more downside--- unless buyers can mount a quick rescue.
What's your strategy?
Are you shorting the breakdown, waiting for the target, or looking for a fake-out reversal?
Drop your thoughts/Analysis or questions in the comments!
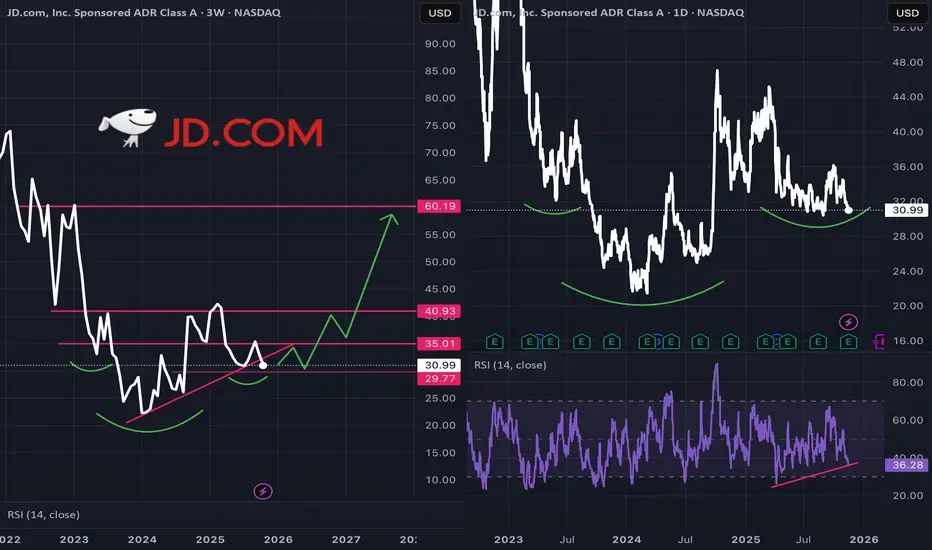
JD.com large cap value worth buying nowJD.com just beat earnings showing an ability to adapt to the current environment in China.
Simultaneously we see calls for Chinese policy makers to continue stimulating the consumer to ward off a very dangerous deflationary death spiral.
I'm reaching a bit here, but it we may be setting up a large inverted head & shoulders pattern on the charts.
JD.com
* is profitable
* pays a dividend
* has lots of cash
* proved it can adapt to tough environment
* beaten earnings forecasts as far as the eye can see
* tremendously depressed share price
Bullish here -- one of my top two holdings.
Corn butterfly Been bullish on corn 🌽 for a good while. This is long term harmonic pattern that made me that way. The bottom which recently occurred was marked by three distinct doji type candles. Really believe commodity supercycle is very close. Oil, corn , metals obviously 🙄.
