BTCUSD 1D MACD CROSSOVER SHORT TRADE1 - Wait for the MACD lines to develop a higher high followed by a higher high swing point.
2 - Connect the MACD line swing points that you have identified in Step #1 with a trendline.
3 - Wait for the MACD line to break below the trendline. (Enter at the Market Price as soon as the MACD line breaks below).
4 - Use Protective Stop Loss Order. (Place the SL above the most recent seing high).
5 - Take Profit when the MACD crossover happens in the opposite direction of our entry.
Higherhigh

BTCUSD High Time Frame Breakout Imminent - IMPORTANT UPDATE Hello My Followers!
Today’s update will focus on BTC’s higher timeframe, trading very close to its apex where key levels diverge - a trade opportunity is coming to fruition!
Points to consider,
- Strong bull trend on weekly
- Key support/ Resistance converging
- 21 week MA as key support
- Volume currently below average
- RSI broke key resistance
- Stochastics in upper region
Bitcoins weekly projection looks very bullish with another potential higher low established as price travels towards the down sloping resistance.
Key support and resistance levels are converging, signalling a true apex in the chart leading to an imminent break.
The 21 weekly moving average as of historic significance is very valid in determining whether we are in bull or bear market, right now is supporting price.
The RSI has broken key resistance, a retest for confirmation is likely, and this is the first time since April that the RSI has breached it. The stochastics is trading in the upper regions, can stay trading here for an extended period of time, however lots of stored momentum to the downside.
Volume is currently below average, an increase will confirm a true breakout from BTC’s apex, this will overall confirm the trend of BTC.
What are your thoughts?
Please leave a like and comment,
And remember,
“Those traders who have confidence in their own trades, who trust themselves to do what needs to be done without hesitation, are the ones who become successful. They no longer fear the erratic behavior of the market. They learn to focus on the information that helps them spot opportunities to make a profit, rather than focusing on the information that reinforces their fears.” Mark Douglas

Higher high achieved!! Closed my 5x long.This is fantastic news for the bulls as we just achieved a higher high on the 1 day chart. I now expect us to go back down and fill the cme gap at 8.5k. If so I will be loading up on alts and btc in that range. I closed my 5x long at 10400 and am very happy with the results.

CMEs have just confirmed a Bitcoin trend reversal!Welcome!
I´ll keep this short and sweet, as always.
Apart from the professional traders or maybe those who have been in the crypto game for quite a while now, nobody knows that Bitcoin´s price action isn´t dictated by Bitstamp, Binance etc. but by CME Futures. As they are an institutional broker, they essentially represent smart money.
Looking at CMEs, the first thing that stands out to me is the volume. You can see that the volume is abnormally high compared to the recent months, higher even than the volume during the 2019 rally. What does that mean? It means that while the previous Bitcoin rally didn´t catch the interest of institutional buyers, the bottoming and consolidation at the 7k levels has.
Secondly (and the focus of this analysis), we have just closed the weekly as a higher high which means, very likely, that BTC has reversed the trend from a downtrend to an uptrend. EXTREMELY important piece of information!
Finally, the weekly closed outside the bollinger bands, which is normally just stupidly bullish. Why? Because it implies that what follows next is going to be a bollinger band expansion on a WEEKLY timescale.
I really dislike being too biased when it comes to the markets but the way things stand in the moment, it is actually very possible Bitcoin will reach prices north of 14 000$ in the next two months. Will post an additional analysis on it, so keep an eye on that!
Thank you for reading
Mansasuma

Higher High and Higher low Uptrend stratagy + my thoughts on WTIthis is how I identify a reversal or uptrend and trade pullbacks.
works best on jpy pairs.

BTCUSD breaking up from current bull pennant?If we break out bullishly here, it looks very bullish indeed, we have a couple horizontal resistances to overcome the current one at 9595, and the grey horizontal a few pips above that...the projected breakout target also requires we break above this turquoise horizontal as well and if we were to do that that would be a HUGE bullish sign BTCUSD will have achieved the ever important higher high...I anticipate it will at least rise up to meet this horizontal if it breaks out here if it doesn't reach the entire bull target....I also expect a correction afterwards to create a handle on what will then be a freshly formed cup...if it does this that cup and handle once broken can take us above 14k but I anticipate the handle will dip down far enough to fill the gap around 8.5k before heading back up to the rim of the cup. 1st and foremost however we need to breakthrough the current strong resistance of 9595 to be confident we are going to see a bullish breakout here.

Finally a higher high on xrpbtc!XRPBTC breaking up with authority! Has now sent a wick above the 1 day 200ma...I will wait to see a 1 day close above the 200ma or bullish action taking price action multiple pips above the 200ma + a surge in bullish volume before I'm confident it won't be rejected by the 1 day 200(in blue)

Structure longPrice surpassed previous daily high and seems so be rejecting this level alongside with the 15 day EMA.
Wait for a confirmation before entering.

ETHUSD - Possible test toward higher highsA good daily close above the 126~ range seems good for looking at making higher highs throughout this range.


Profit After Weekly AnalysisFrom my previous analysis on the EUR/USD a week ago, I saw major level of structure around the 1.09899, I waited for my 3 points of reference to tell me if price was going to trend, but price came lower than I expected, testing the 1.09899 as support. Eventually, Price then shot up breaking the previous high forming a higher high, then I formed a small trend line in which price came down, retested, and formed a higher low. so I then saw an entry opportunity, and price came all the way up to my take profit a few pips below major resistance only 6 hours later.

Long position AUDUSDWeekly Daily support area
lower high lowerlow has changed to higher high and making higher low now
divergence visible on 30 min
target 1----- 0.69200 (previous daily candle high)
target 2----- 0.69800 --- (if high broken) ( resistance above daily high)
strategy --> you can enter now with stop below lowest price + 10pip (aggressive entry)
or you can place stopbuy above high and add smaller trade all the way to target (what we suggest)
remember to calculate your risk first and dont take big risk (not more than 3%)

USDJPY | DailyThree touches of 109.279 after which we see that there is a drop in price. Maybe he'll do another HL touch then it will reach 109,480 and he will form double TOP if that happens and if it breaks that uptrend it will go down

A speculative path for BTC Price actionNot financial advice...sometimes it's fun to try to use mthe paint brush to paint a speculative path for where I think BTC price action is going just so later I can click play and see how close I was

USDJPY - Trade in Trend Direction - Higher High expected Hi Traders!
The market is in an uptrend and
now it reached a strong resistance at 109.00.
It is ranging there since last week and we have to look for a breakout.
Our risk-to-reward ratio is 1 to 2.
We recommend to buy for being part of the next higher high!
Thanks and good luck :)!

AUDUSD potential for Long position(Intraday)As you can see from chart- price failed to make new Lower Low on 28 Oct 2019 and this could be starting of impulse wave for uptrend and since that price go up to make a new Higher High(HH) and Higher Low(HL) until today if u can see from H1 chart.Now price try to make new high from previous daily high on 22 Oct 2019(Box color-Turquoise).My prediction price will go up to find liquidity at high area and go down before buyer start to enter position at discount price area of 0.68600-0.68675.
As you can see from weekly trendline price will make rejection at upper trendline and need to wait for Price Action for breakout or go minor bearish trend.
This is from Daily chart and Daily chart.
Analysis:
1)based on key level from higher timeframe which is Monthly and Weekly
High on candle monthly August 2019-0.68680
Low on candle monthly May 2019-0.68649
if you can see price rejected that price and go up.
2)Based on trendline major high timeframe
3)supply and demand zone
4)High and low of major turning area.

validating the bullpennant here would give a 1day higher high!we need to break above 12.3k to confirm a higher high and ensure the bull market continues...if this is a symmetrical bull pennant we are in the breakout target is 12449! Just enough for a higher high!

AMD Forms Slip-Slide DowntrendOnce again, AMD has failed to break to a new higher high. Heavy Dark Pool Quiet Rotation™ is thwarting upside action at this time.


WMT Rises on Buybacks Despite Dark Pool SellingBuy Side Institutions using Dark Pools have been intermittently selling off blocks of WMT over the past year. Meanwhile, corporate Buybacks have buoyed price to maintain a higher high trend.

$FTM/BTC trading idea$FTM looking to retest 187 level
- 4H MACD turning bullish with a nice curve
- found strong support
- making HH,HL
- rsi is however turning overbought

BUY WTC On the Daily it looks like the the candle sticks has found new support level of $33.52, with a nice higher high action as well. The chart shows bullish trend on the daily and the weekly, with the Stoch also showing oversold.
Looking to buy above $36.

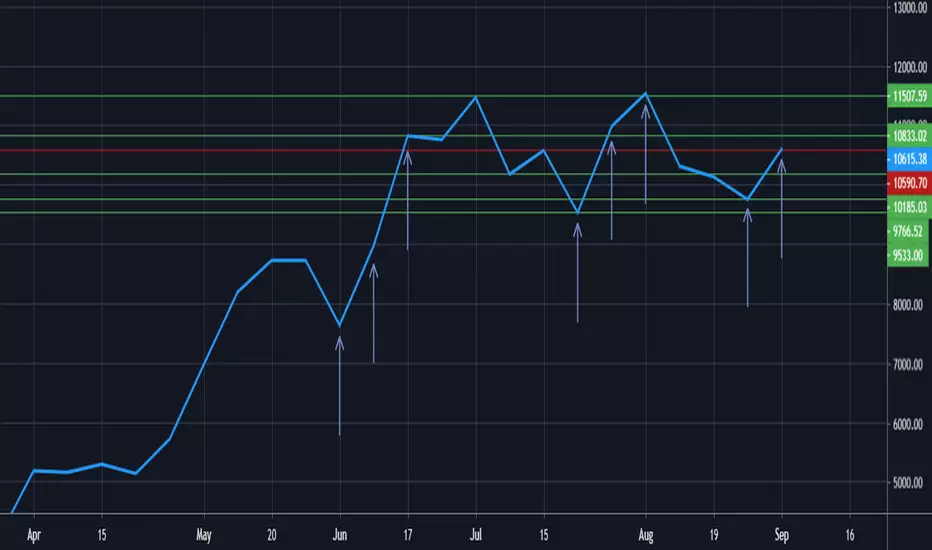
Higher Lows for Bitcoin, Can we Make Higher Highs? Good Evening Traders,
Bitcoin is looking very interesting on the weekly, just over a big resistance mark from July 15 of $10,590 at $10,615.38. Bitcoin has been following an interesting pattern in the last few months. We have seen two weeks of profit follow each low of the cycle, meaning we could see more profit in time to come. We would need to pass $11,507.59 for a higher high to follow the potential higher low at $9,766.52. I would definitely keep a tight eye on this weekly if I were looking to make any moves on Bitcoin. Feel free to compare this to a more zoomed in POV of Bitcoin on the hourly chart, along with some of my technical analysis here .
Disclaimer: This is NOT trading advice! These are merely my opinions that I have posted for you to use as one of hopefully many tools for making YOUR OWN decisions. I hope you all kill it, but I am not responsible for any financial losses. Thanks for reading!