HOT set for potential breakout!Please refer to chart for analysis. Based on the % gain during the last bull run, we can expect to go up to the 70 cents.
Buy between 0.0118 and 0.015
Leverage 20x
TP 1 - 0.144
TP 2 - 0.157
TP 3 - 0.171
Additional confirmation:
1. Fibonacci time zone
2. Trading above 20 day EMA on current uptrend.
3. Buyer VOL has been low the past few days, yet Seller VOL is not dominant.
HOT

Hot/usdt market capObviously holo market cap bottomed out and is going to make higher high it means that more liquidity on the way for holo chain in other hand more fundamental news comes out from the coin that makes it growing fast.
"Not suggested to buy or sell"

HOTUSDT Technical Analysis
Welcome back Traders, Investors, and Community!
HOTUSDT on h4 has formed a Flag. After breakout we can expect the price to go higher. There might be a Pullback before it goes up.
⬆️Buy at Resistance Breakout or Buy at 0.009724
⭕️SL @ 0.009445
✅TP1 @ 0.012000
✅TP2 @ 0.013500
✅TP3 @ 0.016000
Check the Links in Description and If you LIKE this analysis, Please support our page and Ideas by hitting the LIKE 👍 button. ❤️ Your Support is really appreciated! ❤️
Traders, if you have your own opinion about it, please write your own in the comment box. We will be glad for this.
Feel free to request any pair/instrument analysis or ask any questions in the comment section below.
We will have more FREE forecasts in TradingView soon
Have a Profitable Day

HOTUSDT see and watch :)
Pulbeck has reached the desired support area and is ready to go to the next goals ...

hot/ usdt trend new updateit seems that correction will continue till 008-009 then impulsive wave gonna be rise again.
"not suggested to buy or sell"

HOT USDT pair Thought Process 25% Gains Coming?This is my thought process on HOT.
I think Price Action (PA) should move to the up side.
25% Possible
This is not financial advise, this is for entertainment purposes only.
Thank you,
Trade Intuition

$HOT #HOT #Holo quickie chart by @cryptoKnee TonyTalonQuick look at Holo log. Will be watching to see if these supports hold. Looking good for an impulse in the works, could be an A , could be a 1 of the wave 5 if it completes as an impulse.


HOT.USDT (Y21.P5.E1).Macro TargetHi Traders,
By using fibonacci with 2 or 3 methods, the following is what I see as the targets, based on we are doing wave 4 to 5.
Note I have also tried out the fib time zone to find when as well.
It will be interesting for me in the future to see if any of my approaches work.
1st target range is based on method 1 > price between 0.35 to 0.54 with potential over performance to 0.10, parabolic phase 2.
Note the dates, 0.618 fib time is around end of September 2021 and the other, end of Jan, 2022.
All the best,
S.SAri.

Good position for HOT and 10% profit The Holochin crypto (hot) is supported in the 4-hour frame. Check out If a positive reaction has been supported, a stairs for the specified specified and 10% of the profit.

Holo (HOT) Heading to a CentHolo (HOT) is currently consolidating within a bullish pennant, I'm expecting it to make a move towards a cent on breakout.
NFA - DYOR - Please like and follow if you found this idea helpful - Thanks! 🤑

hot/btc ready to flywhen ppl are focused on btc and some few alts there are coins with capacity of growth at the market. one of these coins is hot/btc that i expect by about 270 percent of profit in few months.
"not suggested to buy or sell"

HOT triangle breakoutHolo broke up this triangle 📐 and backtested it's upper edge so I think there is chance for run to 0.007425 and even higher. I set BUY LIMIT order in anticipation of another dip so I can get in. Come on HOT!🔥
ENTRY : local high @ 0.006443
SL : local low @ 0.00621
TARGET : height of the triangle projected from midpoint of the local range (BUY LIMIT - SL) @ 0.007425
RRR : 4.2
INVALIDATION : when SL level hit
Like👍, follow✒️, enjoy📺!


Holochain / Hot/USD ... The forecast for the next few WeeksThe chart speaks for itself !
I would be interested in where the journey will go.
Since I can't get the software zoomed out any further, I can't do an analysis for the next few months / years.
I use the free version of Tradingview
Since Bitcoin will probably behave differently than we all suspected, holochain will also adapt to it, and unfortunately that is short, as reluctantly as we hear it. Whereby buying near is not a bad opportunity, is it?
So please don't miss the opportunity.
I try to keep you up to date with the Coin

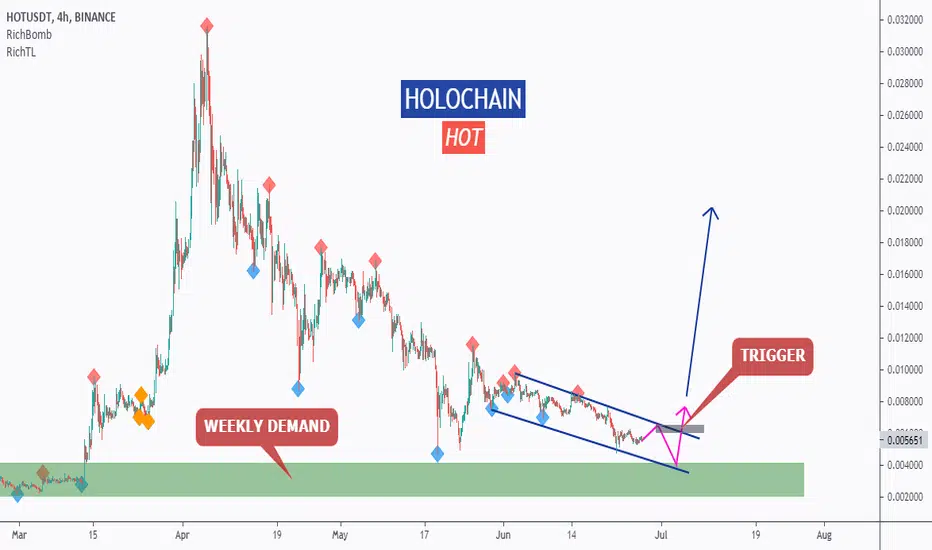
HOT - Potential Bullish Reversal!Hello everyone, if you like the idea, do not forget to support with a like and follow.
HOT is sitting around a strong weekly demand zone in green so we will be looking for buy setups.
Before we buy, we want the buyers to prove that they are taking over again.
You don't want to buy a bearish market right?
on H4: HOT is forming a channel in blue but our upper trendline is not valid yet, so we are waiting for a new swing high to form around it to consider it our trigger swing. (projection in purple)
Trigger => Waiting for that swing to form and then buy after a momentum candle close above it (gray zone)
Meanwhile, until the buy is activated, HOT would be overall bearish can still trade lower.
Good luck!
All Strategies Are Good; If Managed Properly!
~Rich
I INVESTED IN HOLO PROJECT SINCE THE PRICE FROM $0,0007Disclaimer : Not Financial Advice.
This is just for entertainment and personal opinion.
Good luck!!!

HOTUSDTHello to you all. Mars Signals team wishes you high profits at all times.
We are in a 4 hour time frame. As you can see, the price has started to move up after breaking its resistance. We built a canal for you dear ones, the price has jumped upwards and broken the canal. We have identified support and resistance for you. Do not forget the stop loss.
Warning: This is just a suggestion to you and we do not guarantee profits.
Wish you luck!

HOTUSDT, LOOKING FOR A GREAT RISE !!!Hey There,
Here we have the daily chart of HOTUSDT.
Amazingly, The price is reaching the strong support zone:
From 0.0057 to 0.0028
-------------------------------------------------------------------------
In any case, trading is not appropriate now.
Just keep your eyes OPEN... Take care >_-


HOTUSDTAccording to the situation of the chart, it can be predicted that if the resistance is broken, it is ready to reach the target of 0.1
