BTC Daily Analysisbased on our previous analysis bitcon made an announced ATHs and drop down from that point.
it is near our important support levels. we expect BTC ranges between its support and resistance levels.
in weekly timeframe we can't see any signs of downward movement.
if any of these levels breaks with ichimoku confirmation, i will update the analysis.
Ichimokukinkohyo

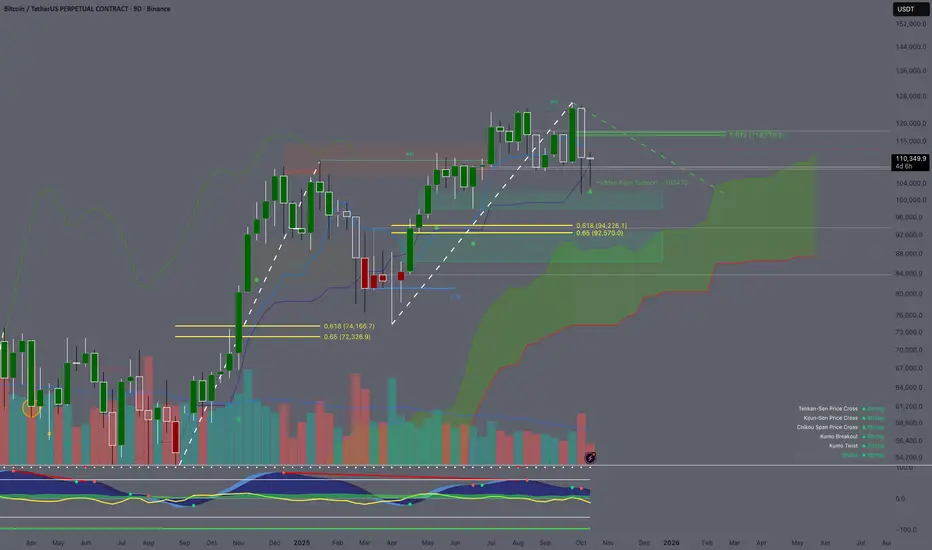
9D Timeframe Analysis using Ichimoku Cloud / Fib/ ICT
Price Action: The candle is pushing north and attempting to turn into a green candle. If the candle successfully turns green and creates a big long wick. The candle can be the support candle for this bullish. The candle won't be closed until this Friday night. Since the candle already discovered the south side and created long wicks. If the candle turns green we will experience the new discovery price on the north side.
Ichimoku Cloud: The price is currently trading above the Kijun-Sen ($109,454.3). If the price continues trading above this level. The trend is validated by the Kijiun-Sen. The Kijun-Sen sometimes plays a role such as a healthy pull back point where you can enter for a long position or a confirmation of a trend. The prices usually pulled back to this line after all time high. Price usually consolidated between (above/below) the lines before the pump in a bull market. The Kijin-Sen is also pushing upward which is a bullish sign but the Tenkan-Sen is flattened out. When the Tenkan-Sen is flat out, the price tends to trade sideways or we can say that the momentum has reduced. Cloud A is still shifting upward while Cloud B has flatted. Cloud A shifting upward means the momentum is still there but the current momentum which is the Tenkan-sen is flat.
Fibonacci: I drawed a fibonacci from $126208.5 to $101.516.5. The all time high point to the 20 billions liquidated event in crypto space. 1 candle made all time high and 1 candle flash crashed to the fair value gap. With the fibonacci, the 0.618 and 0.65 are showing $116,776.2 and $117,566.3. If the low range fib is the bottom then the price has to retrace back to 0.618 in others to continue the massive sell off. So this is playing a key level on the bears for short.
Fair Value Gaps (FVGs): There is a fair value gap when I draw a fip from the previous low in April to the all time high end of September. There is a fair value gap at the 0.65 fib level. Which shows that if the price is retraced back to that level. We are sill in the up trend in favor of the bull
Cipher B: The vwap is trading below money flow and momentum. The Money flow has flatted out while momentum is going down. This is not a good sign because the vwap is pointing south and trading below moneyflow which could lead to the consolidation. The consolidation is not always bad but shows that the trend is cooling down.
Key Levels: 0.618 from bull and bear. If the price is dropped to the fair value gap which is $94.226.1. The actual fair value gap at 0.65 not 0.618 but those levels go together. We will call 126208.5 the top. But if the price is defense above the Kinjun-Sen and does not retrace at the 0.618 from the high to the wick then we are not at the top yet.
Outlook: The change in Tenkan-Sen and Kijun-Sen. The shift of direction in those will be first noticed before anything other factors. Also price trading above/below/between those levels as well.
#GOLD WILL THE correction continue ATHResistance level:3760-3776-3791
Support levels:3752-3741-3731i expect a pullback 3737-3717 and if the bulls return the price to 3800.
my forecast on #gold is 3880.
By; Honey-trading!

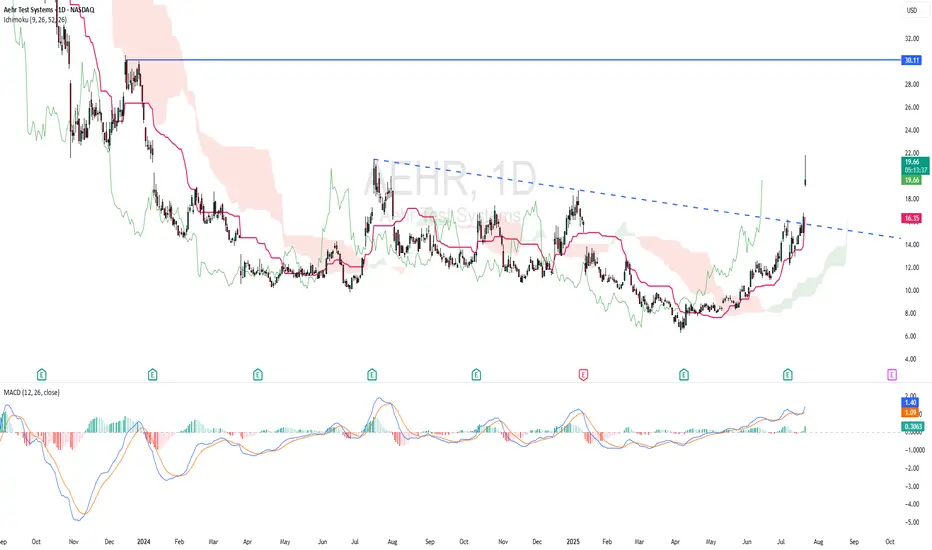
AEHR - RISING WINDOWTechnically AEHR is bullish as the stock made a strong rising window. Based on ICHIMOKU CLOUD, price is above cloud and chikou span is above candlestick - indicating bullish scenario. Kijun Sen is rising. MACD indicator showing bullish momentum.
ENTRY PRICE : 19.30 - 19.70
TARGET : 30.00 (potential almost 50% roi)
SUPPORT : 14.72
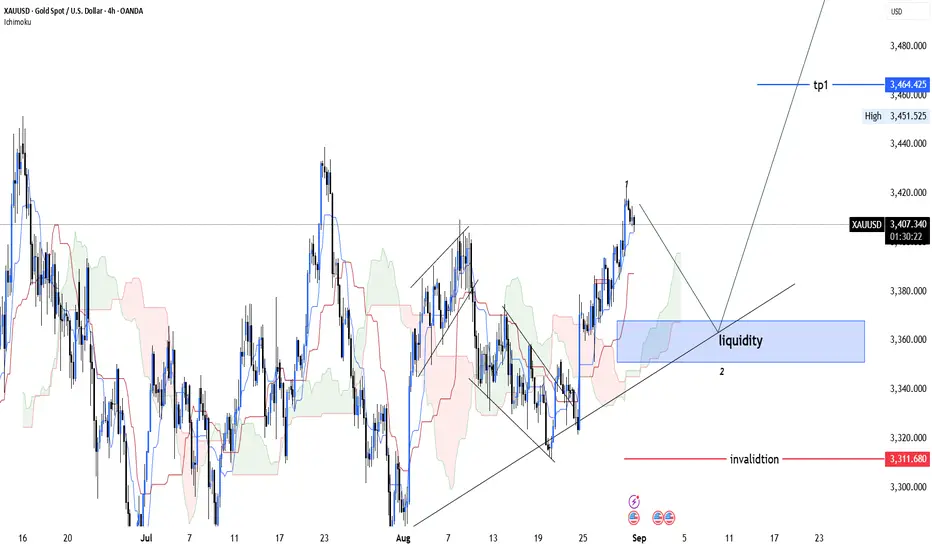
xauusd daily📊 XAU/USD – Wave Analysis
Gold is likely finishing Wave 1 and could correct down to 3352–3370 to complete Wave 2.
🔎 Analysis based on Fundamentals + Ichimoku + Elliott Wave
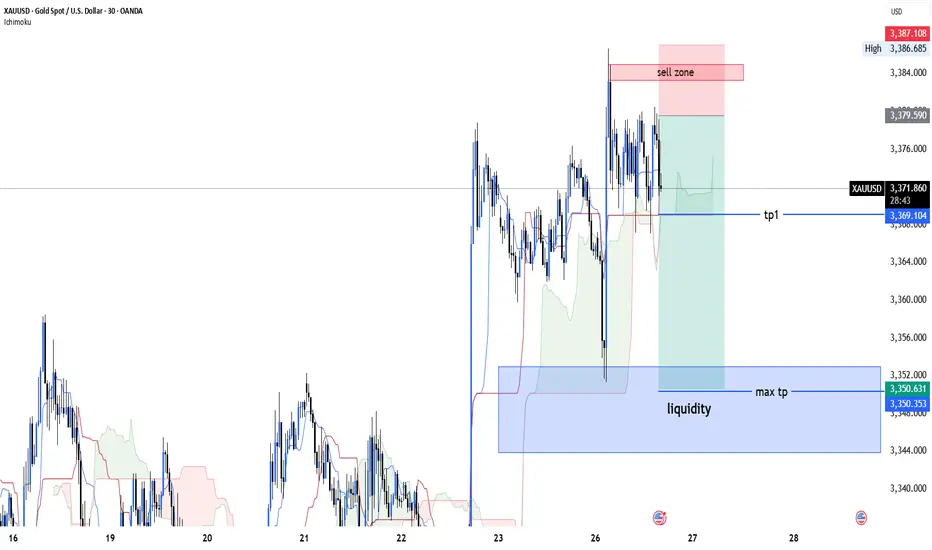
xauusd and Key level#xauusd
#gold
#m15
Key level for xauusd
1. “Gold shows bearish setup with Ichimoku, Elliott Wave, and dynamic resistance levels. Market sentiment supports further downside.”
2. “XAUUSD is facing resistance and signals potential decline. Watch key support levels for price reaction.”
3. “Bearish momentum confirmed by Ichimoku and dynamic levels. Expect further downside if support breaks.”
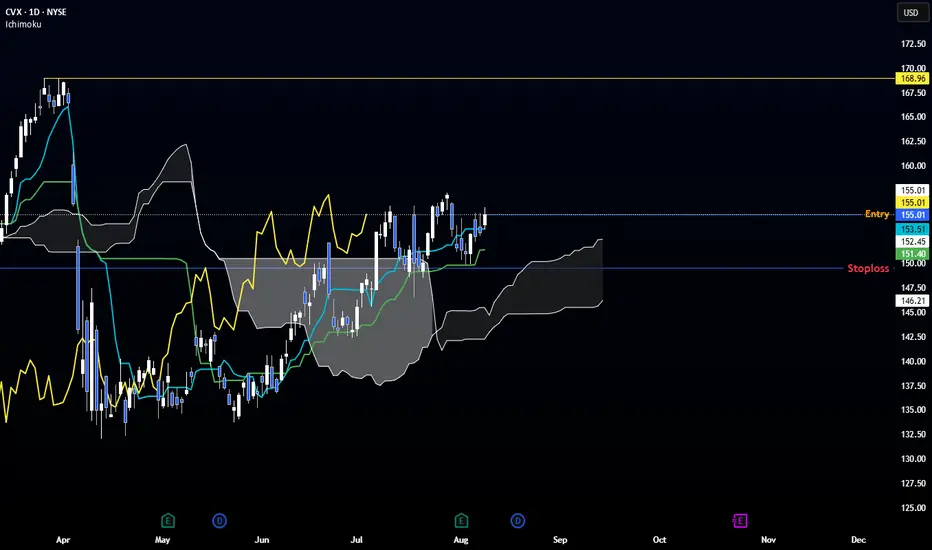
CVX – Ichimoku Bullish Setup
📈 Technical Outlook
☁ Kumo: Large & supportive. Span A flat (pause), Span B bullish.
🔹 Tekan-sen: Broken to downside.
🔹 Kijun-sen: Bounce & pointing up → trend strength.
📍 Chikou Span: Above price → bullish confirmation.
💡 Bias → High probability of upside continuation.
📊 Trade Plan
Entry: 155.01
Stop Loss: 149.55 (below last swing low)
Take Profit: None – trail SL at each new swing low
🎯 Potential Target Zone: 168.96 (major resistance)
⚠ Risk Management
This setup follows Ichimoku principles—let winners run, cut losses early.
Not financial advice. Trade at your own risk.
HAPPYUSDTBased on the overall output of these analyses, spot buying of this cryptocurrency around 0.001 to 0.00088 is reasonable and less risky. As long as these levels are valid, we can expect the price to grow in the form of wave C.
The ideal target of wave C could be around 0.0047.. which has a very attractive range of movement.
Mid-September could be a reasonable time to complete wave B and start the hypothetical wave C.. Also, important times are clear on the chart.
This is just a scenario. Only if the price reaches these areas by re-examining the market can we look for buying.
It should also be noted that this cryptocurrency is an anonymous meme coin with a very small market cap and carries a lot of risk.

BellRing Brands (BRBR) Weekly Gartley@ Key Levels + Kijun SignalIn March 2025, I previously took a look at this budding public company BellRing Brands, Inc. for a long-term investment horizon. It was priced around 74 at the time, then the fall of the overall market status put additional pressure on its stock, although the company itself is booming and meets my fundamental parameters. See the following:
Since then, we had an awesome and confident forward guidance from the company in the last earnings call in May 2025: bellring.com
Now, looking at BellRing Brands (BRBR) once again, on a weekly chart, key technical patterns have formed that look very promising and solid with its many confluences.
TECHNICALS:
WEEKLY:
Many weekly confluences have appeared from a technical perspective. Here is what I see:
(1) There is a clear Bullish Gartley-ish pattern in a weekly retracement to 50% followed by a retracement to 78.6% of a preceding move.
(2) The price is around 78% fib support.
(3) Horizontal area of support: The 50 - 58 area is a whole prior area of horizontal support that was a prior resistance area back in July 2024, and the price has landed back on that area. You know what we say as technicians and investors: past resistance = future support.
(4) MACD Hidden Bullish Divergence (weekly)
(5) The price tested the weekly cloud and broke through; however, bullish extremes were triggered when that happen, which is rare based on all my personal studies. In fact, the current level 55-58 marks the end of a bearish double top cycle that began around March 2025.
(6) A weekly Doji with volume support (classified as a "dVa" in my old notes of Volume Price Analysis).
Here is the weekly chart:
MONTHY:
BRBR is poised to rally Q3 and Q4 2025.
We have a potential monthly bounce of the kijun forthcoming along with good fundamentals going forward supporting the growth of the company in the long term.
** potential monthly Kijun Trend Bounce **
Here is the monthly chart:
Target:
Currently, the price is 58.54. My tentative target is around 140 by March 2026.
Thus, with all the fundamental support, good forward-looking guidance, and the technical I believe that BellRing Brands (BRBR) is at a great price right now. It is prime to continue its stretch of growth for 2025. Looking forward with investor foresight, the case for BellRing Brands and its stock (BRBR) is not only a high-probability outlook of positivity, but a high odds outcome of technical price pattern success. What a great discount.... :)

Bitcoin Strategic Interval – Latency & Asymmetric Bias.⊢
⟁ BTC/USD – Binance – (CHART: 1D) – (June 20, 2025).
⟐ Analysis Price: $106,025.88.
⊢
⨀ I. Temporal Axis – Strategic Interval – (1D):
▦ EMA21 – ($105,772.44):
∴ The price remains fractionally above EMA21, retaking the short-term reactive axis;
∴ Despite prior rejection, current candle shows renewed traction with a solid close above;
∴ The slope is flat–rising, signaling the potential reactivation of local trend continuation.
✴️ Conclusion: EMA21 is tentatively reclaimed – a short-term bullish signal under close scrutiny.
⊢
▦ SMA200 – ($95,921.92):
∴ Long-term structure preserved: price maintains a wide buffer over SMA200;
∴ The moving average exhibits a healthy upward slope, uninterrupted since Q4 2023;
∴ No technical threat detected to the macro-trend structure.
✴️ Conclusion: SMA200 acts as the primary institutional defense line. No stress present.
⊢
▦ Ichimoku Cloud – (105,899 | 105,738 | 102,433 | 105,576 | 106,025):
∴ Price is nestled precisely within the flat upper cloud band – a known zone of consolidation;
∴ Span A and B are beginning to flatten, suggesting temporary exhaustion of momentum;
∴ Chikou remains above price – confirming trend integrity.
✴️ Conclusion: Ichimoku signals a pause, not a break – directional clarity pending.
⊢
▦ MACD (12,26,9) – (Histogram: -364.87 | MACD: 257.20 | Signal: 622.06):
∴ Bearish histogram remains negative, but shrinking for three sessions;
∴ MACD line curling upward with initial convergence to Signal line;
∴ Reversal signal forming but not yet triggered.
✴️ Conclusion: Early signs of MACD cross; confirmation requires follow-through.
⊢
▦ RSI – (53.17 | Avg: 51.74):
∴ RSI reclaims neutral-positive zone, stabilizing above 50;
∴ Structure shows divergence fading, with momentum recovering slowly;
∴ Still far from exhaustion thresholds.
✴️ Conclusion: RSI favors the bulls with cautious optimism.
⊢
▦ Volume (Last 5 Days):
∴ Volume remains muted, averaging 110–120k Bitcoin/day;
∴ No aggressive buy or sell pressure confirmed;
∴ Current move lacks conviction – suggests passive spot activity.
✴️ Conclusion: Price is advancing without volume confirmation – fragility persists.
⊢
🜎 Strategic Insight – Technical Oracle:
∴ Structural trend remains intact and undisturbed on the macro scale;
∴ Short-term bullish reclaim of EMA21 within the cloud, but momentum and volume still lag;
∴ Absence of conviction demands validation from price action or macro catalyst.
⊢
∫ II. On-Chain Intelligence – (Source: CryptoQuant):
▦ 🝰 Exchange Inflow Mean - (MA7):
∴ Metric sits near historic lows (≈0.4 BTC), denoting multi-week suppression of inflows;
∴ Correlates directly with reduced sell-side pressure from whales and institutions;
∴ Price structure remains unchallenged by inflow spikes – consistent with strategic holding.
✴️ Conclusion: Absence of fear or distribution among large holders – bullish backdrop intact.
⊢
▦ 🜍 Estimated Leverage Ratio – (Current: 0.259):
∴ Leverage steadily increasing, now entering historical danger zone;
∴ Elevated risk of cascade liquidations on any sharp downside move;
∴ Suggests the current rally is not organically fueled by spot demand.
✴️ Conclusion: Price structure is leveraged, not grounded – risk of synthetic instability.
⊢
▦ 🝗 Exchange Reserves - (Binance) – (≈544.5K BTC):
∴ Continuous net outflows – multi-month drain confirmed;
∴ Reflects silent accumulation or self-custody migration;
∴ No exchange-driven supply pressure visible.
✴️ Conclusion: Structural supply depleting – passive bullish signal.
⊢
▦ ⚒ Miners’ Position Index - (MPI) – (-1.1):
∴ Readings below 0 indicate minimal miner distribution;
∴ Suggests miners are confident, or at least not forced to sell at current levels;
∴ Historically coincides with market support zones.
✴️ Conclusion: Miner behavior aligned with trend preservation – not resistance.
⊢
▦ 🜚 Funding Rate - (All Exchanges) – (+0.003):
∴ Rates mildly positive, indicating slight dominance of long positioning;
∴ No excessive funding imbalance – healthy sentiment baseline;
∴ Reflects controlled bullish bias with no speculative overheating.
✴️ Conclusion: Longs exist, but not in a way that endangers trend integrity.
⊢
🜎 Strategic Insight – On-Chain Oracle:
∴ On-chain metrics echo the technical chart: structurally sound, short-term vulnerable;
∴ Long-term holders remain disengaged from distribution behavior;
∴ The system is healthy, but carries hidden leverage that may trigger volatility.
⊢
⧉ III. Contextvs Macro–Geopoliticvs – Interflux Economicus:
▦ 🇺🇸 United States – Federal Axis & Risk Channels:
∴ Treasury Yield Curve remains slightly positive (+0.44%), removing short-term recession signal;
∴ 10Y yield elevated at 4.42% – reflects sustained inflation resistance and risk demand;
∴ Fed has signaled no rate cuts before September – QT policy remains;
∴ Speculative expectations for only 1–2 cuts in 2025;
∴ Trump administration signals potential military action in Iran, igniting geopolitical risk premium.
✴️ Conclusion: U.S. monetary regime is steady–tight; geopolitical volatility injects asymmetric risk into crypto valuations.
⊢
▦ 🇨🇳 China – Internal Stimulus & Soft Deflation:
∴ Industrial Production slows to +5.8% YoY – weakest in 6 months;
∴ Retail sales climb to +6.4% YoY due to stimulus programs ("618 event", consumption vouchers);
∴ PPI remains deflationary (-3.3% YoY), compressing industrial margins;
∴ Fiscal revenue down -0.3% YTD – signals internal fragility despite easing efforts.
✴️ Conclusion: China is applying targeted stimulus, but lacks decisive global impact – neutral crypto flow effect.
⊢
▦ 🇪🇺 European Union – Disinflation & Rate Reversal:
∴ HICP inflation falls to 1.9% – below ECB’s 2.0% target;
∴ ECB cuts deposit rate by 25bps – now 2.00%;
∴ PMI Composite remains below 50 – economic contraction underway;
∴ ECB forward guidance signals data-dependence and hesitation for further cuts.
✴️ Conclusion: Europe is easing rates amidst stagnation – weak driver for global risk flows.
⊢
🜎 Strategic Insight – Interflux Macro Oracle:
∴ U.S. tight policy + Iran tension = dual pressure point on risk assets;
∴ China’s mild stimulus is not yet globally inflationary – no volatility trigger;
∴ EU drifts silently – supportive, but irrelevant to Bitcoin in current configuration;
∴ Global system is stable in appearance, but tactically charged beneath – setup aligns with Bitcoin volatility potential.
⊢
IV. ♝ Market Sentiment - Media & Institutional Lens:
▦ The Block – Corporate Stockpiling Thesis:
∴ Ongoing accumulation of Bitcoin by public and private entities continues across Q2;
∴ Institutional wallets showing strategic DCA behavior – interpreted as positioning for either macro easing or geopolitical hedge;
∴ Unlike past cycles, no major corporate selloffs have been detected.
✴️ Conclusion: Institutional base remains in passive accumulation – potential catalyst insulation.
⊢
▦ CoinDesk – Sentiment Report – BTC at $92K Risk Threshold:
∴ Despite price climbing above $106K, analysts caution of technical rejection scenarios;
∴ Zones near $92K identified as high-liquidity, high-reaction clusters;
∴ Chart analysis frames current movement as vulnerable if macro catalysts turn hawkish.
✴️ Conclusion: Sentiment remains cautiously bullish but alert to correction windows.
⊢
▦ InfoMoney – U.S. Military Risk – Iran Strike Potential:
∴ Reported internal briefing of U.S. military planning toward Iranian targets;
∴ Trump’s media team leveraging geopolitical strength posture to influence sentiment;
∴ Markets (Dow Futures) showing pre-market decline on the headline.
✴️ Conclusion: Bitcoin holds narrative premium under geopolitical fear – but risk surge remains volatile.
⊢
🜎 Strategic Insight – Media Oracle:
∴ The crypto narrative is suspended between structural trust (institutional accumulation) and external fear (macro-political instability);
∴ Bitcoin presently benefits from asymmetric narrative positioning — but lacks transactional confirmation;
∴ Media flows suggest that sentiment will pivot swiftly if Powell’s tone confirms further hawkish stance or if Iran tension escalates.
⊢
⊢
⚜️ Magister Arcanvm (𝟙⟠) – Vox Primordialis!
⚖️ Wisdom begins in silence. Precision unfolds in strategy.
⊢
⌘ Codicillus Silentii – Strategic Note:
∴ The 1D reclaim of EMA21 inside the Ichimoku flat cloud reflects a market in suspended potential, where trend continuation and failure share equal weight;
∴ On-chain dynamics remain structurally undisturbed, yet veiled in a fragile layer of leveraged positioning;
∴ Exchange reserves continue their descent, detaching the market from traditional sell-side threat, but increasing reliance on thin liquidity zones;
∴ Macro vectors (Fed policy + Middle East tension) hover as dual shadows, capable of igniting volatility without prelude;
∴ Institutional accumulation remains active, but no longer decisive - the market awaits external ignition, not internal strength;
∴ Sentiment is asymmetrically bullish, yet explicitly unconfirmed in transactional volume and price aggression;
∴ The system is quiet - not because it is resolved, but because it is observing itself. This is a moment of ritual latency.
⊢
⌘ Market Status – Tactical Mode:
✴️ Strategic Position: “Structurally Bullish – Tactically Suspended”;
✴️ Primary Mode: “Observation Priority”;
✴️ Tactical Stance:
∴ No active positioning expansion without confirmation beyond Ichimoku flat zone;
∴ Watch for MACD confirmation and volume acceleration;
∴ Monitor geopolitical escalation and Powell’s tone – both capable of shifting structural balance.
✴️ Directional Bias: Neutral–Bullish, contingent upon validation;
✴️ Key Zone of Collapse Risk: $92,000;
✴️ Ascent Gate: $110,800 + (confirmation threshold).
⊢

BTC 4H AnalysisBTC overall trend is still bullish based on previous analysis . nowadays we see exact rejection of price from our resistance level. on higher time frame the trend is still bullish. important support levels are highlighted on the chart. The 93-94 zone is the most important one. this zone will determine the direction of BTC movement

XAUUSD 4H AnalysisGold is in its own correction wave.
The important resistance levels for gold is 3272-3353.
Based on ichimoku , we expect it to touch the support levels 3002-2977

XAUUSD Daily AnalysisGold long-term trend is still bullish. based on ICHIMOKU the Xauusd is in supposed correction. daily support level (3228) was touched. the price is near important support level (3188).
For next weeks:
Support levels:
3188
3166
Resistance levels:
3351
3381
After that waiting for Ichimoku to give us the exact road map.

BTCUSD longterm up trendThis analysis is based on the weekly chart.
The evolution of wave N is very beautiful.
First is the breaking of the all-time high.
Then comes the important levels such as 110K, 120K and 130K.

PENGUUSDTA risky analysis of a popular meme coin..
Based on this analysis, we are in wave 4 and it is expected to end soon and enter wave 5..
Around 0.091 to 0.085, if the price reaches it, it will be suitable for a short swing to the target of 0.0163 and 0.0175..
Ideal time zones are also marked with low tolerance..
This analysis can be easily filled..

PEPEUSDTBased on this analysis, wave E is complete and any retracement to around 0.0000078 is a buying opportunity.. and around 0.000017 to 0.000022 is the possible end zone of wave F..
Even if the price returns to the levels of 0.0000058 to 0.000005 once again, it will still be an ideal buying opportunity to buy spot.. And this is just a simple analysis and there is a possibility of error in it..

XAGUSD bullish momentum to uptrendPrice is above the cloud, Tenkan and Kijun sen showing a clear uptrend. Expected target is 35. The future cloud is expanding showing a continuing uptrend.

Bitcoin (BTC/USD) Weekly Analysis - W3 April | Master The MarketBitcoin continues to dominate the cryptocurrency market, and its price action provides valuable insights for traders. Here's a detailed breakdown of Bitcoin's performance in Week 3 of April:
Monthly Chart: Long-Term Uptrend
The monthly chart shows that Bitcoin remains in a long-term uptrend. However, last month saw some consolidation, with prices pulling back slightly. This indicates a healthy correction after a prolonged upward movement. Traders should focus on key support and resistance levels to identify potential breakout or reversal zones.
Weekly & Daily Charts: Consolidation Below the Cloud
On the weekly chart, Bitcoin’s price is currently trading below the Kumo cloud but above critical support levels. The daily chart highlights a defined trading range between $74,000 and $93,000 . A breakout above the cloud could signal renewed bullish momentum, while a retest of the $74,000 support level may indicate further consolidation.
Key Levels to Watch
Support: $74,000
Resistance: 93,000Tradersshouldmonitortheselevelsclosely.Asustainedmoveabove93,000 could open the door for higher targets, while a break below $74,000 might lead to deeper corrections.
Trading Strategy
Buy Opportunity: Wait for a pullback to the cloud support or a retest of $74,000 before entering long positions.
Risk Management: Place stop-loss orders below key support levels to protect against downside risks.
Bitcoin remains highly volatile, so patience and discipline are crucial. Keep an eye on macroeconomic factors like interest rate decisions and geopolitical events, as they can significantly impact BTC/USD price movements.

XAUUSD Bullish ProjectionsThe wave we've traced is defined as
A=1160
B=2075
C=1676
1) V Calculation = B + (B – C)
2) N Calculation = C + (B – A)
3) E Calculation = B + (B – A)
4) NT = C + (C - A)
so,
V = 2075 + (2075 - 1676) = 2474
N = 1676 + (2075 - 1160) = 2571
E = 2075 + (2075 - 1160) = 2990
NT = 1676 + (1676 - 1160) = 2192
A single candle has pushed us past both B and NT. We technically need a full candle body above B for confirmation, but the 5 lines all pointing straight upwards, and no apparent barriers in our way, I would consider the projected targets to be in play.
Consider this post in relation to my longer term projections shown in the related post
thanks for reading

XAUUSDThe long-term trend of gold is completely bullish according to previous analyses, which still shows a strong bullish trend on monthly time frames.
We expect a correction in the chart during next week , but The long term trend of Gold is still bullish and we couldn't see any ICHIMOKU based divergence.
important support and resistance levels on the chart is highlighted.

March 28 Is XRP's Big Day—Or At Least Better Be
Friday, March 28, 2025, marks exactly 144 days since XRP's breakout from November 4, 2024—right on cue with Gann’s "inner year" cycle, signaling a potential trend reversal (or at least a good excuse to tweet "I told you so").
Conveniently enough, March 28 is also exactly 52 days post the "flash crash" on February 3rd (if we're even calling that hiccup a crash).
The stars (or rather, candlesticks) align for Ichimoku’s Chikou Span to finally clear both the candlestick bodies and the Cloud, creating a bullish setup that even perma-bears might glance at sideways.
If XRP pulls off a daily close at or above $2.61 on March 28, expect Gann and Ichimoku fanboys to show up with wallets wide open and confidence suspiciously high.

XAUUSD Daily AnalysisXauusd Analysis Based on Ichimoku
Gold maintains its bullish trend on higher time frames and has the potential to go to higher levels.
According to Ichimoku data, there is a possibility of a price correction on the chart this week.
The overt trend will remain bullish until the price goes below the $2,894 level.
Key Levels:
All important levels for probable trades have been identified. Monitor the price reaction to these levels.

ONYXUSDTBased on this wave count and other considerations, we are probably in wave 4 and the areas indicated on the chart are ideal ranges for the bottom of wave 4 and the hunt for wave 5.
Buying spot this currency around $0.011 to $0.0125 seems low-risk and reasonable.
March 5th to 10th is an ideal time zone for the end of wave 4.
Just an analysis that could easily be wrong.
