AUDCADThe previous bullish drive and price resistance against supply from the area supported by the cloud and moving average could provide the potential for renewed growth.
Ichimokukinkohyo


GBPNZD Ichimoku Kinko Hyo AnalysisWeekly:
Price in Kihon Suchi 33 based on Kyushu Ashi
Daily:
Tenkan-sen Kijun-sen almost cross
Price broke the Kijun-sen
Bearish Chiko 9
Kumo flat
=> Price can still range-down till 19 Sep 2023
H4:
Kumo flat, small
Kijun-sen flat
Tenkan-sen flat
Price below Tenkan-sen
Price is at Kihon suchi in H4
=> Sell when price broke the support (2.10937) and go to lower tf to find edge
=> If price broke the H4 Tenkan-sen, stay away (No buying and selling)


EURCADAccording to the above labeling, this currency pair is on the verge of falling in the form of hypothetical wave C or 3.
If the wave structure of wave B is recognized correctly, you can expect a fall.
This is just an analysis and idea of future price movement..

Bitcoin👀Hello guys
on the four and a half hour time frame with a short-term view; We can have a price correction up to the range of $26,665.
This upward trend line that is clear in the chart is related to higher time frames.
If the purple range ($29088) is completely consumed (which is highly likely), we will have a price correction in the lower time frames to the trend line range.
Approval of this process has been issued by Ichi Moku!
If the $32,578 range is completely consumed before the bearish trend begins, the situation will become very attractive.
What do you think?

GBPUSD Ichimoku Kinko Hyo AnalysisWeely:
Price between Tenkan-sen and Kijun-sen
Bearish Kyushu Asshi
Daily:
3 signs of turnover happened (Tenkan-sen cross Kijun-sen, Chiko-span cross candles, price broke the Kumo
Chiko 9 below candles
=> price can still below Tenkan-sen till 5 Sep 2023
H4:
Kumo down
Kijun-sen down
Price is in a range
Sell when price breakout of the range between 1.26426 and 1.25502
Not recommend to buy

IOTXUSDT 😀 Bullish reversal or double bottom We've got a green market overall as BTC is breaking highs but still we need to be wavy of bull traps!! Specially in alt coins so trade safe and go little by little by areas and taking profits as price goes up.
Here's my unbiased plan:
Bullish reversal scenerario
Confirmation would be when price breaks above 0.01950 then we can look for buy set ups
Target 0.20 to 0.22 area
Bearish correction
Confirmation would be a double top with price unable to break through and bouncing down from 0.0184
Target: 0.016 to 0.015
Let's see how this plays out and be patient for confirmations before pulling the trigger!
Happy trading,
Kina 😀

Unlocking Nasdaq 100 Insights: Michael Burry's Vision & IchimokuAnalyzing the monthly Ichimoku chart of the Nasdaq 100 index reveals potential insights that align with Michael Burry's expectations. Upon closer examination, the lagging indicator is situated within the price movement itself, hinting at possible future price action. A careful observation indicates the likelihood of a pullback until the kijun-san level, considering that the tenkan-san is positioned below the kijun-san. Moreover, the price's current positioning above the kijun-san is notable.
The cloud formation, characterized by its flat nature, holds significance. It suggests that the price might eventually breach the cloud, marking a pivotal point. This breach could trigger a series of events, potentially leading to panic selling. This chain of events might culminate in a retreat to a previously established strong support level, near the 5000 mark.
Taking a broader perspective, it seems plausible that Mr. Burry envisions the Nasdaq 100 index descending towards this level. This anticipation could be fueled by the absence of significant price corrections since the initiation of the bullish rally post-March 2009. Notably, the current price trend exhibits characteristics of potential change; despite the price resting above the cloud, both the cloud and the individual tenkan-san and kijun-san lines remain flat. Additionally, a red candle formation following a sequence of five consecutive green candles on the monthly chart suggests a shift in momentum.
In essence, considering these Ichimoku signals, there seems to be alignment with the notion that the Nasdaq 100 index might undergo a substantial correction, possibly drawing it closer to the support level at around 5000. This analysis underscores the complexity of the current market dynamics and the potential for shifts in sentiment and price direction.

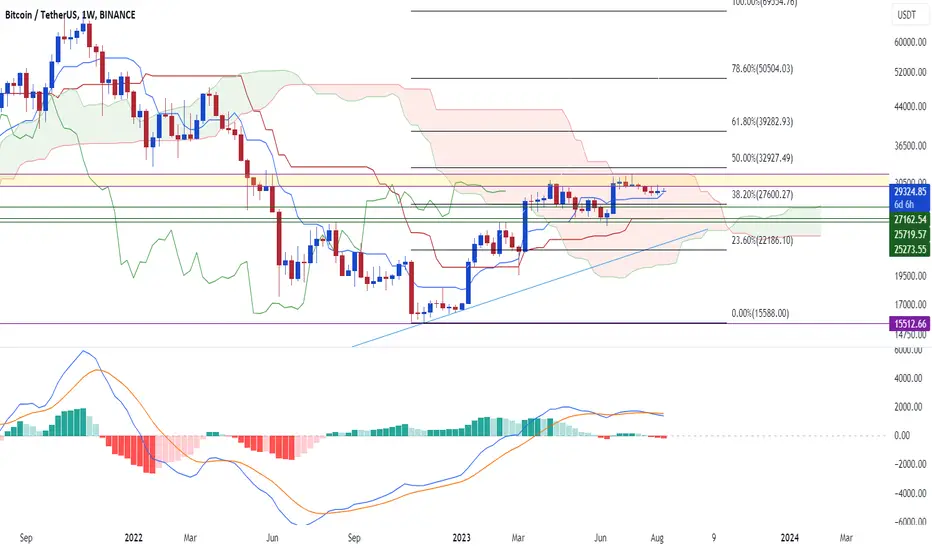
Indecision and Potential Reversal on Weekly Bitcoin ChartA weekly close above 30.6k could mark a turnaround, supported by rising Tenkan San and upward Senkou Span A. The lagging coming near to price and flat Kijun hint at consolidation. Continuous MACD crossings and red bars suggest ongoing bearish momentum. If we close above kumo cloud, it might set the stage for a trend reversal. This situation balances between consolidation and potential reversal, with a key role for the closing above kumo in determining future market direction.
Navigating Mixed Market Signals: Comprehensive AnalysisIchimoku Cloud: Signals a mix of trends, including a bearish Kumo crossover and bullish upward-pointing Senkou Span B.
Tenkan Sen & Kijun Sen: Both flat, indicating consolidation and indecision in the market.
MACD: Shows bullish momentum with a crossover above the signal line and green histogram bars.
RSI: Remains around 50, reflecting a neutral stance.
Given this complexity, a comprehensive approach is advised.

USDCAD BUY SWING So we broke the trendline on 1hr/4hr and also the strong resistance…. Which is for me a signal to enter a buy. the tp is wayyy up. But Ill jump in and out of thos swing on prolly daily basis cuz of the dd rules on my challange.
Also ichi moku on 1hr,4hr, daily comfirms it

1Inch From Heaven - Breakout or BreakdownPrice action is squeezing and has established a clear zone of support. One of my favorite trade sets up.
I have included areas that can be used to plan your trade, if you are interested.
As always, trade safe! ✌️

GBPUSD : Scenarios and LevelsLevels calculate by help of Ichimoku, Standard Pivot, Order_block, Sentiment Analyses and also S&R.
Sufficient accumulation of reasons indicates the possible existence of a reaction zone.
Generally sentiment is Neutral! but new sellers joined recently! 1.2860 is where most bulls entered the market and they may exit in no profit and no loss in their entry point. it is also a weekly pivot point and and order-block you may wonder if you hear it's an ichi level too! Strong enough!
1.26651 is an ichi level!
there is an ascending channel in the chart so take a little smaller risk for short positions.
1.2600 is around weekly pivot level and 1.2600 is a mitigated OB+.
our TP will be around 1.2650


XAUUSD Daily Levels with ICHIMOKU Using the Ichimoku indicator I identified the daily trading levels. If gold is expected to undergo a decline, its first significant support level will be at $1980. If market bears push gold lower, the following critical level will be $1960. If gold experiences an increase, its first significant resistance level will be at $2050, an important price point. This belief that the Federal Reserve is in the process of ending its tightening cycle has led to a decline in the yield of ten-year bonds, followed by a depreciation of the dollar and a strengthening of gold. Aside from that, increased concerns about the occurrence of another recession have led investors to pay more attention to gold, which is considered a safe-haven asset.

XRP The Fall of the RiseHello fellow traders!
In this analysis we will talk about the XRP
In short! very bad picture!!
still,
1. Cardano Founder Is Done with XRP (u.today)
2. XRP Supporter John Deaton Jumps into SEC v. LBRY Case
3. Ripple, SEC make final bids for a quick win in XRP lawsuit
4.
5..
..
...
and many more to be written!
while price falls Whales add more XRP amid rumors of lawsuit ending
interesting piece..
let's consider this scenario:
coin image is for sale
the price falls more
whales buy a big chunk then the value will rise
the whales sell at a profit and the price falls again and we are in the red... (the good scenario)
then let's wait a little longer and then buy
If you liked this idea or if you have your own opinion about it, write in the comments.
Thanks for reading!

EURUSD Div Invalidated, Alternate tagged perfectlyOn July 2nd I put out a video, discussing being "Stuck in the middle", and mentioning the Bearish Monthly Ichi structure. I admittedly was thinking EURUSD would be Bearish for the week, but I did mention where I'd be invalidated; A break above the descending Daily Forecast Line.
We did just that, broke the Daily Forecast, and proceeded to move to 1.112 and more, which was my anticipated alternate target.
In this video, I show out next anticipated levels above, using Ichi Forecast Lines, as well as Ichi Wave Theory.. and the invalidation areas to the downside, should the market choose lower, versus higher.
As always, good luck, have fun, and practice solid risk mgmt.
P.S. -- When mentioning the Divergence, I say "Lows", when I meant "Highs"... so forgive me for that confusion.

💡 Don't miss the great Buy opportunity in GBPUSDHello every one
We are in an extremely supportive area that seems to be difficult to break and I think that we should still wait for the currency to rise against the dollar. what do you think?
A blue box has been drawn, which is the gathering place of 5 support lines (dots), which I have drawn is a very low risk area for buying.
Please support me with likes and comments.

Educational : Exploring the Ichimoku Cloud IndicatorIn this article, I have made a sincere effort to explain each and every concept of the Ichimoku Cloud indicator in a clear and concise manner. My aim was to keep the explanations as simple as possible, ensuring that traders of all levels can easily understand and apply this powerful tool in their trading strategies.
I understand that technical analysis can sometimes be overwhelming with complex indicators and calculations. Therefore, I have taken great care to break down the components of the Ichimoku Cloud and explain their meanings in plain language. By doing so, I hope to make the indicator more accessible to traders who may be new to the concept or seeking a simplified explanation.
Introduction:
In the world of forex trading, there are numerous technical analysis tools available to help traders make informed decisions. One such tool is the Ichimoku Cloud, also known as Ichimoku Kinko Hyo. While it may seem complex at first, this indicator offers valuable insights into market trends, support and resistance levels, and potential trading opportunities. In this article, we will dive into the details of the Ichimoku Cloud, explaining its components, calculation methodology, trading strategies, combining it with other indicators, and ultimately demystifying its potential benefits.
What is the Ichimoku Cloud?
The Ichimoku Cloud is a comprehensive technical analysis tool developed by Japanese journalist Goichi Hosoda in the late 1960s. Its name, Ichimoku Kinko Hyo, translates to "one-glance equilibrium chart," reflecting its purpose of providing a holistic view of the market in a single indicator. Unlike many other indicators, the Ichimoku Cloud is known for its simplicity and ability to convey complex market information at a glance.
Understanding the Ichimoku Cloud Indicator:
The Ichimoku Cloud indicator consists of several components that work together to generate valuable trading insights. Let's explore each component:
Tenkan-sen (Conversion Line): This line represents the midpoint of the highest high and lowest low over a specified period. It serves as a dynamic support or resistance level, indicating short-term market sentiment.
Kijun-sen (Base Line): Similar to the Tenkan-sen, the Kijun-sen also represents a midpoint. However, it considers a more extended period and provides a broader perspective on the market sentiment.
Senkou Span A (Leading Span A): This line is formed by averaging the Tenkan-sen and Kijun-sen values and then plotted forward by the number of periods used for the Tenkan-sen. It provides an insight into potential future support or resistance levels.
Senkou Span B (Leading Span B): This line is calculated by averaging the highest high and lowest low over a more extended period and plotted forward. The area between Senkou Span A and Senkou Span B forms the Ichimoku Cloud (Kumo). The color of the cloud varies based on the relationship between Senkou Span A and Senkou Span B and indicates the prevailing market trend.
Chikou Span (Lagging Span): The Chikou Span represents the current closing price, plotted backward by the number of periods used for the Tenkan-sen. It helps traders identify potential support or resistance levels based on historical price action.
How is the Ichimoku Cloud Calculated?
Calculating the Ichimoku Cloud requires specific formulas based on historical price data. Here is a simplified summary of the calculations:
Tenkan-sen: It is calculated by summing the highest high and lowest low over a specified period (typically 9 periods) and then dividing the sum by two.
Kijun-sen: Similarly, the Kijun-sen is calculated by summing the highest high and lowest low over a different period (typically 26 periods) and dividing the sum by two.
Senkou Span A: This line is formed by averaging the values of the Tenkan-sen and Kijun-sen and then plotting it forward by the number of periods used for the Tenkan-sen.
Senkou Span B: It is calculated by summing the highest high and lowest low over an extended period (typically 52 periods) and then dividing the sum by two. Like Senkou Span A, it is plotted forward.
Chikou Span: The Chikou Span represents the current closing price, plotted backward by the number of periods used for the Tenkan-sen.
Applying the Ichimoku Cloud Trading Strategy:
The Ichimoku Cloud can be used to develop various trading strategies. One popular approach is trend following. Here's a simple example:
Bullish Trend: If the price is above the cloud, and the cloud is green (Senkou Span A is above Senkou Span B), it suggests a bullish trend. Traders may look for long positions when the Tenkan-sen crosses above the Kijun-sen within the cloud.
Bearish Trend: Conversely, if the price is below the cloud, and the cloud is red (Senkou Span A is below Senkou Span B), it indicates a bearish trend. Traders may consider short positions when the Tenkan-sen crosses below the Kijun-sen within the cloud.
It's crucial to note that additional analysis and risk management techniques should accompany any trading strategy. Backtesting and practicing the strategy in a demo environment are recommended before using it in live trading.
Combining the Ichimoku Cloud with Other Indicators:
While the Ichimoku Cloud can be used as a standalone tool, combining it with other indicators can enhance trading decisions. Here are a couple of examples:
Moving Averages: Traders often combine the Ichimoku Cloud with other moving averages to confirm trends and potential crossover signals. For instance, the 200-day Simple Moving Average (SMA) can be used as a long-term trend filter.
Oscillators: Oscillators, such as the Relative Strength Index (RSI) or the Stochastic Oscillator, can complement the Ichimoku Cloud by identifying overbought or oversold conditions. Divergences between the oscillator and price may signal potential reversals or trend continuation opportunities.
Conclusion:
The Ichimoku Cloud is a powerful technical analysis tool that offers a holistic view of the forex market. By integrating multiple components into a single indicator, it helps traders identify trends, support and resistance levels, and potential trading opportunities. While it requires practice and understanding, the Ichimoku Cloud can provide valuable insights to both novice and experienced traders.
However, it's important to note that no indicator guarantees accurate predictions, and trading always carries risks. Traders should exercise caution, conduct thorough research, and combine the Ichimoku Cloud with other analysis techniques, risk management strategies, and prudent decision-making.
In conclusion, the Ichimoku Cloud stands as a unique and comprehensive tool in the forex market, empowering traders with a deep understanding of market trends and potential trading setups. With its ability to simplify complex market information into a single indicator, the Ichimoku Cloud has gained popularity among traders worldwide.

Stocks I'm Hunting Longs on This WeekIn this video, I go over a list of stocks I'll be looking for strength in, to hop into longs on. I go over levels I'll be watching, and what would negate said interest.
I run scans each week, to look for ideal candidates for the following week (Longs). My scan this week provided me over 300 Stocks, and these are the ones I believe show the most promise.
As always, good luck, have fun, and practice solid risk management.

NCT - Batter Up 🏏NCT is similar to the STORJ play in technical structure.
The price range has been tight and the last few candles are making higher lows, but a lack of volume or sell off in Bitcoin could invalidate this play.

EURUSD, stuck in the middle In this video I go over EURUSD from the Monthly, down to the 4hr.
Monthly is Bearish
Weekly is Bullish but with my favorite Bearish Div Setup.
Daily has seen a HH-LL-LH-LL ABCD type formation, all this after my fav setup (Div w/Kijun break) on the weekly... So cautiously Bearish.
4hr shows some downside targets using Ichi Wave Theory, should this divergence play out.
As always, good luck, have fun, practice solid risk managment.
PS... Last 4hr target is 1.067... not the 1.076 my lysdexic ass stated :wink:
