USDJPYGood Morning Traders. USDJPY is still in a bullish momentum. It broke out the 115.678 Higher High that i marked up. I want to see a pullback around that area again (OB= Order block, Golden Zone) and continue a bullish trend. I can possibly see it eventually passing through the Weekly higher high which is 116.352 but for now will just be looking for "Safe TPS". Have a bless trading week!
Ictstudent

SHORT BAIS ON CADJPYI'M looking to short CADJPY once the equal highs gets taken out, and i'm looking to take my profit at the previous low. its a swing trade

SP500 Emini IdeaHTF bias for me is bearish on indices at the moment, but regardless, this is what I would assume to happen today. Let's see.

GBPUSD Look for SHORTS!GBPUSD Rallied up to an -OB. Shifted, now looking for price to target the BIG GAP or "eye" emoji areas. Ill try to keep updates on the trade and potential re-entry.

$MTS - To Fill 4 Hr Fair Value Gap on Order Block For Up Bounce*SMT = Smart Money Theory = everything you think that is not retail related to trading. First, SMT does not believe that triangles, wedges , trendlines , channels, harmonics, etc. has any effect on how price reacts. The second is to recognize that the price is not random, it is set by an algorithm controlled by those that control the asset. The Third thing to remember is price will move toward Liquidity and Balance. That's the basics. The rest is very unique in the vocabulary you need to have and the concepts that wrap around these ideas.
It's slowly working it's way down into the smart money "Buy Zone" or discounted area. With Kucoins 60% staking of the coin, I'm surprised it's going this low. But I have three short targets along the way up.

$BTC Broke Structure-Weekly Bearish Order Block Rejection *SMT**SMT = Smart Money Theory = everything you think that is not retail related to trading. First, SMT does not believe that triangles, wedges , trendlines , channels, harmonics, etc. has any effect on how price reacts. The second is to recognize that the price is not random, it is set by an algorithm controlled by those that control the asset. The Third thing to remember is price will move toward Liquidity and Balance. That's the basics. The rest is very unique in the vocabulary you need to have and the concepts that wrap around these ideas.
Bitcoin has made a mad dash this week crawling on top of a Daily Fair Value Gap. But if you look at the weekly chart, it has just touched the Weekly Bearish Order Block which should reject it eventually. However, with the new u [rising this past week Bitcoin did break structure and I have marked that in the main chart. There is also a Breaker just below it. So this could take a few days to unravel but I think It will start to fall getting a lot of retail traders to chase it as a Short. When price stops just at the Bullish Breaker Area of 38767.57 on the coin base Chart.
Here is the weekly where you can see the smart money Bearish order block weekly rejection.
So Again, watch for that rejection and expect retail traders to bit short on it and the chart should turn around at the breaker area. That low point would probably happen by Tuesday/Wednesday this week as it starts to create a new weekly profile. Let me know what you think or if you think it will drop and not come back up?
Happy Trading! = Bodies X Wix
BINANCE:BTCUSDT
COINBASE:BTCUSD
BITSTAMP:BTCUSD
BITFINEX:BTCUSD
FTX:BTCUSD
GEMINI:BTCUSD
OANDA:BTCUSD
TRADESTATION:BTCUSD
KUCOIN:BTCUSDT
PHEMEX:BTCUSDT
OKEX:BTCUSDT
COINBASE:BTCUSDT
POLONIEX:BTCUSDT
FTX:BTCUSD


$GBPUSD -Broke Market Structure- Bullish for 1.36375 from 1.3579As you can see GBPUSD had some highs near 1.3587. Those highs were broken durng the morning volatility. It has retraced a little each and who knows I may have missed the entranced when uit already got below 1.35795 and hit near 1.35583. That was the gold move to buy. Yes it's slowly retracting but that's to make retail traders believe that it's actuall going to sell now. a) It's broken market structure B) There's Confluence at the 161.8% mark that includes going through th top of a Fair Valu Gap (15 min) brefore hitting a bearish order block. I'm just wanting for GBPUSD TO enter that Zone between 1.3795 probably mnost likely to the buliish order block of 1.35815 before adding another position, I had 3 decent scalps on GBPUSD this morning and I'm looking to capitalize one more time. Now, I do look at the economic calendar to give m clues as to when the volatility will happpen in the morning. However, Just because a bank is expected to raise interest rates diesn't necessarily mean that it wil be a bad thi9ng for the comapny. If infact, most smart Money (Deep pocket whales) Will use tat against in you, and drive it in your favor for a few minutes and and """#$% SLAM #$% Irt goes the opposite way. I have been hurt tooo many times going by what the eceonomic calendar says will be good for the currency rather than just look at the surroundings, find the liqquidity and Underastand it's probably going there.
And with that we have somewhat equal highs above with fair value gaps just prior. I have a feeling we should se somerthig similar to that I drw. I could be completely wrong, but we'lll see. Goofg Luck and Good Trading
Tedzily a.k.a. Bodies X Wix
OANDA:GBPUSD
FX:GBPUSD
FOREXCOM:GBPUSD
FX_IDC:GBPUSD
CAPITALCOM:GBPUSD
SAXO:GBPUSD
gbpusd
PEPPERSTONE:GBPUSD
CURRENCYCOM:GBPUSD BIST:GBPUSD2!
EASYMARKETS:GBPUSD
CURRENCYCOM:GBPUSD
FXOPEN:GBPUSD
WHSELFINVEST:GBPUSD
KRAKEN:GBPUSD
BLACKBULL:GBPUSD
SKILLING:GBPUSD
FTX:GBPUSD
BIST:GBPUSD1!
BITSTAMP:GBPUSD


Gold NY forecastExpecting gold to go up now after London forming the potential low of the day. I'd target 1830 for now

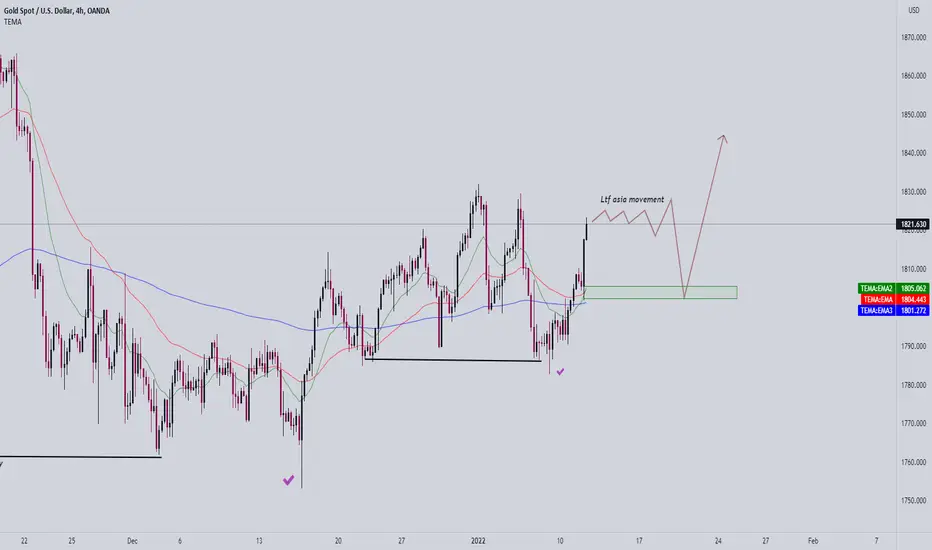
Gold outlookGold has recently cleared sellside liquidity and a bullish outlook is forming. I can see it forming higher highs soon. Entries will be taken at around the levels marked. Can see the price staying above the 800 EMA.

Gold outlookGold has recently cleared sellside liquidity and a bullish outlook is forming. I can see it forming higher highs soon. Entries will be taken at around the levels marked. Can see the price staying above the 800 EMA.
BTCUSD✓From monthly timeframe BTC is falling and is expected to go below 38000 befort regain it's momentum up.
✓Break of Market structure observed at 406500, which indicates the probability for price to drope is so high.
✓ price also show strong resistance zone at 42290.
✓ This zone can also be considered as liquidity zone, therefore an interesting area above it can be valid entry setup for sell.
✓The high probable selling zone is between 42500 and 42750.
✓ At this zone one can find any berish confirmation and enter or can enter direct and put stop loss above the zone.


$MATIC - To Send Under Sell Side Liquidity Before Bullish Return*SMT = Smart Money Theory = everything you think that is not retail related to trading. First, SMT does not believe that triangles, wedges , trendlines , channels, harmonics, etc. has any effect on how price reacts. The second is to recognize that the price is not random, it is set by an algorithm controlled by those that control the asset. The Third thing to remember is price will move toward Liquidity and Balance. That's the basics. The rest is very unique in the vocabulary you need to have and the concepts that wrap around these ideas.
There was too much thought that went into this chart to even try to explain. But I think I make the entry points clear, that if it does get to those entry points, to add a position to the trade. When getting to the take profits, take a % off as a profit from the trade. But this chart should be foolproof unless something catastrophic happens.
TP3: 2.62499282
TP2: 2.51605485
TP1: 2.44690000
E1: 2.27610000
E2: 2.25454172
E3: 2.16770000
E4: 2.11720000
SL: 1.97495881
Good Luck and Happy Trading.

$GBPUSD - Price at Bullish Breaker - Continue Bullish Momentum?*SMT = Smart Money Theory = everything you think that is not retail related to trading. First, SMT does not believe that triangles, wedges, trendlines, channels, harmonics, etc. has any effect on how price reacts. The second is to recognize that the price is not random, it is set by an algorithm controlled by those that control the asset. The Third thing to remember is price will move toward Liquidity and Balance. That's the basics. The rest is very unique in the vocabulary you need to have and the concepts that wrap around these ideas.
Currently on the daily chart the price has risen above a breaker. The Breaker would be the Low High Lower Low Formation seen here:
And it has come down and touched that breaker region. The breaker would be the last up candle in the low high lower low formation. Which is in the main boxes on the main idea above. I once price touches the breaker it ususually means that there was a missed opportunity for "Smart Money" to remove a short position at that area so they bring the price back down to remove the short positions and give you a "Fake out as if they are going lower.
My stop loss was to take take the highest 4 hour ATR (408) or 40.8 pips and place that below the body of the breaker. I added a few pips just in cases it tried a quick stab stop hunt. As it approaches the 1.35500, 1.36000, or even the 1.36500 mark price has a t endency to sweep those areas 10-40 pips before pulling back. Being that the next daily bearish order block ius neath e 1.36000 I would expect it to sweep at least half of the bearish order block which is approximately 40+ pips on this chart.
Open: 1.34975
SL: 1.34545
Max TP: 1.36470
More than a 3:1 ratio with almost 150 pips to gain if my analysis is correct. This is a swing trade and we're hoping to find the bottom of that swing right now.
FX:GBPUSD
OANDA:GBPUSD
FOREXCOM:GBPUSD
GLOBALPRIME:GBPUSD
EASYMARKETS:GBPUSD
KRAKEN:GBPUSD
FX_IDC:GBPUSD
PEPPERSTONE:GBPUSD
FTX:GBPUSD
EIGHTCAP:GBPUSD
CURRENCYCOM:GBPUSD

Short idea on gold Gold has reached a price of fair value and showed signs of dropping.
When price retraces to 1801 I’ll be taking a short there

$AVAX - Buy Now or Maybe 115-117 *SMT**SMT = Smart Money Theory = everything you think that is not retail related to trading. First, SMT does not believe that triangles, wedges , trendlines , channels, harmonics, etc. has any effect on how price reacts. The second is to recognize that the price is not random, it is set by an algorithm controlled by those that control the asset. The Third thing to remember is price will move toward Liquidity and Balance. That's the basics. The rest is very unique in the vocabulary you need to have and the concepts that wrap around these ideas.
AVAX has short term break of structure that is bullish where these candles have closed above the previous candles close. We missed the initial great buy, the pullback into the 61.8% level of this chart. However. The current high is a about 1 cent off from another daily high, Creating a false " resistance. I say false because the next time it runs up to that point it will break resistance. It may break it by very little which will cause the liquidity to flood the market (this area of $127.3-$127.4 is where buy stops and sell limits rest) Smart money will punch through that area to flood the market with liquidity chasing the chart down for a short period, and then reverse it back up hitting following stop losses or shortly placed stop losses. Taking the retail traders out. Happens every time. The real question is, where to buy?
There are close equal lows on a 15/5 min time frame that could produce a little bit of liquidity underneath. about where it is now near the 119.5 area. The chart could push below that and spark more liquidity but I have a feeling if it did that it would drop down to the consequential encroachment of $118.226 or fill the fair value gap down to $117.16. The furthest I think it could go down would be $115 where there is a Bullish order block resting. and at that point price would reject it and send flying back up.
Additionally the only indicator I use, The Williams %R, which is more of a volatility indicator, is at the over sold condition. That doesn't guarantee a biuy right away, but we're more likely to see it possibly be more oversold to the areas I suggested and then turnm around.
As I'm typing this, it got under the Bullish breaker creating a bearish breaker. So I'd be betting on $117-$115
Good Luck and Good Trading! :)
COINBASE:AVAXUSD
BINANCE:AVAXUSDT
HUOBI:AVAXUSDT
OKEX:AVAXUSDT
COINEX:AVAXUSDT
FTX:AVAXUSDT
POLONIEX:AVAXUSDT
BITFINEX:AVAXUSD
KRAKEN:AVAXUSD

$ETH -Buy now or wait to see if fills Fair Value Gap ($3,885) *SMT = Smart Money Theory = everything you think that is not retail related to trading. First, SMT does not believe that triangles, wedges , trendlines , channels, harmonics, etc. has any effect on how price reacts. The second is to recognize that the price is not random, it is set by an algorithm controlled by those that control the asset. The Third thing to remember is price will move toward Liquidity and Balance. That's the basics. The rest is very unique in the vocabulary you need to have and the concepts that wrap around these ideas.
ETH has fallen into the discount array (61.8%) of the pullback. However there is a fair value gap in this area and I'm curious to see if it wants to fill the gap and pull just below the Market Maker Buy/Sell Model consolidation area that previously took place in the red box. If that's the case it should reach down into the second fair value gap where theres a bullish order block around 3850-53 ish. I would have my entry at the beginning of the second fair value gap at 3873. just in case it entered and bounced out immediately. But it did reach into the discount array and immediately started and up track. However that doesn't mean a bearish order block can't knock it back down. I did enter with one position where it is currently shown watching to see if it will enter the second at 3873.
Let me know your thoughts if you're practicing Smart Money Theory.
Good Luck and Good Trading :)
BINANCE:ETHUSD
KUCOIN:ETHUSDT
BINANCE:ETHUSDT
KRAKEN:ETHUSDT
FTX:ETHUSDT
OKCOIN:ETHUSDT
OKEX:ETHUSDT
POLONIEX:ETHUSDT
HUOBI:ETHUSDT
PHEMEX:ETHUSDT
KRAKEN:ETHUSD
BITSTAMP:ETHUSD
BYBIT:ETHUSD
BITFINEX:ETHUSD
FTX:ETHUSD
GEMINI:ETHUSD
BITTREX:ETHUSD
PHEMEX:ETHUSD

Bullish EJThere is shift in market structure, sms
Followed by break of market structure BMS.
This is the indication that EURJPY in 4H has shifted from bearing to bullish.
The price is now near our sniping point, and the big probability is to go high.


GBPUSD SMART MONEY 1:10 RRR GBPUSD recently broke the structure and we have a nice opportunity for longs in the m15 order block area, if you want a better win rate can wait for a confirmation candle ( m15 bullish close ), but I will set a pending to maintain 10 rr

$BTC - Pullback to Discount Level, Then Bullish *Smart Money**SMT = Smart Money Theory = everything you think that is not retail related to trading. First, SMT does not believe that triangles, wedges , trendlines , channels, harmonics, etc. has any effect on how price reacts. The second is to recognize that the price is not random, it is set by an algorithm controlled by those that control the asset. The Third thing to remember is price will move toward Liquidity and Balance. That's the basics. The rest is very unique in the vocabulary you need to have and the concepts that wrap around these ideas.
Bitcoin is pulling up to possibly reach above the current small liquidity high resting near $50,850. I can see it pushing up a little harder to take out people thinking this is a "Resistance" level but then going to the median bearish order block of $51,3385 before getting pushed back down into the 1-hour fair value gap which is an imbalance that needs to be filled. Or it could simply touch the bottom of the 1 hour fari value gao from the "great fall" last week, and turn bearish and into the newly created 1 hour fair value gap, which is an imbalance it would most likely pursue and fill. At the bottom of this imbalance is the 61.8% (Discount level) of the fib if you place it at the recent current low to the current recent high. This area is also near the 4-hour Fair Value Gap bottom. So all of these confluences make sense as to where it would go before moving bullish. So I have the entry price as $49,160.
Now the target is above the current high and it's the next tiny 1-hour order block at around $52,645.So to be safe I put my target at $52,640.
See Chart
I'm giving it until the end of the week to make this happen so we have a nice green weekly candle.
If there are any Smart Money / ICT students out there that have any critiques or suggestions, please let me know what you think. Agina, this is not the retail way of thinking, if you tell me a Trend line and a triangle is going to somehow magically make the price do something, I would point you toward what the chart usually does and that is attack liquidity and balance. And I believe this idea has both.
Cheers and happy trading.
P.S. I'm still holding my trade from "The great fall" from last week. I knew it would come up but I'm just hoping it comes up quicker because my time decay is killing me on my futures call. COINBASE:BTCUSD BINANCE:BTCUSDT BITSTAMP:BTCUSD KUCOIN:BTCUSDT PHEMEX:BTCUSDT BYBIT:BTCUSDT OKEX:BTCUSDT FTX:BTCUSD
