GOLD (XAU/USD, 4H) updateOn the 4-hour chart, GOLD has broken below the lower boundary of a pennant pattern on increasing volume, signaling potential for continued downside. Despite this, the asset remains within the confines of a bullish megaphone structure, whose boundaries are still intact. The EMA indicators (20/50/100/200) are aligned in a bearish sequence, exerting downward pressure. The price is consolidating below the $3295 level and is approaching key demand zones.
Near-Term Downside Targets:
- $3177 — Intermediate demand zone
- $3063 — Major support level
Technical Highlights:
- Breakdown from bearish pennant confirmed by volume
- Price action continues within the bullish megaphone pattern
- EMA 20/50/100/200 positioned above price, indicating overhead resistance
- Volume increases observed during downward moves
- Key buyer interest zone: $3060–$3080
- Resistance zone: $3295–$3305
Following the breakdown from the consolidation pattern, gold is exhibiting a downward trajectory targeting support zones at $3177 and $3063. The bearish scenario is technically confirmed as long as the price remains below $3295. However, the movement within the bullish megaphone structure warrants close monitoring for potential shifts in momentum.
IDEA

Time to Buy BITCOIN?I hope you guys enjoyed the video; feel free to comment down below any questions you might have.

LYFT, 3D Daily Breakout Confirms Potential Mid-Term ReversalOn the 3-day chart of Lyft, price action is developing within a potential mid-term reversal structure. The key trigger was the breakout of the descending trendline on the daily timeframe, signaling a shift in momentum after an extended downtrend.
The asset bounced from the long-term ascending support zone around $9.66, and the structure now points to a possible expansion toward key Fibonacci retracement levels:
Upside targets based on Fibo levels:
– $14.36 (0.5)
– $15.47 (0.618)
– $17.05 (0.786)
– Extended: $24.88 (1.618)
Technical Highlights:
– Breakout confirmed on daily chart trendline
– 3D chart shows tightening triangle pattern
– Stochastic momentum turning bullish from oversold levels
– Volume profile supports accumulation, not distribution
– Resistance zone: $14.30–$17.00
– Holding above the breakout trendline keeps the bullish setup valid
Fundamental Context:
Lyft is restructuring operations, with narrowed losses, improved efficiency, and customer retention focus. The company is regaining share in the ride-hailing segment, and investors are beginning to price in operational stabilization. The improving sentiment is reflected in growing institutional interest and mid-term positioning.
This is a potential mid-term bullish scenario, activated by the daily breakout and confirmed if price holds above the trendline. A push above $15.50–$17.00 could unlock the full target at $24.88. As long as structure holds, this remains a strong trend reversal setup.

Gold (XAUUSD, 2H) Potential Triangle Structure Near CompletionOn the 2-hour timeframe, gold continues to consolidate inside a well-defined contracting triangle, marked by a series of lower highs and higher lows, suggesting reduced volatility before a directional move. The structure appears to follow a five-leg correction (waves 1–5), which may now be nearing completion.
The focus is now on how price reacts to the upper boundary of the triangle, but $3,310 is not a decisive level. Instead, the key signal will come from a breakout from the triangle itself with confirmed follow-through and volume.
Technical view:
– Structure: classic five-leg triangle forming inside the broader retracement
– Volume is increasing on approach to the upper boundary
– Fibonacci retracement levels in play above:
• $3,351 (0.618)
• $3,380 (0.5)
• $3,443 (0.236)
– Critical support remains along the lower triangle base and near the $3,258–$3,192 zone
– Breakdown below $3,192 would invalidate the bullish scenario
Scenario outlook:
This is a hypothetical pattern completion. If the triangle resolves upward, momentum could push price toward $3,350+, aligning with Fibonacci recovery targets.
Conclusion:
Gold is moving toward the decision point inside a contracting triangle. Watch for breakout confirmation from the structure itself — not individual levels. Until confirmed, this remains a potential scenario, not an active signal.

GOLD (XAUUSD, 1H) Double Bottom & Continuation to Lower FibsOn the 1-hour chart, gold attempted to form a double bottom structure, which initially showed bullish potential. However, the price action quickly reversed near resistance, failing to sustain above key EMAs and trendline zones. This invalidates the reversal attempt and reaffirms the current bearish structure within the descending channel.
The price is now trading back below broken support and heading towards deeper Fibonacci retracement levels, with visible supply pressure and repeated failure to hold any bullish breakout. Volume has shifted lower on rallies, confirming weak buyer commitment.
Downside targets (Fibonacci structure):
– $3251 – 0.382 retracement
– $3221 – 0.618 retracement (primary structural support)
– $3165 – 0.786 extension zone (final support before breakdown scenario)
The descending wedge remains valid. Unless the market reclaims $3305–$3334 with strong confirmation, the corrective leg toward the lower support zones is likely to continue. A clean break below $3220 would open the door for a move toward the $3160s.
The failed double bottom setup confirms bearish continuation. Structure, volume, and trendlines all align with a move lower. Watch for reactions at $3221 and $3165 as critical levels.

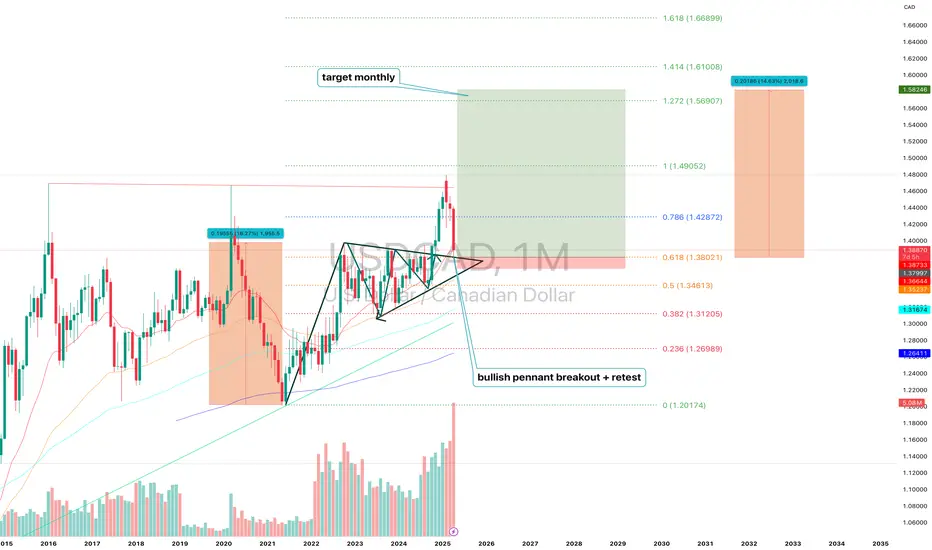
USDCAD (1M) Bullish Pennant Structure and H ProjectionUSDCAD (1M) — Technical and Fundamental Analysis: Bullish Pennant Structure and H Projection
On the monthly chart of USDCAD, a bullish pennant structure has been formed and confirmed with a breakout followed by a clean retest of the upper boundary. The price broke out of the consolidation zone with momentum and is currently holding above the key support at 1.3802. The structure remains active: the first target based on the projected move is 1.4905. If the impulse continues and the market structure remains intact, extended targets lie at 1.5690 (1.272), 1.6100 (1.414), and 1.6689 (1.618) Fibonacci expansions. Technically, the 1.3802 level (0.618 retracement) is the critical support. If this zone holds, the bullish scenario remains valid. The nearest resistance is 1.4287 (0.786), and a confirmed break above this level would likely trigger the next phase toward 1.49. Volume increased during the breakout, confirming strong buyer interest.
Fundamentally, the setup is supported by diverging monetary policies: the Bank of Canada has signaled a more dovish stance due to slowing inflation and economic softness, while the Federal Reserve remains more neutral and cautious about rate cuts. In addition, oil prices — a key factor for the Canadian dollar — are under pressure, weakening the CAD further. Broader macro uncertainty and the global demand for USD as a reserve and safe-haven asset continue to support the dollar, strengthening the USDCAD pair.
Conclusion: As long as the price holds above the 1.38 zone and confirms above 1.4287, the bullish structure remains in play with a target of 1.4905 and potential extensions to 1.5690–1.6100.
SILVER 1DA possible scenario for silver on the daily timeframe involves buying from the levels of 30.90-31.00 with further targets at 33.02, 34.8291 and the expected completion of the rounding pattern with a subsequent movement to the zone 40.0251
Everything is clearly depicted on the graph!
Have a good day!

FHE/USDT Analysis – High Probability of a Bullish Trend
This futures pair is showing strong signs of entering a full-fledged bullish trend.
We are currently attempting to break through the key level of $0.078.
Below that, a strong volume zone has formed at $0.0756–$0.072, which is now acting as support.
We're looking at a potential long position upon a retest and confirmation from that zone.
The upside potential is open-ended.

Amazon losing weekly trendline – watch these Fibo levels nextTechnical Analysis
Amazon (AMZN) has broken below its weekly ascending trendline and failed to reclaim the key 0.618 Fibonacci level (180.52). Strong bearish volume and a weakening RSI suggest downside continuation. Key support targets lie at 161.55, 151.21, and 142.58, with extended downside to 119.12.
Fundamentals
Macro pressure from high interest rates and a slowdown in consumer spending weighs on Amazon. Intense competition in AWS and e-commerce adds uncertainty. Upcoming earnings may serve as a catalyst for directional clarity.
Scenarios:
Base case – move down toward 151.21, 142.58, 119.12
Bullish case – break above 180.52 → rally toward 207.52, 241.92

USDCHF SELLS Price is overall bearish but it formed a minor support on H1. Ideally, I'd like to see price retrace to the broken support around 0.83600 area.

GOLD (XAUUSD) – 4H Technical AnalysisAfter a sharp drop and rebound, gold is now testing the 50% Fibonacci level around 3122. The key resistance zone lies between 3163–3167, where a breakout could open the path to 3218 (0.786 Fibo).
🔹 Resistance levels:
• 3163 – 0.618 retracement
• 3167 – previous swing high
• 3218 – 0.786 level & target
🔹 Main Scenario:
Breakout above 3163 leads toward 3218 continuation.
🔹 Alternative Scenario:
Rejection at 3163 → retrace to 3082 or 3033 before next move.
Momentum indicators are bullish but approaching overbought territory.

WLD — Heavy Discount. Long-Term Opportunity on the TableWLD has pulled back over 80% from its previous high — a massive correction that now opens the door for long-term accumulation. The current range looks like a gift for patient players. Don’t sleep on setups like this — they don’t come often.
Follow for more high-conviction plays like this one.
Entry: 0,7-0,71
TP: 1,37-3,35

LIMIT ORDER - $SERAPH/USDTLIMIT ORDER - $SERAPH/USDT
Direction: #Long 🟢
Entry Price: 0.19229
Stop Loss: 0.17019
Target 1: 0.20862
Target 2: 0.22494
Target 3: 0.24127
Target 4: 0.25759
Target 5: 0.27392

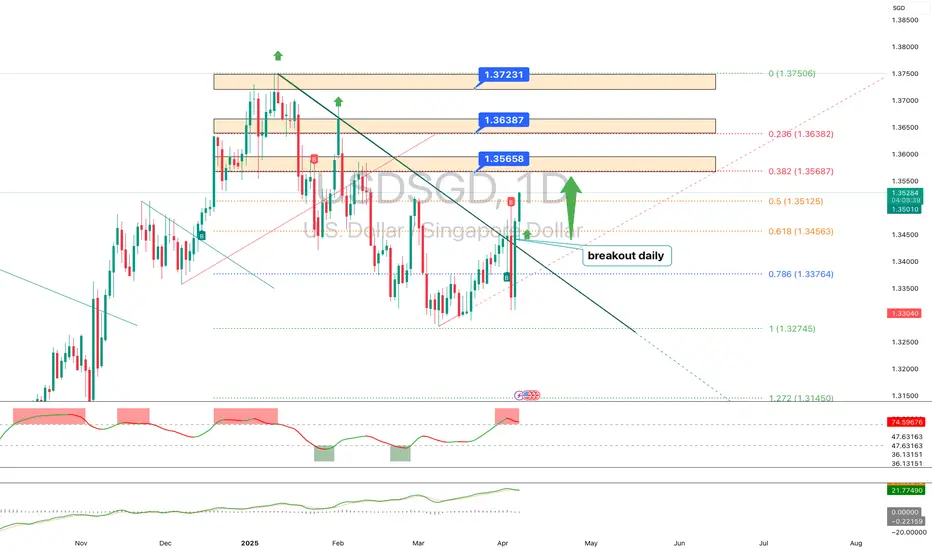
USDSGD – Technical Analysis (1D)USDSGD has broken out of a descending trendline on the daily timeframe – signaling a potential shift in short-term momentum. Price has held above 1.3510, confirming the breakout and opening the door to resistance zones at 1.3565–1.3638 (aligned with 0.382 and 0.236 Fibonacci levels).
If bulls stay in control, next targets lie at 1.3723 and 1.3750. However, a short pullback toward the 1.3450–1.3480 support zone (0.618 Fibo) is also possible.
🔹 Main scenario: continuation to 1.3565 → 1.3638 → 1.3723.
🔹 Alternative scenario: drop below 1.3450 toward 1.3376 or 1.3274.
BITCOINS BIG MOVE IS COMING! I hope you guys did enjoy this trade idea; feel free to comment down below if you have any questions or comments.

LIMIT ORDER - $COTI/USDTLIMIT ORDER - $COTI/USDT
Direction: #Short 🔴
Entry Price: 0.062870
Stop Loss: 0.068793
Target 1: 0.060344
Target 2: 0.057817
Target 3: 0.055291
Target 4: 0.052764
Target 5: 0.050238

Rocket Lab about to Fly! But which way?!Rocket Lab - NASDAQ:RKLB
Breakout = $26 🎯
Breakdown = $11.51 🎯
- Symmetrical Triangle
- Volume Shelf with Gaps above and below
- Bearish Wr% right now
- Price Gap below
Can go either way but I'm leaning bearish here.
Not financial advice

Mobileye Lands VW! 50% UpsideNASDAQ:MBLY - Wedge Breakout
Look for a retest of wedge for entry in the $16's.
Price Targets are $22 & $25 🎯
Mobileye inks deal with Volkswagen Group!
Not financial advice

USDJPY SELL ⚠️⚠️⚠️
Given the overall downtrend and price action patterns at the marked resistance level, we expect a decline in this pair towards the specified price level.💡
#usdjpy #forex #trading #priceaction #technicalanalysis #forexsignals #fxtrader #marketanalysis

Undervalued Stock TTD The Trade Desk buy IdeaDo not believe me when I say this stock is undervalued, do your own research.
Do not believe me when I say this stock has shown very high properbility for good upside moves from around end of March until mid of August for the last 10 years, do your own research.
Good upmove today, I am in.
Leave a like or comment, hit the bell, eat some birthday cake, and love what you are doing!
Cheers!

DYDX/USDT – Working within the horizontal channel. Continuation.dYdX - is DeFi’s pro trading platform and a pioneer in decentralized finance, known for being the first to offer decentralized margin trading and derivatives, as well as inventing flash loans and DEX aggregators in 2018. Built on a custom Layer-1 blockchain using the Cosmos SDK, dYdX provides a professional-grade, decentralized trading experience with high leverage, deep liquidity, and low fees. Governed by the community through the DYDX token, dYdX is focused on delivering a transparent and user-driven financial system.
CoinMarketCap : #107
I've been working within this channel for about 2.5 years.
From my previous trading idea, two marked zones were reached:
1.6447 (+80%)
2.5007 (+176%)
The maximum squeeze reached +185.5%.
I'm continuing to work within the channel.
Last time, liquidity was accumulated below the support of the inner channel.
Now, liquidity is being gathered below the support of the outer channel—as always.
I've marked potential final liquidity grabs on the chart, as well as resistance zones where the price is likely to react.
The profit is significant, and if you work with compound interest, well… I'll just keep quiet—not everyone understands this and keeps waiting for the final rally.
A reminder:
Right now, fear dominates across all coins. This is the phase where nobody wants to buy or where many have already run out of funds. Why? Because, as always, most people buy at the top.
Take all of this into account in your trading strategy.

STOCK MARKET ANALYSIS! BEAR MARKET IS HERE? I hope you guys enjoyed the video, If you have any questions or comments feel free to comment down below! Thanks for watching.

US Market Reversal Emerged? This Week's Closing is CrucialThe final trading day of February. I always take the opportunity to analyze the monthly chart closely.
We saw an inverted hammer. From the cash chart, clearly, we can see the inverted hammer. Beyond that, it also appears to be a potential double top for the Nasdaq.
E-mini Nasdaq Futures & Options
Ticker: NQ
Minimum fluctuation:
0.25 index points = $5.00
Micro E-mini Nasdaq Futures & Options
Ticker: MNQ
Minimum fluctuation:
0.25 index points = $0.50
Disclaimer:
• What presented here is not a recommendation, please consult your licensed broker.
• Our mission is to create lateral thinking skills for every investor and trader, knowing when to take a calculated risk with market uncertainty and a bolder risk when opportunity arises.
CME Real-time Market Data help identify trading set-ups in real-time and express my market views. If you have futures in your trading portfolio, you can check out on CME Group data plans available that suit your trading needs tradingview.com/cme/
Trading the Micro: cmegroup.com/markets/microsuite.html
