MFIN - VCP (16W 41/18)IDX:MFIN - VCP
(+):
1. Low risk entry point on pivot level
2. Volume dries up
3. Price above MA 50 > 150 > 200 over 10 weeks
4. Price is within 25% of 52 weeks high
6. Price is over 30% of 52 weeks low
7. 200 day MA trending up over 1 month
8. RS Rating is over 70 (95)
9. EPS Growth:
a. Quarterly QoQ: +22.24%
b Quarrerly YoY: +185.92%
b. TTM YoY: +22.24%
c. Annual YoY: +23.08%
(-)
1. Breakout with red candle
2. Lack of liquidity
IDX

TAPG - VCP (20/5 3T)IDX:TAPG VCP
(+):
1. Low risk entry point on pivot level
2. Volume dries up
3. Price above MA 50 > 150 > 200 over 10 weeks
4. Price is within 25% of 52 weeks high
6. Price is over 30% of 52 weeks low
7. 200 day MA trending up over 1 month
8. RS Rating is over 70 (84)
9. Biggest net income +197.70% on Q4 2024 vs Q4 2023
(-)
1. Breakout with huge volume but created long red candle

NICL - VCP (192W 82/24)IDX:NICL VCP
(+):
1. Low risk entry point on pivot level
2. Volume dries up
3. Price above MA 50 > 150 > 200 over 10 weeks
4. Price is within 25% of 52 weeks high
6. Price is over 30% of 52 weeks low
7. 200 day MA trending up over 1 month
8. RS Rating is over 70 (93)
9. EPS Growth:
a. Quarterly QoQ: +45.05%
b. TTM YoY: +872.03%
c. Annual YoY: +1,029.03%
(-)
1. Breakout with low volume

IHSG AFTER BREAKMarket globally is crashed because of the new tariff that US applied. IHSG might as well crashed after this break, approaching 58xx. But i believe after this correction IHSG Will back in action and reach 67xx.

“IDX Composite Index: Assessing the Depth of the Downtrend”The IDX Composite Index is expected to remain under pressure, forming wave of wave A. The nearest corrective target for the index is projected in the 5,879–5,975.
This outlook aligns with prevailing market sentiments, as Indonesia’s economic and political landscape has yet to support a trend reversal. Additionally, global sentiment remains negative, further weighing on the index.

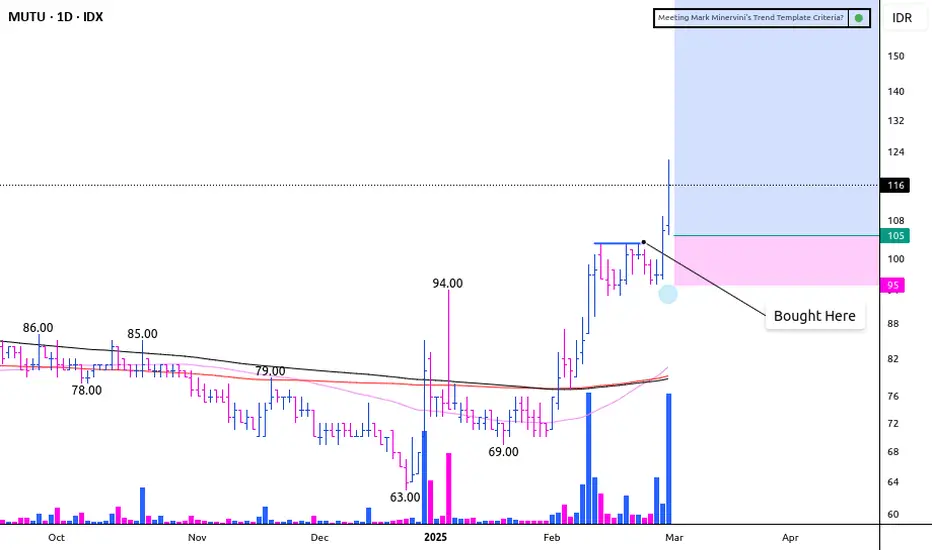
MUTU - 3 WEEKS TIGHTIDX:MUTU - 3 Weeks Tight
(+):
1. Low risk entry point when stock pause
2. Volume significantly drop on week 2, and huge volume on week 1
3. Price above MA 50 > 150 > 200 over 10 weeks
4. Price is within 25% of 52 weeks high
6. Price is over 30% of 52 weeks low
7. 200 day MA trending up over 1 month
8. RS Rating is over 70 (90)
9. High volume on breakout
(-)
1. In the text book, 2nd candle on 3 weeks tight is must corrected by 3% but this stock it was corrected by 9%
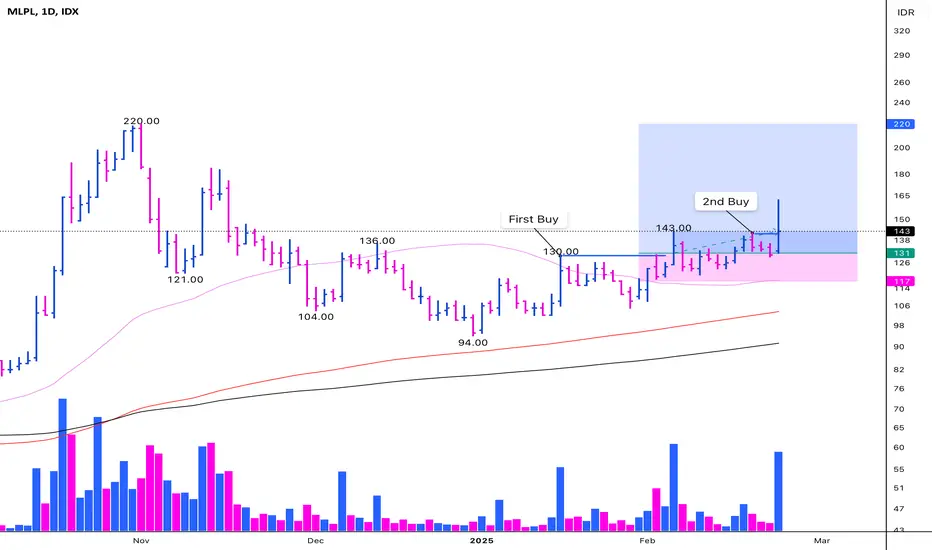
MLPL - LOW CHEATIDX:MLPL - Low Cheat
(+):
1. Very Low risk entry point on pivot level
2. Volume dries up
3. Price above MA 50 > 150 > 200 over 10 weeks
4. Price is over 30% of 52 weeks low
5. 200 day MA trending up over 1 month
6. RS Rating is over 70 (93)
7. VCP characteristic
10. Price breakout with huge volume
(-)
1. Price is below 25% of 52 weeks high
Try to Adding with some basic fundamental about EPS growth:
a. Quarterly QoQ: −91.66%
b. Quarterly YoY: −71.13%
c. TTM YoY: +12.23%
d. Annual YoY: −13.30%
About fundamental aspect, maybe is time to turn around
BBRI Potential Drop to 3090 Before a ReboundI'm forecasting that BBRI may decline further to the 3090-2930 demand zone, where an unfilled order block exists. There's a potential bounce in the 3750-3690 area, but if selling pressure continues, the price could reach the lower support before reversing. Watching for confirmation at these key levels before taking action.
What do you think? let discuss below? 😊

ELIT - LOW CHEATELIT - LOW CHEAT
(+):
1. Low risk entry point
2. Volume dries up
3. Price above MA 50 > 150 > 200 over 10 weeks
4. Price is within 25% of 52 weeks high
6. Price is over 30% of 52 weeks low
7. 200 day MA trending up over 1 month
8. RS Rating is over 70 (82)
9. Stock build VCP Characteristic
Try to Adding with some basic fundamental about EPS growth:
a. Quarterly QoQ: +31.29%
b. Quarterly YoY: 653.96%
c. Annual YoY: +75.48%
d. TTM YoY: +220.19%
(-):
1. Stock not confirm on stage 2 uptrend if not break the blue line
Note:
- Consider to add some position if break the blue line
- Market look bottoming, just wait this stock to breakout with high volume

Indeks Harga Saham Gabungan (IHSG) Indonesia Stock ExchangeLet me know ur thought! I think there's bearish pattern on this IHSG chart, feel free to discuss!!

ALDO - CUP WITH HANDLEIDX:ALDO (CUP WITH HANDLE)
28-10-2024
(+):
1. Low risk entry point, first time the stock showing it’s buying point
2. Volume dries up on handle
3. Stock showing it’s strength while market is corrected
4. Price above MA 50 > 150 > 200 over 10 weeks
5. Price is within 25% of 52 weeks high
6. Price is over 30% of 52 weeks low
7. 200 day MA trending up over 1 month
8. RS Rating is over 70 (82)
(-):
1. Not really confirmed Stage 2, there is high that need to break out at price 520

PBID - CUP-COMPLETION CHEATIDX:PBID (3C)
14-10-2024
(+):
1. Low risk entry point
2. Volume dries up
3. Price above MA 50 > 150 > 200 over 10 weeks
4. Price is within 25% of 52 weeks high
5. Price is over 30% of 52 weeks low
6. 200 day MA trending up over 1 month
7. RS Rating is over 70 (86)
(-):
1. Not really in Stage 2-a uptrend
2. No big volume on the breakout

UNTR - CUP WITH HANDLEIDX:UNTR CUP WITH HANDLE
13-12-2024
(+):
1. Low risk entry point on nice drifting handle
2. Price above MA 50 > 150 > 200 over 10 weeks
3. Price is within 25% of 52 weeks high
4. Price is over 30% of 52 weeks low
5. 200 day MA trending up over 1 month
6. RS Rating is over 70 (79)
7. Price break major downtrend, it's mean the stock started on Stage 2 uptrend
(-):
1. The stock is slow mover, it will take a while to reach the target
2. The volume when the stock is breaking out not quite big
Note:
Volume not dries up cause of big capital stock, some of big capital stocks doesn't need to dries up their volume

$NEST - POWER PLAYIDX:NEST - PRIMARY BASE
06-12-2024
(+):
1. Low risk entry point
2. Price surge up almost 100% since it’s IPO indicated that the stock is strong
3. Volume dries up with VCP characteristic during this tight pause
4. One of IPO leader after IDX:DAAZ
5. RS Rating is over 70 (80)
(-):
1. Not the best Power Play setup, on the textboox: There is an explosive price move up over 100% on huge volume within 8 weeks and not corrective more than 20%

PSGO - Primary BaseIDX:PSGO - PRIMARY BASE
25-11-2024
(+):
1. Low risk entry point
2. Volume dries up
3. Price above MA 50 > 200 over 10 weeks
4. Price is within 25% of 52 weeks high
5. Price is over 30% of 52 weeks low
6. 200 day MA trending up over 1 month
7. RS Rating is over 70 (78)
(-):
1. MA 150 < 200
2. The volume on breakout is too small

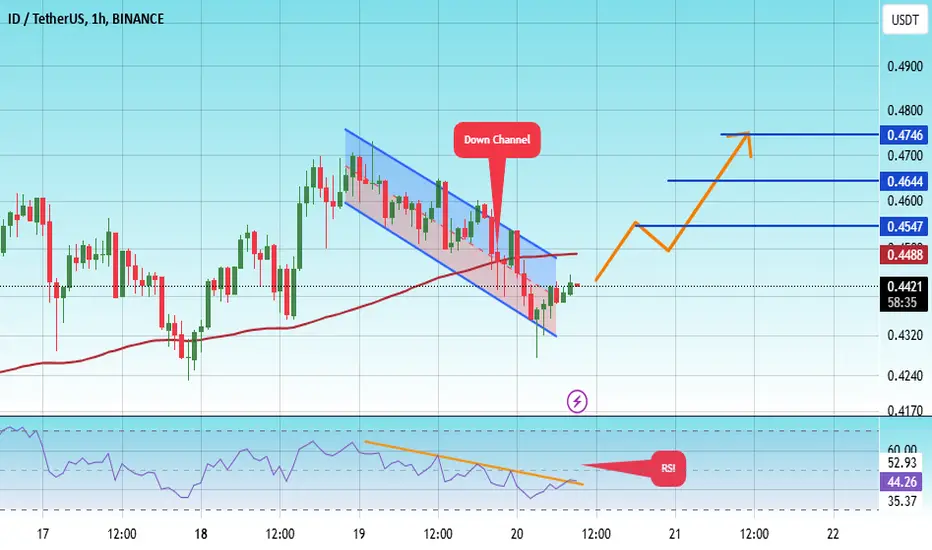
#ID/USDT Ready to go up#ID
The price is moving in a descending channel on the 1-hour frame and sticking to it well
We have a bounce from the lower limit of the descending channel, this support is at 0.4320
We have a downtrend, the RSI indicator is about to break, which supports the rise
We have a trend to stabilize above the moving average 100
Entry price 0.4428
First target 0.4547
Second target 0.4644
Third target 0.4746
BBCA (VCP - 26W 19/3 3T)IDX:BBCA - VCP
18-09-2024
Reason:
1. Low risk entry point
2. Volume dries up
3. Confirmed Stage 2
4. Price above MA 50 > 150 > 200 over 10 weeks
5. Price is within 25% of 52 weeks high
6. Price is over 30% of 52 weeks low
7. 200 day MA trending up over 1 month
Flaws:
1. RS rating less than 70
2. 5 biggest marketcap
3. No big volume on breakout

Nq potencial bullish flat Seems like NQ is in a Bullish flat formation, that will take another few weeks maybe couple months to resolve.
Still Bullish longer term as long as August low is not pierced!
Long around b (in blue) of 3 (green) to new ATH's... then we'll be looking for signs of bearishness and entry to short for a big 5 waves down!

TINS - (VCP 61W 110/14 4T)IDX:TINS (VCP)
23-09-2024
(+):
1. Low risk entry point, cheat buy on pivot point
2. Volume dries up
3. Confirmed Stage 2
4. Price above MA 50 > 150 > 200 over 10 weeks
5. Price is within 25% of 52 weeks high
6. Price is over 30% of 52 weeks low
7. 200 day MA trending up over 1 month
8. RS Rating is over 70 (91)
(-):
1. The breakout on pivot point is not big enough

ASII Buy Trade Setup1. Trend Confirmation:
Identified a Change of Character by the break of the previous high at 4830, also the break of previous downtrend, indicating a reversal in market sentiment and a new bullish trend.
2. Fair Value Gap (FVG):
On the Weekly chart, identified Fair Value Gap between 4790 - 4940.
3. Trade Execution
Entry Price: 5100 ( Long Bullish Bar on 21 Oct 24)
SL: 4770 (FVG)
TP1: 5900
Risk-Reward Ratio (RRR): 1:2.4
Monitoring: Check-in daily closing price
4. Outcome:
Exit Price:
Profit/Loss: pips
-------------
Disclaimer
The analysis and content provided here are intended solely for personal journal and educational purposes. This information does not constitute financial advice, investment advice, or a recommendation to buy or sell any securities. Trading involves significant risk, and you should only trade with money you can afford to lose. Past performance is not indicative of future results. Always conduct your own research and consult with a qualified financial advisor before making any investment decisions.

PEVE - VCPIDX:PEVE - VCP
13-09-2024
1. Low risk entry point
2. Cheat buy on pivot point
3. Volume dries up
4. Price above MA 50 and 200
5. VCP characteristic

CLEO - CUP WITH HANDLEIDX:CLEO - CUP WITH HANDLE
I bought this stock
13-09-2024
Reason to buy:
1. Cup with handle breakout
2. Confirmed stage 2
3. Volume dried up
4. RS Rating > 80
5. Price above MA 50 and 200

AMRT - Double BottomIDX:AMRT - DOUBLE BOTTOM
I bought the stock
10-09-2024
Reason to buy:
1. Double bottom break out with huge volume
2. Price over 50 and 200 MA
3. Low risk entry point
