Look for long & short entry on USDCADWait for an rejection or wick in this area then wait for that rejection to close, then take the long position.
Impulsewave

Where will the Bitcoin adjustment wave come from? #Wave shiftBINANCE:BTCUSDT
Hello, this is Luffy.
Today, I’m going to upload two of the wave perspectives I see.
This is the first point of view I see now. As shown in the picture above, wave 3 is currently in progress, and now it is considered to be in the position of wave 1 of the 3 waves.
First of all, let’s talk about why I did not count from $3000 and counted from $4000 for the first time.
The point of view is that the 3-2 wave cannot penetrate the lower trend line when it goes up 3 par after taking the first wave bottom and the second wave bottom. I counted it like this because it is a perspective that sees that if it penetrates, it is in the second wave again.
The wave-effective point of view is that if the Impulse is to live, it looks like a 3-1 crest point in the late 9400 of Binance.
If you leave here at the closing price and the daily or 12 hour closing price, the impulse wave at the transfer point is considered invalid.
Of course, the 3-1 wave is over now, and the 3-2 wave is in progress, so it can be seen that you can see $10,000 or $9,000.
However, I will tell you how to view the 1st wave in the sofa-dong below.
One more thing to pick up here is the green line, two waves complete, and I'll take a look at the composite flat.
At first, it fell in a zigzag manner, but later I finished it with a flat.
If you look closely, it seems that the 3-3-5 flat fits. I think the TERMINATION has been achieved due to the shortage of the last 5 par.
This is another perspective. It is a view that the first wave is still in progress, and the extension that did not come from the third wave is coming from the fifth wave.
In this case, the 2nd wave adjustment may be larger than expected, so it seems that you need to be careful. It means that it has not yet been properly adjusted.
This is the short-term wave I see from the perspective of the sofa-dong, which is currently in wave 3-1. Considering that there was an extended wave from wave 3, it came out in the short term.
Then it becomes 4 pieces now. However, if the same thing as the 2-wave convergence that I see here comes out, it is considered to be not 4-wave.
Or it becomes the conviction of the 5th wave. So, it is seen as a tuning wave that is very important to look at.
It is a point of view that the condition of the 3-1 wave should be zigzag or flat. Because wave 2 wave 4 wave is considered to be alternating.
It seems to be established if you raise it as it is now or at the 0.382 place.
If it falls below 0.618 and a triangular convergence (triangle pattern) is formed
The 5-1 extension wave is correct.
Is like this.
As long as the 10500 is not broken, the 1-5 impulse wave continues.
This time, it seems to be the key to how the adjustment wave comes out and how it moves at 13k.
It looks like it's a rising market right now, but if you give it from $20,000, it may not be over yet.
I would like to share that there is a canon.
It seems to be rising after the current abc adjustment. It’s more like that because I drilled the 9800 line
I can see it.
But let’s take a look at how it can be transformed when you give it a composite adjustment.
After substituting the value of a value from 20,000 to 3k as the value of x, drawing the harmonics Gartley and Butterfly
The pattern is drawn. However, in the case of including the tail of the Gartley, there is a slight difference in the value of b.
No, because it exceeds 0.618.
Butterfly theory is established. However, the c-value tail exceeds 0.886 and cannot be established.
You can see it.
I think if there is a futures market where short selling is possible, even if the tail price is slightly different
I think it works haha
Here, you can continue flat to 3-3-5 by flat adjustment complex with Gartley.
Or, I think you can continue a flat pattern irregularly with a butterfly.
It seems to be a place to be careful and a place to be careful.


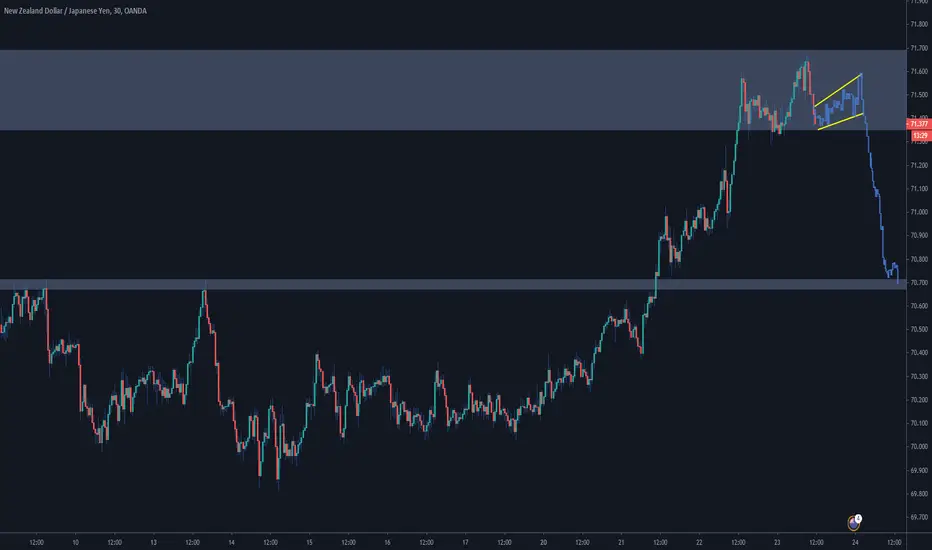
Looking for continuation to downsideLooking for some sort of continuation pattern for further downside momentum


Looking for shorts After an initial drive to the downside, I am now looking to get short if I can get some sort of corrective structure before hopefully seeing it move lower.

Wait for a correction before a possible push lowerwaiting to see what kind of price action develops at this major price level
EURUSD Elliot Waves/ABC Correction PredictionI see that it is too late to hop into this pair, the end of the 4th wave is coming so therefore I'll be speculating where price goes to not just next but potentially after that to gain the most profit possible with the data given. If price decides to push down and show some sort of switch in momentum then depending on what data comes from the exhaustion will give me an idea of where to enter Bearish as there seems to be Bearish Orders built around the beginning of potentially what would be the A Wave of the ABC Correction Pattern. Using Market Structure only gives more confirmation of this idea.

Bitcoin Elliott Wave Sequence Geared for Bears | Jeremy WagnerHi,
Bitcoin's sideways grind is meant to lull traders to sleep. There are some bearish patterns bubbling inside this range that points prices towards the low 8000's.
We have a completed 5-3 pattern where a bearish impulse wave (the five) is followed by a complex correction higher (the three). This 5-3 pattern began on June 22 and completed on July 8. This implies bitcoin prices are ripe to turn lower from near current levels.
Technical support and wave relationships begin to appear near 8400 and 8235 with even lower levels in play. The risk to reward ratio is strong from this levels in that if prices increase above 9500, then there is another pattern at play.
Good luck!


EURUSD Up Trend is Mature | Elliott Wave | Jeremy WagnerThough EURUSD has made quite the run higher in recent weeks, this up trend is mature at high risk of reversing.
Using Elliott Wave Theory, it is difficult right now to determine if the bullish impulse wave (one of the 5 basic Elliott Wave patterns) that created this up trend is over and if EURUSD is beginning to make a run at new lows (below 1.06) or if we see one more pop higher in wave 5 of the impulse...a finishing wave.
There are 2 labels on the chart:
1. Blue labels (and blue arrow) -- represent a wave count suggesting the high is already in and we are about to see a wave 3 lower. Price rejected today at the 78.6% retracement level of blue wave 1. This would suggest EURUSD rolls over soon. A break below 1.1170 increases the probability of this scenario.
2. Black labels (and black arrows) -- represents a wave count suggesting we are grinding sideways in wave 4 now, with a wave 5 higher that moves slightly beyond 1.1423. Though it touches a new high, it is a terminating wave and then the new down trend would begin.
Good luck!

Gold Approaching Multi-Year Top? | Elliott Wave | Jeremy WagnerThis recent surge in gold may be the finishing touches on a 4+ year up trend. Gold appears to be in an ending waves at multiple degrees of trend. Perhaps gold taps the upper end of this channel, but it doesn't have to.
After this impulse wave completes, a very large correction may take over. This correction may coincide with US Dollar strength. Look for the yellow channel to break to be evidence of a top. A move below $1740 is another piece of evidence of a major top for gold prices. Finally, below $1669 may be the nail in the coffin for gold suggesting a full retracement of the 4+ year uptrend back to $1,000.

TikTok Hype - Dogecoin EXPLOSION? Selling Points and Resistance DOGE COIN TikTok Hype EXPLOSION - Selling Points and Resistance Lines
TikTok, a popular app with over 2 billion young users is hyping up DOGE Coin and the videos are trending as of now. Their goal is to get Dogecoin BINANCE:DOGEBTC to $1.00.
As of July 8th 2020 at 12:01 AM, Dogecoin stands at 0.00417005 USD (4/1000th of a dollar) and has risen 118% in the last 1.5 days alone.
This will most likely follow the standard #impulsewave 12345-ABC structure.
BINANCE:DOGEUSD
This is going to result in a short term explosion and will most likeley crash back down to around 0.0024 USD, as good ole $DOGE always does.
No worries, hype trains are fun to ride, and TikTok is more powerful than any of us realize! We'll see if these kids can do the impossible (but is it impossible though?)
If Doge goes to $1, I'll have to buy the Dogecoin Lambo.
JOKES ASIDE ---
This exposure is great for the cryptocurrency Market and adoption as a whole. Millions of new users will be introduced to the world of investing and cryptocurrency.
DISCLAIMER
Please beware of hype trends like this. If you know how to invest and have knowledge and experience with impulse waves, go ahead.
However, I am no financial advisor. If you don't know what you're doing, I do not suggest investing/trading Doge. If you are experienced, invest at your own risk!
#tiktok #impulsewave #kids #2020 #investing #doge #dogecoin #shitcoin #DOGEUSD #hype #hypetrain

corrective movement making double bottomCorrectively moving back down to the low meaning there could be some upside momentum building
Is Bitcoin Getting Ready to Dump? | Elliott Wave | Jeremy WagnerEarlier in June, I laid out an Elliott Wave count for Bitcoin which proposed a correction deeper to 5500-7000.
Zooming in on an intraday chart, it appears as though Bitcoin is getting ready to dump to 8,000 and possibly lower. Bitcoin has been adhering to the mid-line of a longer term price channel (yellow dotted line). It has decisively fallen below this line in an Elliott wave impulse pattern.
This suggests we may get a little bump higher, but the pump (or shall I say dump) is primed.
The lower support line of the price channel and horizontal support crosses near 8,000. There are wave relationships showing up in the 8,000 area as well. Should we see a dump in price, a short term reaction should take place near 8,000.
Cheers!

ETHUSD 15% Correction | Elliott Wave | Jeremy WagnerEther is primed for at least a 15% correction.
After a completed impulse wave, I am anticipating a corrective structure down to $150-$200. This would represent a 15-35% correction depending on how deep into the box it corrects. Longer term HODL'ers will have an good opportunity to buy at these lower levels.
Of course, no guarantees this will happen. I'm using Elliott Wave as a frame work for determining market trends and hot spots for my crypto friends.

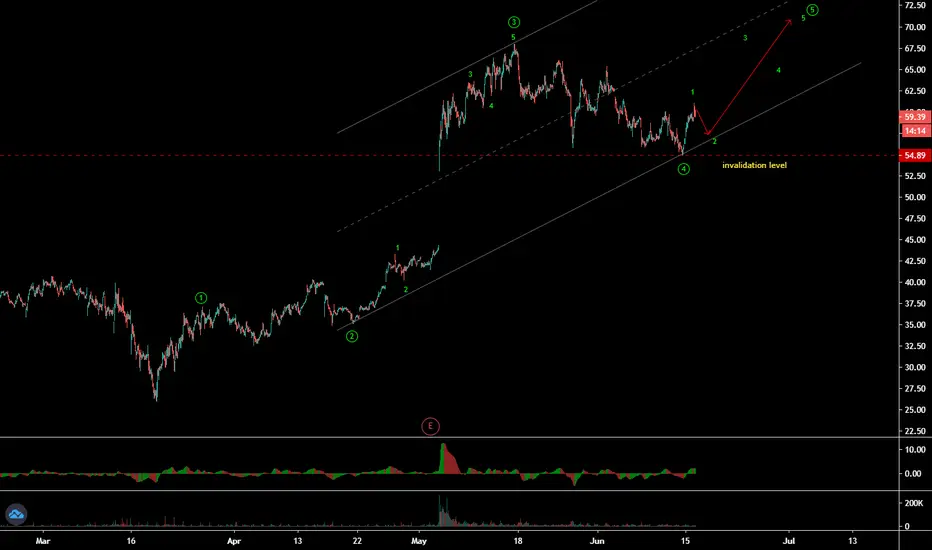
Chegg Inc (CHGG - NYSE) - Impulse wave patternChegg Inc (CHGG - NYSE) has completed 4th wave in WXY correction double zigzag. It starts moving up in 5th final wave up, where it made 1st subwave up, now wait for subwave 2 to complete down side along with market today. Keep eye on invalidation level as stop level. Thereafter 3rd subwave will start moving up.
Godaddy Inc (GDDY - NYSE) - Impulse wave patternGodaddy Inc (GDDY - NYSE) has completed wave 4th as ABC zigzag correction. It starts moving up in 5th wave. Small correction within 3 min time frame will be good entry to capture impulse cycle, until it retains the invalidation level. In weekly time frame, it is in strong up trend and near to make all time high.

Splunk Inc (SPLK - NASDAQ) - Impulse wave patternSplunk Inc (SPLK - NASDAQ) is in impulse wave pattern. It has completed 4th subwave of 3rd wave up. It is moving up in 5th subwave of 3rd wave up. So small pull back within 5 min time frame can be used to get in to trade for new high. This is out-performer to SPX. In weekly time frame, it is in 5th wave of C wave up.


Waiting for a rising bottomIn the 'coming bedtime for GBP' - related idea, I have expected an upside pressure which is here. 'Near the resistance' - idea, I forecasted a stop in the rising. EURGBP has been moving sideways from that time and the q. is what's next.
Although it trades above wave B with five-wave impulse, but the structure seems complete, that's why I expect to see a declining correction which should be high low around 0.8925, on the other hand, if trade below 0.8860 then the 0.88 could serve a good support zone.
Wait for the signs

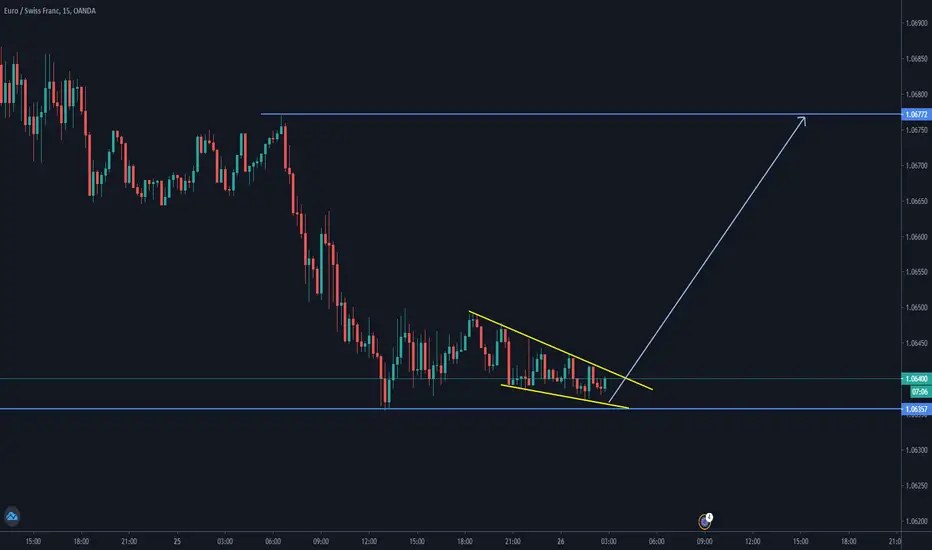
Long after corrective patternWaiting to see if some form of corrective pattern forms.. will then be looking for long opportunities
