SPX futures consolidatingBy the morning and open of regular market friday we should have a new gap down in indices due to futures pullback according to ai projection
Index

✅DXY BULLISH BREAKOUT|LONG🚀
✅DXY is going up now
And the index broke the
Key horizontal level of 105.000
Which is a support now and
After the pullback and retest
Of the new support we will
Be expecting a bullish continuation
LONG🚀
✅Like and subscribe to never miss a new idea!✅

DAX Future Quick Video Idea - 2024.04.08EASYMARKETS:DAXEUR
Disclaimer:
easyMarkets Account on TradingView allows you to combine easyMarkets industry leading conditions, regulated trading and tight fixed spreads with TradingView's powerful social network for traders, advanced charting and analytics. Access no slippage on limit orders, tight fixed spreads, negative balance protection, no hidden fees or commission, and seamless integration.
Any opinions, news, research, analyses, prices, other information, or links to third-party sites contained on this website are provided on an "as-is" basis, are intended only to be informative, is not an advice nor a recommendation, nor research, or a record of our trading prices, or an offer of, or solicitation for a transaction in any financial instrument and thus should not be treated as such. The information provided does not involve any specific investment objectives, financial situation and needs of any specific person who may receive it. Please be aware, that past performance is not a reliable indicator of future performance and/or results. Past Performance or Forward-looking scenarios based upon the reasonable beliefs of the third-party provider are not a guarantee of future performance. Actual results may differ materially from those anticipated in forward-looking or past performance statements. easyMarkets makes no representation or warranty and assumes no liability as to the accuracy or completeness of the information provided, nor any loss arising from any investment based on a recommendation, forecast or any information supplied by any third-party.

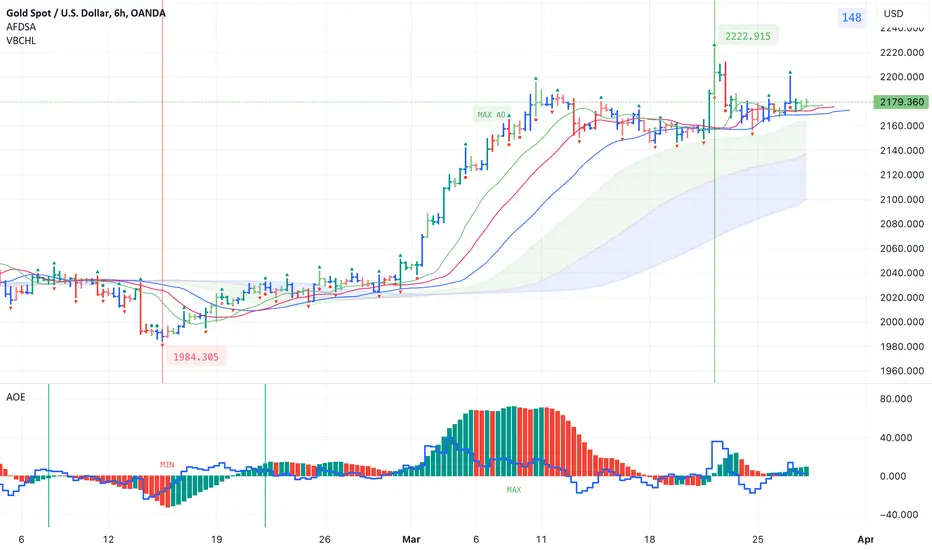
Indicators for trading using Bill Williams' Profitunity strategyI published 3 indicators for trading using Bill Williams' Profitunity strategy. For each indicator, I have added a visual and detailed description in English and Russian. In this post I will briefly describe these indicators and how I use them together.
AFDSA indicator (Alligator + Fractals + Divergent & Squat Bars + Signal Alerts)
Includes Williams Alligator, Williams Fractals, Divergent Bars, Market Facilitation Index, Highest and Lowest Bars, maximum or minimum peak of the Awesome Oscillator, and signal alerts based on Bill Williams' Profitunity strategy:
Bullish and Bearish Divergent Bar Signal + Squat Bar + Green Bar + Fake Bar + Awesome Oscillator Color Change + AO Divergence.
Crossing the green line (Lips) of an open Alligator.
Formation of a fractal.
Signal about the breakdown of the last upper or lower fractal.
Signal about the appearance of a new maximum or minimum peak of AO in the interval of 140 bars from the last bar.
I also added an Alligator display for the higher timeframe, for example, if the chart timeframe is 1 hour, then the higher timeframe will automatically be 4 hours, if the chart timeframe is 4 hours, then the higher timeframe will be 1 day, etc.
AOE Oscillator (Awesome Oscillator + Bars count lines + EMA Line)
Includes the Awesome Oscillator with two vertical lines at a distance of 100 and 140 bars from the last bar to determine the third Elliott wave by the maximum peak of AO in the interval from 100 to 140 bars according to Bill Williams' Profitunity strategy. Additionally, a faster EMA line is displayed.
I also added display of the AO line for the lower timeframe instead of the EMA line if the Moving Average Line values (method, length and source) are equal to the Awesome Oscillator values in the indicator settings. For example, if the chart timeframe is 1 day, then the lower timeframe will automatically be 4 hours, if the chart timeframe is 4 hours, then the lower timeframe will be 1 hour, etc.
VBCHL indicator (Visible bars count on chart + highest/lowest bars, max/min AO)
The indicator displays the number of visible bars on the screen, including the prices of the highest and lowest bars, the maximum or minimum value of the Awesome Oscillator. The values change dynamically when scrolling or changing the scale of the chart, but with a delay of several seconds, so this feature is included in a separate indicator so as not to slow down the work of other indicators.
Indicator settings
In the AFDSA indicator I use the following settings:
By default, the Squat Bar is colored blue, and all other bars are colored to match the Awesome Oscillator color, except for the Fake bars, which are colored with a lighter AO color. But I also enable the display of "Green" Divergent bars in the "Green Bars > Show" field.
I enable the display of Alligator for higher timeframes in the "Alligator for higher timeframe > Enable" field.
In the indicator style settings, I disable the display of the highest and lowest bars, maximum and minimum AO peak labels, because these labels are also displayed by the VBCHL indicator depending on the number of visible bars in the chart window.
Only after opening a position, I enable all additional alerts in the “Enable all additional alerts” field (after changing this field, you need to re-create the alert for the current chart): crossing the green line of an open Alligator, formation of a fractal, appearance of a new maximum or minimum AO peak.
In the settings of the AOE oscillator, I enable the display of the AO line for the lower timeframe instead of the EMA line, setting the same values in the fields for the Moving Average Line (method, length and source) and Awesome Oscillator.
In the VBCHL indicator settings, I only enable the simple display text style for labels in the "Simple display text style for labels" field.
As a result, when analyzing the current chart, I immediately see all the signals on the chart, the location of the bars relative to the Alligator on the higher timeframe and changes in the Awesome Oscillator on the lower timeframe. And thanks to the VBCHL indicator, I quickly select the desired timeframe for analyzing the 5-wave Elliott impulse, focusing on the interval of 140 bars, and immediately see whether there is divergence between the maximum AO peak and the following lower AO peak in this interval.
✅DAX WILL KEEP GROWING|LONG🚀
✅DAX is trading in an uptrend
Along the rising support line
Which makes me bullish biased
And the index is about to retest the rising support
Thus, a rebound and a move up is expected
LONG🚀
✅Like and subscribe to never miss a new idea!✅

DAX Bearish Breakout! Sell!
Hello,Traders!
DAX broke out of the
Long-term rising wedge
And the breakout is confirmed
So we are bearish biased now
And we will be expecting
A further move down
Sell!
Like, comment and subscribe to help us grow!
Check out other forecasts below too!

Gap Down, Retrace, RolloverIm using this algo strategy to commit to a bars pattern from history in the Nasdaq. It seems that theres a high chance for continued pullback in the broader index led by tech and risk equities as bear volume picks up. these are the levels im watching for short opportunities.

Stocks Put A Top In This Week! Further Downside to Come!ES (US 500) Fibs, Hourly: ES is our main index that provides helps us determine trend. You will notice that this week had a change of character. The market had taken the stairs up, but is now taking the elevator down, with sharp moves coming in a few hours to the downside. Expect more of this. ES pattern at the top is more head and shoulders like. And, unlike YM, we got a FULL All the Way Half Way Back Short this week, going back to the 50% line on Friday and selling off from there. Look for a gap up on Sunday night/Monday and a sell into strength of a 2nd test at the 5272.50 level. Our Target is all the way down at the 5158.25 level, over a 100 points away.
####TRADE ALERT####
ES (US 500- S&P500)
Call: Short
Entry Type: Limit, ideally better than 5262.50 no worse than 5245
SL: 5290
TP1 / TP2: 5158.25
###################

SPY Will Go Down! Sell!
Hello,Traders!
SPY broke out of the rising
Wedge pattern and is now
Retesting the broken support
So we will be expecting
A further move down
Sell!
Like, comment and subscribe to help us grow!
Check out other forecasts below too!


S&P500: Bearish reversal to the 1D MA100.The S&P500 remains bullish on its 1D technical outlook (RSI = 60.356, MACD = 47.470, ADX = 36.597) but today is having so far the strongest bearish 1D candle since December 15th 2022. Having hit the 0.786 Fibonacci level of the Channel Up at the start of the week, this can be a technical correction to at least the 1D MA100 if the 1D MA50 breaks. Consequently we have a short term TP = 4,980.
## If you like our free content follow our profile to get more daily ideas. ##
## Comments and likes are greatly appreciated. ##

DAX: Overbought and in need of a technical correction.DAX is almost overbought on the 1D timeframe (RSI = 69.159, MACD = 322.400, ADX = 30.730) and heavily on the 1W (RSI = 76.198), which suggests that the long term trend is massively bullish but on the short term a pull back below the 1D MA50 is needed in order to harmonize the supply and demand equilibrium. The index has already been rejected at the top of the HH Zone, which is a first sign for a potential pullback. Even though in the first two quarters of 2023 it spent considerable time inside this Zone before making a correction (even under the 1D MA200), this time the 'necessity' for a short term correction is greater. We are aiming for the pattern minimum of -6.42% (TP = 17,450).
## If you like our free content follow our profile to get more daily ideas. ##
## Comments and likes are greatly appreciated. ##

CAC40 #HVF for a doubleBig Pattern = Big Moves
Long consolidations = Fast Breakouts
The #NIKKEI had a beautiful chart pattern and we are seeing the explosive up moves occur in that market.
The French stock market - along much Europe hasn't done much for over two years
But we are quickly approaching Target 1 of a large --- non conventional HVF
Is it monetary stimulus or economic growth that causes the CAC to double?
Don't know ...
One is more desirable of course.
But the same boys
cheering the US stock market screaming higher after a decade plus of stimulus. zero rates and buybacks, does it matter?
@TheCryptoSniper

VIX cycles analysis for the future behavior predictionTVC:VIX
Third 7-years cycle of the VIX index reducing starts this year and will long till the end of 2030.
In my point of view, this means, that the level of the greed starts to grow year-to-year, which will have an effect for the potential of the long positions in the long-term period of time.
#investing #stocks #idea #forecast #furoreggs #trends #index

DXY - NEW BREAKOUT 🚀
As We Talked in The Previous Analysis:
The US Dollar Index Reached a Support Level.
The Resistance Line is Broken!
Currently, The Market Broke The Resistance Level,
This Key Level Becomes a New Support Level.
So I Expect a Bullish Move 📈
TARGET: 104.810🎯

DOW JONES - BULLISH MOVE 🚀Hello Traders !
On Wednesday 20 March The US30 Broke The Resistance Level (39284.87 - 39080.39).
The Price Retreated To The Support Level and Failed To Break it !
The Lower High is Broken (ChoCh).
So, I Expect a Bullish Move 📈
TARGET: 39790.00🎯

DOLLAR_INDX,DXY H4 27 March 2024💵 DOLLAR_INDX, H4 💵 27 March 2024
The Dollar Index, tracking against a basket of major currencies, held firm amidst a wait-and-see sentiment among investors. With anticipation mounting for the release of the PCE Price Index data crucial for gauging inflation and scheduled for Good Friday, market movement is expected to remain subdued. Despite the holiday, Top Fed officials, including Chair Jerome Powell and Mary Daly, are slated to provide insights, setting the stage for potential market shifts. Traders are advised to stay vigilant and strategize as economic data released over the weekend could spur heightened volatility come Monday.
The Dollar Index is trading higher while currently testing the resistance level. Suggesting the index might extend its gains after breakout .
Resistance level: 104.45, 104.95📉
Support level:104.00, 103.65📈

US30 CALLSThe price landed on a support zone and appears to be slowly forming higher lows.
Expecting the price to test the ATH area.

DXY Risky Long! Buy!
Hello,Traders!
DXY is trading in an uptrend
And made a pullback and
Retest of the new support
Level of 104.078 from
Where we are seeing a
Bullish rebound so
I think that we will see
A further move up
Buy!
Like, comment and subscribe to help us grow!
Check out other forecasts below too!

DOLLAR_INDX H4 25 March 2024💵 DOLLAR_INDX, H4 💵 25 March 2024
The Dollar Index continued its upward trajectory for a second consecutive week, bolstered by the robust performance of the US economy and heightened expectations of interest rate hikes. The potential yield disparity between the US Dollar and other major currencies remained a significant driver, underpinning the greenback's strength. Moreover, the Fed's upward revision of economic growth forecasts for the United States instilled confidence among investors, further reinforcing positive sentiment towards the US economic outlook.
The Dollar Index is trading higher while currently testing the resistance level. Suggesting the index might enter overbought territory.
Resistance level: 104.45, 104.95📉
Support level:104.00, 103.65📈

Divergence Unveiled: Ibovespa & S&P500“Emerging markets conclude 2023 on better note than developed markets” – S&P Global Market Intelligence.
How much of this has been reflected in the respective market indices?
Figure 1: Ibovespa and E-mini S&P500 Index Futures
Figure 1 presents a retrospective view of the Ibovespa Index Futures (IND1!) and E-mini S&P500 Index Futures (ES1!) since the onset of the pandemic. While the indices initially traded in tandem, a noticeable deviation emerged since the middle of 2021. The IND Futures to ES Futures ratio testing long-term resistance at 25 raises questions about a potential rebound or breakout to the downside. Let's delve into the methodologies of these two index futures to gain insights into their recent divergence.
Index Methodology and Weightings
Figure 2: Top 10 Constituents of Both Indices
Examining the top 10 constituents of both indices in Figure 2, we observe fundamental differences. Despite their similarities as float-weighted benchmarks for large-cap stocks in their respective countries, the Ibovespa Index comprises 86 stocks compared to the SP500's 500. This fundamental distinction results in a significantly larger total weight for the top 10 constituents of the Ibovespa Index, suggesting that IND future prices are more susceptible to the performance of its leading components.
Ibovespa Driven by Global Commodity Prices
Figure 3: Ibovespa vs Brent Crude Oil, Nickel, and Iron Ore
Dominated by the Energy, Financials and Basic Materials sector, the combined weight of VALE SA and PETROBRAS holds significant influence. While VALE SA is the largest producer of iron ore and nickel in the world, PETROBRAS is heavily involved in the petroleum industry. Their earnings are likely to increase following an increase in the traded prices of iron ore, nickel, and crude oil, respectively.
Positive correlations with Nickel, Iron Ore, and Crude Oil Futures prices indicate periods marked in grey boxes since the pandemic, where fluctuations in commodity futures potentially explain observed patterns in IND prices.
Figure 4: Global Commodity Index
Hence, given IND1!'s demonstrated sensitivity to commodities, understanding the general trajectory of commodities becomes paramount. The S&P Goldman Sachs Commodity Index (GSCI) provides an overview for commodities. In Figure 4, the GSCI acts as a good proxy for the commodities cycle and direction, here we observe a 30% correction from the peak, erasing some of the gains derived from the post-pandemic recovery and the Russia-Ukraine war. However, since the beginning of 2024 we see signs of a potential trend higher with the index starting to creep higher.
Figure 5: Bullish Trends Observed on Multiple Commodities
Is this just part of the usual price volatility for commodities or is the move higher significant? A detailed scrutiny of recent price movements in Figure 5 reveals a bullish outlook for all three previously examined commodities, relevant especially to the Ibovespa Index. The breakout from an ascending triangle in Brent Crude Oil Futures, the price rebound from historical support in Nickel Futures, and the testing of the upside trendline in Iron Ore Futures collectively indicate a prevailing bullish bias, perhaps suggesting more to the broader move higher for commodities.
Are Lower Rates Better?
Figure 6: Changes in Rates and USDBRL on Ibovespa
The Financial Sector, with significant weight in the index, is examined. While higher interest rates expand profit margins of financial institutions, extended periods of tight monetary policy can expose vulnerabilities and increase loan losses.
Since August 2023, Brazil’s Central Bank Monetary Policy Committee, Copom, has had five consecutive rate cutes up to a cumulative total of 250 basis points while the market continues to alter bets on the Fed’s first rate cut. Intriguingly, while interest rate parity would suggest a strengthening USDBRL, the observed weakening suggests a unique deviation.
Furthermore, as the Fed gains more confidence, evidenced by each data print, the likelihood of impending rate cuts becomes more apparent. Conversely, the outlook for further cuts by Copom is less clear due to persistently high inflation. Interpreting these factors collectively points towards a weaker USDBRL and a correspondingly stronger IND1!; as suggested by the historical inverse relationship between Ibovespa and USDBRL observed in Figure 6.
Additional Support for Ibovespa
Figure 7: Brazil’s Growing Net Exports
The rolling average of the net exports, although exhibiting some degrees of seasonality, seems to be a leading indicator of the IND prices. The reversal and positive trend in the rolling average of net exports since 2015 aligns with the climbing IND prices, indicating substantial support from Brazil's trade balance.
EM Still an Attractive Option
Figure 8: Comparing Both Index Futures’ RSI
Figure 8 brings to light yet another noteworthy point, using the ES1! as a proxy for the Developed Markets (DM) and the IND1! as a proxy for Emerging Markets (EM), we see the DM significantly overbought relatively to the EM. Hence, we argue that there is further room for the EM Index to grow.
Putting into Practice
Figure 9: Setting up the Trade
Looking at a shorter timeline, Figure 9 unfolds a compelling narrative marked by a recent decisive breakout from an inverse head and shoulders pattern. This breakout, coupled with the notable reversal in commodity prices, Brazil’s improving balance of trade, a weaker USDBRL, and the RSI not yet overbought; we lean bullish on the IND1!.
To express this view, we can long the Ibovespa Index April 2024 Futures (INDJ4) at the current price level of 129,070.
• We can set the take profit by adding the difference between the neckline and the bottom of the head (24,695), to the neckline (121,980). This puts our take profit at 146,675 and a hypothetical gain of:
146,675 – 129,070 = 17,605 points.
• Likewise, we can set the stop loss at the neckline (121,980), which brings us a hypothetical maximum loss of:
129,070 – 121,980 = 7,090 points.
• Each point is equivalent to 1 BRL.
Overall
In summary, understanding the intricate dynamics between global commodity prices, monetary policies, and trade balances provides valuable insights for anticipating the trajectory of the Ibovespa Index Futures in the evolving financial landscape.

DXY - BULLISH SCENARIO 📈Hello Traders !
On The Daily Time Frame, The US Dollar Index Reached a Support Level.
Currently, The Resistance Line is Broken!
So, I Expect a Bullish Scenario:
If The Price Breaks and Closes Above The Resistance Level !
We Will See a Bullish Move...
TARGET: 104.810🎯

DXY : A bull run?Before anything ,
I have spent 8 years navigating the financial markets, with Level 3 CFA and a Master's in Finance under my belt, I've seen my fair share of trends.
The value of the US Dollar Index is influenced by several factors, including decisions by the Federal Reserve (Fed), US government actions, and the overall health of the US economy. The Fed's monetary policy, statements by the US administration, and US economic data all play a role in how strong the US dollar is compared to other currencies.
and you can check this link and take a look on the technical bias: www.investing.com
As we can see a Resistance level at 104.42-104.45 and a Support level powered by a fair value gap on daily time frame at 103.2-103.8.
