Index

How RSI Alerts Can Supercharge Your Long-Term Crypto PortfolioBuilding a long-term portfolio demands a strategic approach that goes beyond random buys and impulsive decisions.
Instead, savvy investors employ tools like the Relative Strength Index (RSI) to identify advantageous entry points and navigate the market cycles effectively.
💜 If you appreciate our guides, support us with boost button 💜
Here’s a step-by-step guide on how to harness RSI alerts to fortify your long-term crypto holdings.
Step 1: Spotting Entry Opportunities with RSI < 35
When aiming for long-term crypto accumulation, the goal is to buy assets at opportune prices. Setting up your charts with the RSI indicator and adjusting the lower band to 35 enables you to pinpoint instances where cryptocurrencies in your portfolio might have experienced an unwarranted dip. This can be a golden opportunity to acquire assets for the long run, aligning with the principle of buying low.
Step 2: Steering Clear of Overbought Zones with RSI > 70
Conversely, an RSI reading surpassing 70 signals potential overbought conditions. In such instances, it's prudent to exercise caution. Holding off on new purchases during these periods or even considering exiting certain positions that have seen significant price surges allows you to safeguard your returns. Converting gains into stablecoins during overbought phases enhances liquidity, positioning you strategically for future opportunities.
Step 3: Confirm with Other Indicators & DYOR
RSI functions most effectively when complemented by other indicators. Incorporating tools like Moving Averages, Bollinger Bands, and MACD provides a more comprehensive view of market conditions. Remember, thorough research is crucial. Rely on multiple indicators to reinforce your decision-making process and mitigate risks associated with single-point analyses.
Step 4: Get Timely RSI Alerts On Your Email & TradingView App
Time is of the essence in the volatile crypto market. Instead of constantly monitoring prices across various platforms, set up RSI alerts on TradingView to receive timely notifications. This ensures you don’t miss critical market movements and can respond promptly to favorable conditions or potential risks.
How to Create RSI Alerts on TradingView
Open TradingView: Log in to your TradingView account.
Select the Chart: Open the chart of the cryptocurrency you're monitoring.
Add RSI Indicator: Click on "Indicators" at the top, search for RSI "Relative Strength Index", and add it to your chart.
Set RSI Levels: Adjust RSI levels by clicking on the RSI label on the chart, then edit the Upper and Lower Band levels to your preferred values (e.g., 35 for Lower Band, 70 for Upper Band).
Create Alert: Click on the alarm bell icon at the top of the chart, then select "Add Alert." Choose the condition (crossing above/below RSI level), set the desired RSI level, and customize the notification settings.
Save Alert: Confirm and save your alert. You’ll now receive notifications via email or within the TradingView platform when the specified RSI conditions are met.
Effectively utilizing RSI alerts is a game-changer for long-term crypto investors. By intelligently identifying entry points, avoiding overbought conditions, confirming signals with other indicators, and staying informed with timely alerts, you position yourself for success in the dynamic world of cryptocurrencies. Enhance your portfolio strategy with RSI – a tool that brings precision and efficiency to your crypto investment journey.

DXY D1 - Bullish BounceDXY D1 - Relief Rally
The dollar index has undergone a significant retreat, showcasing a robust decline from the recent swing low to the swing high. It elegantly touched the 618 region, displaying a compelling wick, and gracefully closed just above our crucial 103.000 support level.
Anticipating a potential rebound from this fortifying support zone, we may witness a temporary respite before a possible breach of the 103.000 support on the imminent second attempt.
Meanwhile, the US30, US100, and XAUUSD are scaling impressive heights, mirroring the upward momentum seen in GBPUSD and EURUSD. Stay tuned for a detailed analysis unfolding shortly.

✅DXY WILL GO DOWN|SHORT🔥
✅DXY is trading in a
Downtrend and the index
Broke the key horizontal level
Of 103.200 and is now about
To retest the broken level
Which is now a resistance
From where I will be expecting
A bearish continuation
SHORT🔥
✅Like and subscribe to never miss a new idea!✅

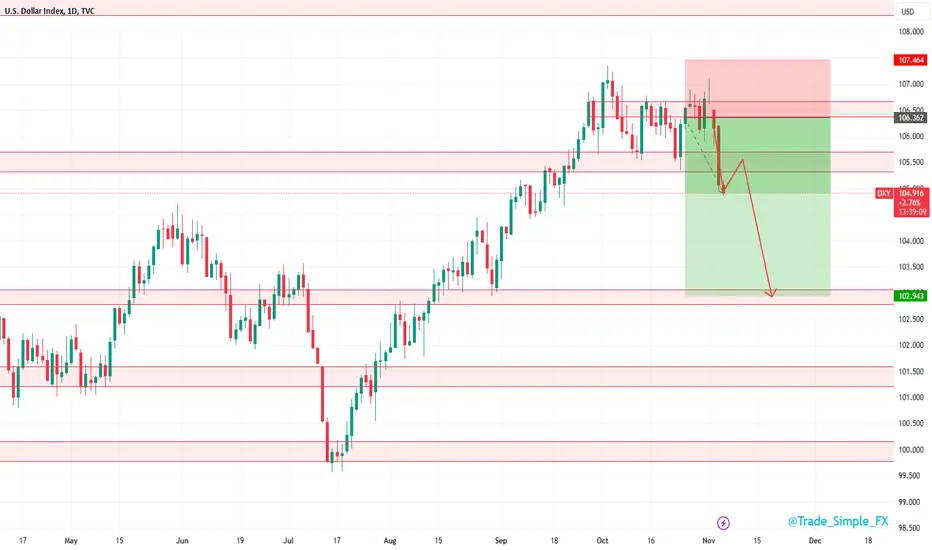
DXY Bearish Breakout! Sell!
Hello,Traders!
DXY broke the key
Horizontal level of 103.329
Which is now a resistance
And the breakout is confirmed
So we are now bearish biased
And we will be expecting
A further move down
After some pullback and retest
Sell!
Like, comment and subscribe to help us grow!
Check out other forecasts below too!

DXY D1 - Short SignalDXY D1
We continue to navigate to the southside here with the dollar index. During recent trade and events over the past few weeks.
Should we breach the significant 103.000 threshold, our sights are set on the next target at 101.500.
Additionally, anticipate a continued upward trajectory for XAUUSD, with all-time highs on the horizon.

GOLD: Will Start Falling! Here is Why:
The price of GOLD will most likely collapse soon enough, due to the supply beginning to exceed demand which we can see by looking at the chart of the pair.
❤️ Please, support our work with like & comment! ❤️

✅SPY TIME TO SELL|SHORT🔥
✅SPY is set to retest a
Strong resistance level above at 459$
After trading in a local uptrend for some time
Which makes a bearish pullback a likely scenario
With the target being a local support below at 452$
SHORT🔥
✅Like and subscribe to never miss a new idea!✅

Tips on Adjusting the RSI (Part 2) Although the standard setting for the RSI is 70 (overbought) and 30 (oversold), I prefer to adjust the levels to 80 and 20. The purpose of this is to identify the extremely overbought/oversold regions.
In addition to adjusting the levels, I would pay attention to the chart when the RSI enters in the overbought/oversold region (but would hold back on entering a trade)
I would only enter a trade when the RSI turns down/up from the overbought/oversold region.
This would signal that the price is likely to fall/rise as the RSI reverses from the extremes and back within range.

Learning to use the RSI (Part 1)The Relative Strength Index (RSI) is a popular momentum oscillator used in technical analysis to identify overbought or oversold conditions in the market. The RSI is measured on a scale from 0 to 100,
RSI values above 70 are often considered overbought, suggesting that the price may be due for a reversal or pullback.
RSI values below 30 are often considered oversold, indicating that the price may be due for a bounce or recovery.
A common mistake most traders will make is to assume that once RSI signals an overbought/oversold condition, the price should drop/rise, hence leading to a sell/buy decision.
In the 2 examples highlighted (solid blue lines), you will notice that although RSI signaled an overbought/oversold condition, the price continued to climb/drop despite being overbought/oversold.
Remember: Prices can be overbought/oversold for an extended period of time
When using any indicator, always remind yourself of what it is measuring and remember that it is just math (not magic). The indicator is supposed to help quantify and help you see things clearer on the chart (rather than numbers).
Check out Part 2 for Tips on Adjusting the RSI

✅DXY GROWTH FROM SUPPORT AHEAD|LONG🚀
✅DXY has been falling for a
While now but has almost
Reached a horizontal support
Level of 103.00 and as it is
Oversold at the moment
I will be expecting
A local move up
LONG🚀
✅Like and subscribe to never miss a new idea!✅

DXY D1 - Short SignalThe dollar index has experienced a rebound, surpassing the 103.00 threshold. When examining currency pairs such as GBPUSD, AUDUSD, and EURUSD, it becomes evident that there is further potential for movement within the frameworks we are monitoring. This suggests the likelihood of DXY breaching the 103.000 support level, setting the stage for extended targets in the vicinity of 101.500.
More analysis to follow on AUDUSD, GBPUSD and the like.

SPY Potential Short! Sell!
Hello,Traders!
SPY has almost reached
A horizontal resistance
Level of 459$ and the
Index is locally overbought
So a local bearish correction
Is to be expected I think
Sell!
Like, comment and subscribe to help us grow!
Check out other forecasts below too!

DXY D1 - Neutral outlookDXY D1
The dollar index has displayed robust corrective movements in recent weeks, buoyed by a diverse set of supporting data points. The 103.000 handle emerges as a pivotal support zone, potentially paving the way for a substantial rebound in the USD. It remains to be seen how events will unfold.
Examining the market from its swing low to swing high, a substantial and healthy 55% correction has taken place thus far.

ALT Season Is Starting - Total Market Cap 2MartyBoots here. I have been trading for 16 years and I am here to share my ideas with you to help the Crypto space.
This video and chart helps show you ALT Season is about to start.
The ALT Market is in its bottoming phase, be prepared. ALT Season is coming. This is the time when its possible to make life changing money .
Do NOT miss out on this coming bull market
CryptoCheck Team

Altcoin Market Cap: Destined to reach 6 TrillionAlt coin market cap reaching 6T is no longer a dream, its just a matter of time.
In the previous run altcoin marketcap increased from 40B to 1.8T, which is a very significant increase of 45x.
If we see similar run this time, then 45x of 430B will be 19T, even if it reached half of this (9T) then its gonna be a huge win for altcoins. we can expect some coins to hit 100x or even 1000x.
If we look at the MACD, in the last cycle (2020) after the MACD cross market cap increase exponentially, and we are currently seeing MACD getting ready to cross and market is getting ready for bitcoin halving with positive sentiment. Overall we are very confident on MACD cross and altcoin reaching the market cap of 6-9T easily.
Let's wait and watch, give a boost and share your thoughts in the comments.
Cheers
GreenCrypto

Ready to short NasdaqWe are waiting for it to make a short upward correction first and sell off to 15,700

MEME Coin - Potential Price targets Memecoin (MEME) is the native ecosystem token of Memeland. Memeland is the web3 venture studio by 9GAG, the globally popular meme platform.
This is not financial advice, but it looks as if the common money is starting to return and they inherently love meme coins.
Here are some theoretical targets if we do see AMEX:MEME start to moon.
Support: $.02459
Target 1 $.02595 (+5.35%)
Target 2: $.02896 (+17.50%)
Target 3: $.0341 (+38.71%)

US500 - Break or Make ❗️Hello TradingView Family / Fellow Traders. This is Richard, also known as theSignalyst.
DAILY: Left Chart
📊 From a long-term perspective, US500 has been trading bearishly within the confines of a descending broadening wedge marked in red. Currently , it is approaching the upper boundary, which acts as a non-horizontal resistance.
📈 For the bulls to maintain control and assume dominance from a macro perspective, a breakthrough above 4420.0 is essential.
Meanwhile , there's still potential for the bears to exert influence and drive the price lower.
H1: Right Chart
From a short-term viewpoint, US500 remains bullish; however, the momentum appears to be weakening as the recent price action has been relatively flat, occurring within the boundaries of the orange channel.
📉 For the bears to seize control and trigger a bearish scenario, a drop below the last low in the orange channel, around 4360.0, is necessary.
Meanwhile , the bulls will retain control unless this key level is breached.
📚 Always follow your trading plan regarding entry, risk management, and trade management.
Good luck!
All Strategies Are Good; If Managed Properly!
~Rich

XAU GOLD scenario According to my analysis, the movement of the gold index will be like this.
This is not a signal.

Clear view on the monthly candlesClear and straight forward analysis, just watching the monthly levels to reduce the noise within the markets.
Green horizontal ray shows previous cycle all time highs and possible new support zones.
Red horizontal ray shows intermediate resistance which was now flipped.
Let's follow up on this view in a few weeks time.

DXY D1 - Short SignalDXY D1
We've successfully breached the lower boundary of the previously anticipated support zone, as forecasted last week.
There's potential for a retracement to retest the indicated price level before a further decline, aligning with the bearish sentiment on the USD, really looking to see some more dollar weakness unfold this week.
Possible scenario for US indicesPossible scenario for a dull data next week for US30, NAS100 and US500
