INJ Breakdown in 1H | Bears in Control👀 Welcome to my Trading View Analysis and Trading Channel Here , we share the latest market analysis, trading signals, and key insights together .
Ready for smarter trades ? ⭐️
⚡️Today , we're going to analyze the INJ ( Injective) coin together on the daily timeframe and find triggers for our positions .
📉 INJ 1H Technical Breakdown
The INJ coin is currently exhibiting signs of weakness on the 1-hour timeframe, having broken below the key support level at $9.18 and continuing its downward trajectory. This movement indicates a shift in market sentiment towards bearishness.
Binance
🧭 Trend & Indicators:
Downtrend Formation: A clear downtrend is forming, characterized by lower lows and lower highs, suggesting sustained selling pressure.
Increasing Selling Volume: There's a noticeable increase in selling volume, reinforcing the bearish momentum.
Binance
RSI Approaching Oversold: The Relative Strength Index (RSI) is nearing the oversold zone, indicating potential for further downside but also cautioning traders of possible short-term reversals.
Price Below SMAs: The price is closing below all three Simple Moving Averages (SMAs), signaling a continuation of the bearish structure.
EMA 50 Rejection: A sharp rejection occurred after a retest of the EMA 50, followed by a strong red candle — a classic sign of bearish strength.
📰 Recent Developments:
Price Decline: Over the past week, INJ's price has declined by approximately 8.3%, reflecting broader market corrections.
CoinGecko
Market Activity: Despite the price drop, Injective's trading volume remains robust, indicating continued investor interest and market activity.
CoinCarp
+15
crypto.news
+15
Coinbase
+15
Technical Patterns: Analysts have observed that INJ has broken below the $10.25–$10.30 support zone, triggering a bearish continuation pattern.
Binance
📌 Trading Insight:
With proper risk management and a solid trading plan, this setup offers a potential short opportunity. The technical signals are aligned, and momentum appears to favor sellers for now.
🎯 Watch for continuation patterns or lower time frame triggers to enter with precision.
I love you all so much . 👀
don't forget about capital management and risk management .
Be careful with your positions . 🥇
Inj

INJUSDT Potential UpsidesHey Traders, in today's trading session we are monitoring INJUSDT for a buying opportunity around 9.50 zone, INJUSDT is trading in an uptrend and currently is in a correction phase in which it is approaching the trend at 9.50 support and resistance area.
Trade safe, Joe.

#INJ/USDT#INJ
The price is moving within a descending channel on the 1-hour frame, adhering well to it, and is heading for a strong breakout and retest.
We are seeing a rebound from the lower boundary of the descending channel, which is support at 9.54.
We have a downtrend on the RSI indicator that is about to be broken and retested, supporting the upward trend.
We are looking for stability above the 100 moving average.
Entry price: 10.00
First target: 10.32
Second target: 10.64
Third target: 11.00

INJUSDT 1D AnalysisINJ ~ 1D Analysis
#INJ Buy after successfully penetrating this resistant line with a short -term target of at least 10%+.

INJ Is Nearing An Important SupportHey Traders, in today's trading session we are monitoring INJ/USDT for a buying opportunity around 9.90 zone, INJ/USDT is trading in an uptrend and currently is in a correction phase in which it is approaching the trend at 9.90 support and resistance area.
Trade safe, Joe.

#INJ/USDT#INJ
The price is moving within a descending channel on the 1-hour frame, adhering well to it, and is heading for a strong breakout and retest.
We are experiencing a rebound from the lower boundary of the descending channel, which is support at 7.50.
We are experiencing a downtrend on the RSI indicator that is about to break and retest, supporting the upward trend.
We are looking for stability above the 100 Moving Average.
Entry price: 7.71
First target: 7.92
Second target: 8.42
Third target: 8.90

#INJ/USDT#INJ
The price is moving within a descending channel on the 1-hour frame, adhering well to it, and is heading for a strong breakout and retest.
We are seeing a bounce from the lower boundary of the descending channel, which is support at 8.25.
We have a downtrend on the RSI indicator that is about to be broken and retested, which supports the upward trend.
We are looking for stability above the 100 Moving Average.
Entry price: 8.58
First target: 8.80
Second target: 9.03
Third target: 9.31

inj breaks long consolidation 30$ coming injective one the solid utilty token recently breaks long descending channel consolidation in result expecting strong recovery in coming weeks expecting move towards 30$ in coming weeks

$INJ: Preparing for a Possible Impulsive Move UpCRYPTOCAP:INJ – Setting Up for a Potential Impulsive Move
After a sharp correction, CRYPTOCAP:INJ may be preparing for a strong rebound.
In a previous idea, I forecasted a bottom at $8.5 — and it dipped even lower to $7, fully retracing last year's pump.
The price broke below the bearish flag after a clear bearish divergence at the top. It also sliced through my green buy zone and is now sitting right on a critical support level at $8.40.
🚀 Signs of recovery are starting to show:
🔹 MACD is climbing and approaching the median line — a bullish crossover could ignite an impulsive rally.
🔹 Price is stabilizing above the key $8.40 support.
🔹 RSI is low and consolidating — signaling potential upside.
🔹 Volume is quiet — often a precursor to strong moves.
The target is to re-integrate the green liquidity zone, to prepare another explosive pump.
📅 Reminder: around this time last year, CRYPTOCAP:INJ pulled off a 4x rally. While past performance doesn't guarantee future results, the setup looks promising.
🧠 DYOR | This is not financial advice.
#INJ #CryptoAnalysis #Altcoins #TechnicalAnalysis #MACD #CryptoMarket #BreakoutSetup #DYOR

INJUSDT | One of Today’s Top Volume GainersINJUSDT has been catching attention again, leading the pack in trading volume today. We already shared an analysis earlier, and now there’s a fresh opportunity: the red box marked on your chart is another high‑probability zone to consider for shorts.
🔴 Short Setup at the Red Box
• Observe how price approaches the red box and look for signs of exhaustion on lower time frames.
• Wait for a clean breakdown in structure, confirmed by CDV divergence and rising selling volume. That’s your trigger to enter a short position.
• Place your stop just above the red box to keep risk defined and manageable.
🟢 What Could Flip This Bias
If INJ breaks above the red box with conviction – strong volume and a successful retest as support – I will shift gears and look for longs instead. No breakout, no long bias.
✨ Why You Want to Follow This
These resistance levels aren’t random. They come from years of watching market behavior and fine‑tuning entries that work. Most traders chase every spike and get caught. You’re trading with clear signals and confirmations – and that makes all the difference.
I will not insist on my short idea. If the levels suddenly break upwards and do not give a downward break on the low time frame, I will not evaluate it. If they break upwards with volume and give a retest, I will look long.
📌I keep my charts clean and simple because I believe clarity leads to better decisions.
📌My approach is built on years of experience and a solid track record. I don’t claim to know it all but I’m confident in my ability to spot high-probability setups.
📌If you would like to learn how to use the heatmap, cumulative volume delta and volume footprint techniques that I use below to determine very accurate demand regions, you can send me a private message. I help anyone who wants it completely free of charge.
🔑I have a long list of my proven technique below:
🎯 ZENUSDT.P: Patience & Profitability | %230 Reaction from the Sniper Entry
🐶 DOGEUSDT.P: Next Move
🎨 RENDERUSDT.P: Opportunity of the Month
💎 ETHUSDT.P: Where to Retrace
🟢 BNBUSDT.P: Potential Surge
📊 BTC Dominance: Reaction Zone
🌊 WAVESUSDT.P: Demand Zone Potential
🟣 UNIUSDT.P: Long-Term Trade
🔵 XRPUSDT.P: Entry Zones
🔗 LINKUSDT.P: Follow The River
📈 BTCUSDT.P: Two Key Demand Zones
🟩 POLUSDT: Bullish Momentum
🌟 PENDLEUSDT.P: Where Opportunity Meets Precision
🔥 BTCUSDT.P: Liquidation of Highly Leveraged Longs
🌊 SOLUSDT.P: SOL's Dip - Your Opportunity
🐸 1000PEPEUSDT.P: Prime Bounce Zone Unlocked
🚀 ETHUSDT.P: Set to Explode - Don't Miss This Game Changer
🤖 IQUSDT: Smart Plan
⚡️ PONDUSDT: A Trade Not Taken Is Better Than a Losing One
💼 STMXUSDT: 2 Buying Areas
🐢 TURBOUSDT: Buy Zones and Buyer Presence
🌍 ICPUSDT.P: Massive Upside Potential | Check the Trade Update For Seeing Results
🟠 IDEXUSDT: Spot Buy Area | %26 Profit if You Trade with MSB
📌 USUALUSDT: Buyers Are Active + %70 Profit in Total
🌟 FORTHUSDT: Sniper Entry +%26 Reaction
🐳 QKCUSDT: Sniper Entry +%57 Reaction
📊 BTC.D: Retest of Key Area Highly Likely
📊 XNOUSDT %80 Reaction with a Simple Blue Box!
📊 BELUSDT Amazing %120 Reaction!
I stopped adding to the list because it's kinda tiring to add 5-10 charts in every move but you can check my profile and see that it goes on..

TradeCityPro | INJ: Key Triggers Amid Downtrend and Volume Shift👋 Welcome to TradeCity Pro!
In this analysis, I want to review the INJ coin for you—one of the attractive crypto networks, which with a market cap of $783 million, is ranked 73rd on CoinMarketCap.
📅 Daily Time Frame
In the daily time frame, as you can see, we have a downtrend that started after the price was rejected from the 25.43 top, and after breaking 16.04, the main bearish leg of the price began and dropped down to the 6.94 zone.
🔽 This bearish move has followed a trendline that we can also observe in most altcoins. Currently, market volume is decreasing, and it can be said that the price is diverging from the volume—and if this divergence is activated, the price will reverse trend.
✔️ The first trigger for a trend reversal is the break of the trendline. Given the volume divergence, if this happens and the trendline breaks, we can consider the break of the 8.96 trigger as the main reversal confirmation.
📈 If the price stabilizes above the 8.96 zone, it can move upward and start an uptrend. The next resistance for the price would be 16.04. However, for a spot buy, the 25.43 trigger is the most important one, which the price is still far from.
💥 On the other hand, if the 6.94 zone is broken, the price will move downward and may start another bearish leg. But an important point is that there’s a very strong support at the 5.65 zone, and if the price moves downward, it may be supported by this area—so it's better to confirm the next bearish leg with a break of 5.65.
⏳ 4-Hour Time Frame
Let’s move on to the 4-hour time frame to examine suitable triggers for futures positions.
🧩 As you can see in the 4-hour time frame, there’s a descending channel in which the price is moving, and it is currently near the top of the channel.
🔼 For a long position, if the channel top is broken, we can enter a position with the activation of the 8.51 trigger. If the price tests this zone multiple times, the position can become much more reliable, and the possibility of a sharp bullish move increases.
📊 The important point is that buying volume should increase as the price moves toward 8.51, because for a trend reversal, volume must converge with price.
📉 For a short position, the first trigger is the break of the 7.61 zone, which is a good trigger because the price is being rejected from the channel top, and there is a possibility that the price moves toward the midline or bottom of the channel.
🎲 The main trigger for the short position is the break of 6.94, which is a very important low, and breaking this zone can lead to a sharp move down to the 5.65 zone.
📝 Final Thoughts
This analysis reflects our opinions and is not financial advice.
Share your thoughts in the comments, and don’t forget to share this analysis with your friends! ❤️

INJ Analysis: 300% Profit Potential (1W)AI Sector Symbol Analysis: 300% Potential
The AI sector symbol is currently undergoing a significant correction, and it seems to be forming a diametric pattern, with the price now in Wave D. This wave could potentially end within the green buy zone, after which we expect the price to transition into Wave E.
It's important to note that this analysis is based on a weekly timeframe, meaning it will take time to unfold. Additionally, the entry zone is quite large, so a gradual REBUY strategy is recommended to manage risk effectively.
Target Levels are clearly marked on the chart, offering clear points of interest for traders.
However, be cautious: A weekly candle close below the invalidation level will invalidate this setup, so always monitor closely.
For risk management, please don't forget stop loss and capital management
When we reach the first target, save some profit and then change the stop to entry
Comment if you have any questions
Thank You

Injective Easy 584% Bullish Wave Now PossibleInjective is now ready after a very long period of correction. The peak for this pair happened in March 2024 and in December 2024 there was no higher high, instead, a classic lower high and now a complete ABC correction. This ABC correction comes after a perfect, long-term, 1,2,3,4,5 bullish impulse.
After this correction ends will be the start of a new bullish impulse which will lead to a new All-Time High. The 584% target on the chart is an easy one. The 209% is super easy and can be approached by all types of market participants. This is a strong project.
There is really high volume as prices move to "baseline level." This is a support zone that was created after a long consolidation in 2023. Almost 7 months of consolidation. Sideways, and now this same range that worked as resistance is working as support. Support is confirmed because volume is rising, a very strong rise. INJUSDT is about to grow.
The entire Injective bullish wave, with a bottom in 2022 and a peak in 2024 amounted to 4,631% total growth. This is perfect and the market is ready now for a new round of growth.
Feel free to accumulate; buy and hold.
Namaste.

#INJ/USDT#INJ
The price is moving within a descending channel on the 1-hour frame, adhering well to it, and is heading towards a strong breakout and retest.
We are experiencing a rebound from the lower boundary of the descending channel, which is support at 7.20.
We are experiencing a downtrend on the RSI indicator, which is about to break and retest, supporting the upward trend.
We are heading for stability above the 100 Moving Average.
Entry price: 7.20
First target: 7.70
Second target: 8.15
Third target: 8.64


INJ | ALTCOINS | Bottom Likely CLOSEIn the previous cycle, INJ made a near full retracement after the bullish cycle.
This would put us round here, to which we are already fairly close:
To make it a little easier to reference, I'll use the Elliot wave tool (although these are not Elliot waves).
In short, the bottom is likely very close for INJ - but accumulation / sideways phase may take another while.
_______________________
BINANCE:INJUSDT

Trading opportunity for INJUSDTBased on technical factors there is a Buy position in :
📊 INJUSDT
🔵 Buy Now
🪫Stop loss 8.75
🔋Target 12.50
📏 R/R 2,5
💸RISK : 1%
We hope it is profitable for you ❤️
Please support our activity with your likes👍 and comments📝

INJUSDT 1WINJ ~ 1W Analysis
#INJ Test this support, buy gradually from here with a short -term target of at least 20%+.

Breaking: Injective Protocol ($INJ) Set For a Comeback The first and only blockchain built for finance that is open, interoperable layer-one blockchain powering next-generation finance applications, including DeFi, RWAs, AI, decentralized exchanges, prediction markets, lending protocols, and more, is set for a comeback with a speculated 140% surge in sight.
Weeks after Breaking down from a rising wedge which is a bearish pattern, CRYPTOCAP:INJ has shown signs of a reversal. With the Relative Strength Index (RSI) already oversold at 28 CRYPTOCAP:INJ is gearing up for a massive comeback with the All-time high of $52.75 a move to the $19 pivot point could spark the resurgence to the recent ATH attained.
Similarly, with growing momentum and the asset trading below key moving averages (MA) CRYPTOCAP:INJ is currently up by 3.41%. The Injective Protocol is becoming an asset worth watching.
Injective Price Live Data
The live Injective price today is $8.77 USD with a 24-hour trading volume of $166,682,991 USD. Injective is down 7.91% in the last 24 hours, with a live market cap of $867,892,886 USD. It has a circulating supply of 98,970,935 INJ coins and the max. supply is not available.

$INJ next support is at $8.45I don’t have good news.
I remember buying CRYPTOCAP:INJ last June and selling it at a loss in December. Looking back, I’m glad I did—if I had held, my losses would now be over 80%, which is catastrophic.
I’ve spent some time in the Dojo Trading Telegram chat, talking with some great people. No doubt, there are real believers and long-time holders there. I feel for them, seeing how bad things are going now.
📉 The chart shows the next support at $8.5—I can’t believe I’m writing this, but it is what it is. Hopefully, that will be the bottom.
In another idea (check my profile), I predicted a bearish crypto market until May 2025, followed by two months of relief with a pump and a mini altseason.
That said, nothing is certain in this toxic environment filled with war tensions, tariffs, and a looming recession.
I’m sticking to my view that May and June will be bullish, purely based on indicators and charts.
The dump is global. A few new coins are hyped for a couple of weeks, but the entire crypto market has been bleeding since June 2024. The brief relief in December? Completely erased—and worse.
Prepare for the worst. The storm will end in May. Go fishing, touch some grass. CRYPTOCAP:INJ and NASDAQ:ATOM are solid projects, but right now, only whale stakers are profiting, while retail investors are getting slaughtered.
DYOR.

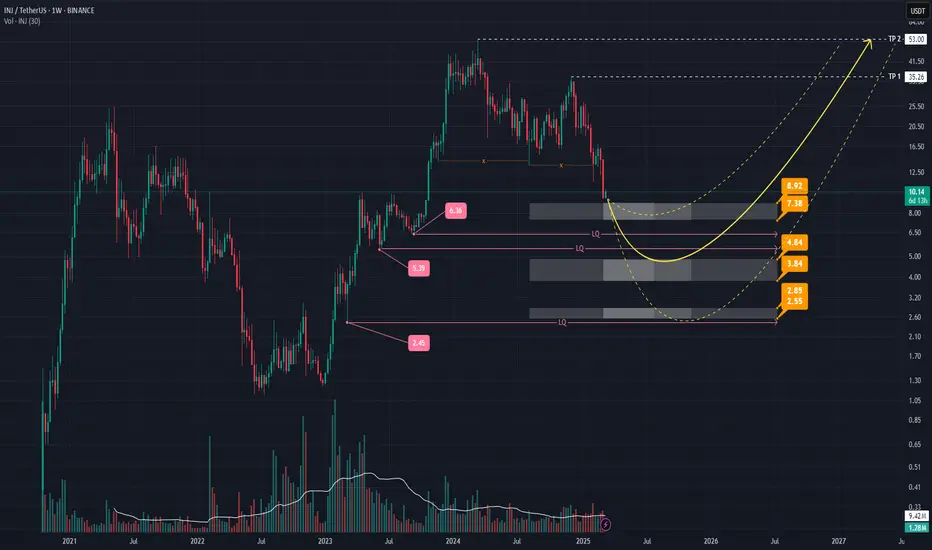
INJ Price Analysis: Key Zones & Reversal ScenariosHey everyone! 👋
Let's dive into this price chart and see what’s going on with INJ.
Overview:
We’re looking at INJ on a weekly timeframe , and there are some interesting levels to watch. The chart shows **three key zones** where price reactions might happen, marked with price levels. There are also areas of liquidity (LQ) , where the market might make a move before reversing direction.
Potential Reversal Scenarios:
Three possible price movements are shown with yellow arrows , each representing a different way the price might reverse. The second arrow is the primary scenario, suggesting that after sweeping at least one liquidity level, the price could bounce back up—especially if there’s solid volume and a strong candlestick pattern.
- Main Support Zone (3.84 - 4.84): This area is the most important. If the price reaches this zone and shows good volume and a strong candlestick pattern, it could signal a trend change.
- Other Support Zones (2.55 - 2.85 and 7.38 - 8.92): These are additional key levels. A drop below these could change the outlook.
Take Profit (TP) Targets:
TP levels are marked on the chart. If the price reverses as expected, these targets may be reached.
Final Thoughts:
Nothing in crypto is guaranteed! Always look for confirmations like volume and candlestick patterns before making decisions. Stay informed, trade smart, and always do your own research! 📊💡
INJ PUMP LOADINGINJ is at key level which was acting as resistance and after breakout now it has become support level. It is also in weekly FVG. Expecting reversal from here, upside key level marked if we close above that level then we will see huge pump in INJ as we witnessed in early 2024.

INJ Long OpportunityMarket Context:
INJ has retraced into a strong support zone, presenting a high-probability long trade for a potential rebound.
Primary Trade Setup:
Entry: $13.00 - $12.00
Take Profit Targets:
$16.00
$18.00
Stop Loss: Below $11.30
Secondary Trade Setup (Deeper Support):
Entry: $10.00 - $9.50
Take Profit: Adjust based on price action
Stop Loss: Below $9.00
This setup targets a bounce from major support, with the potential for a stronger rally if bullish momentum returns. 🚀
