XRP - Whales will start buying XRP here. But first a 55% DROP!
This head and shoulders pattern on the weekly chart is almost ready for a breakdown, so this is your last chance to sell XRP and save your money!
On the other side, it's a great opportunity to short XRP on the futures market, as I already did at the top of the right shoulder (see my previous idea)!
But be careful; XRP is the beast, and I know XRP very well, more than most other people. Overlaps between waves are common, and movements can be difficult at times, but they are doable.
If you ask me when moon for XRP? I can tell you that after we hit 0,1 - 0,09 USDT, the whales will start buying massively.
The whales are going to send XRP to the moon! And I am telling you it will be massive; you don't want to miss it, so hit the LIKE if you think I am right.
But let's be realistic; this is the biggest bear market in history, and it's better to buy XRP at a cheaper price.
XRP is stuck in this parallel channel on the weekly chart, and the bears are in full control. There are no signs of a trend reversal at all. No buying alerts from whales
As per my Elliott Wave analysis, this downtrend is so incomplete. We are in the middle of the bearish trend that started on April 13, 2021. But we are basically finishing the downtrend that started in 2018.
It can take another 1-2 years for XRP to bottom out. XRP is ranked 6 on CoinGecko, which is pretty impressive.
Transactions on XRP are extremely fast and extremely cheap, so it's a pleasure to use it for payments. But it's not a digital gold nor a store of value and will never be, this can only be Bitcoin.
Thank you, and for more ideas, hit "Like" and "Follow"!
Inverse Head and Shoulders

FTM Could be long Due to Pure PA With Proper RMI Have draw A chart of FTM/USDTPERP and during analysis found to price action scenario with bullish moment.
First It's Inverse H&S Pattern and Second Bullish flag.
Both Patterns are pure bullish but seeing a market now days totally sideways or ranging so if I trade this pair so I'm calculate Risk Management with safe side Margin %age. Because everyne knows trading is risk so when market gave pattern then Should be pick a opportunity.

HUGE SPY Call(+100%)This one was HUGEEEEE. I've noticed one thing now. TRADE INVERSE HEAD AND SHOULDERS. I mean my goodness, we traded it 3 timtes this week or around there, and didn't lose once. Opposite of that on every play we had +50% or more.
Entry:
INVERSE HEAD AND SHOULDERS(Best strategy ever)
5 min -
Inverse head and shoulders
RSI above 50
1 min -
HUGE inverse head and shoulders
Got the trade off pullback of right shoulders(marked the zone green from top of body to low of body and took the trade once it got in there).
Instead of buying as soon as it got in the zone, I bought when price closed above 14 EMA
BT cloud flip
Held trendline

Fractalic inverse H&S (and double bottoms) The title says it all.
The volume also contradicts the bearish trend and confirms the subsequent bullish trend/correction.
Hope this helps you in your market analysis!

MAHINDCIEInvestmentPick
MAHINDCIE
Inverse Head & Shoulders Pattern
Already gave buy @ 263_267 & active from 267. Now breaking out of Inverse Head & Shoulders Pattern. MCB above 316 will be confirmation of break out & its pattern tgts - 460 / 560.
Long-Term Tgts - 650 / 780 / 990

XRP Inverse Head & Shoulders Pattern Forming - 4Hr ChartA different perspective for my same call to .44cents 0.618 golden ratio fib extension.
Inverse Head & Shoulders Pattern Forming on the 4Hr Chart.
I think we are due for a reversal very soon...

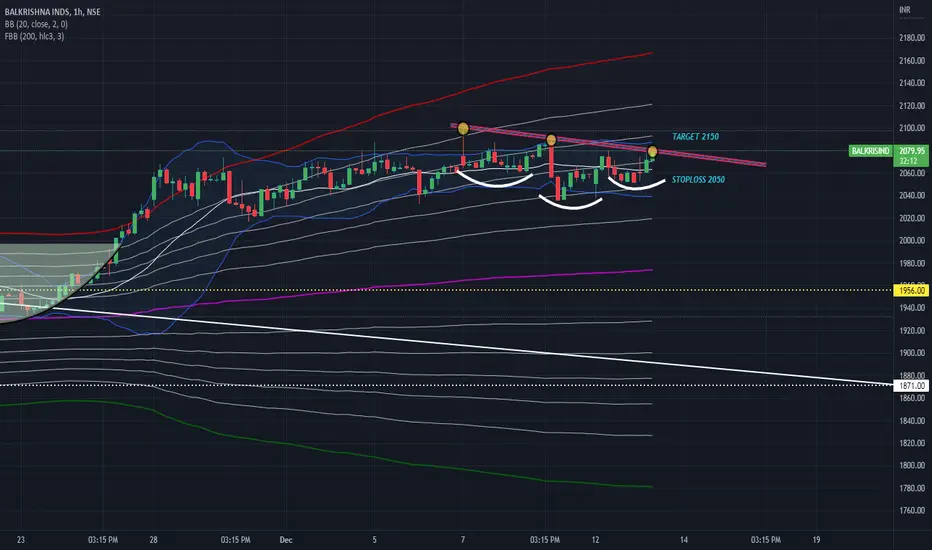
BalkrishnaBalkrishna made triangle & inverse H&S pattern on hourly charts with decent volumes & is on the verge of breaking neckline.
Could be bought with mentioned stoploss & targets.
Silver appears to be triggering an inverse head & shouldersOne of the bigger green candlesticks we’ve seen on the daily chart for silver in awhile…would not be surprised if this breakout takes us to the $22 measured move target. The 1day 200 ma(in blue) will be waiting in that zone to likely provide resistance. *Not financial advice*

GE Weekly View - Potential Inverse Head and Shouldersmost of my notes and thoughts are on the chart
- 3 major moves to the down side, with what appears to be a iHnS potential taking shape
--Need to see much more volume (buying) to confirm with better probability that this pattern pans out
---low volume with price increase would indicate weakness imho
- IF, this were a legitimate inverse HnS and the pattern completed:
--Target of ~$300.00 as indicated by blue horizontal trendline
--*a more conservative target of ~$195 could be made and the higher target could fail due to resistance at yellow trendline
**(marked by the yellow X and the 2nd yellow X near $195)
*Note the time frame of this trade....several years to see in totality. This is something to just keep an eye on for longer term investment
this is not financial advice, simply notes on what i see and should be used for observation/education only

AUDUSDlooking for sell entry on AUDUSD.
as there is formation of head and shoulder pattern .. on higher time frame ...

TVSMOTORTVSmotor made head n shoulder pattern on an hourly charts with decent volumes & broke above its neckline.
Could be bought with mentioned stoploss & target.

inverse head & shoulder patternthis a inverse head and shoulder pattern in 1day time frame
stop loss is important in

GOING LONG IN XAGUSDI have noticed the nature of the chart from some previous data that is listed below:
1. The price action goes down in the range of 20 to 30%
2. The price action goes up in the range of 25 to 30%
3. The price action goes in the range of 50-80 days
Going to take a long position due to some reasons as listed below:
1. Trend is Bullish
2. Recently form an inverse head and shoulder which indicates it will go up
3. Divergence line in the RSI is in sync with the chart in the upward direction
4. Strong Green candles at the Higher Low
5. Retest strong 0.236 fib support level
6. Recently head and shoulder gives us a bottom which is a good support if we look back at the 2020 chart

Inverse H&S pattern on AUDUSDTaken this inverse head and shoulders pattern and hit first targets at 0.6779
Look to take 2nd targets at the high 0.6833
Already in a risk free trade lets see how this one plays out

EUR/HUF - inverse Head&Shoulders - Long - 1-3wA potential inverse head and shoulders pattern on the chart (not the prettiest, but whatever) and on the RSI as a possible sign of a reversal.
Let's see if price can rise above the neckline around 415 HUF, if so:
Buy in: above ~415 HUF
TP: 433 HUF
Time interval ~1-3weeks
Fundamental background:
The European Commission has concluded that Budapest has not sufficiently fulfilled its reform promises in the fight against corruption, and will recommend to member states to freeze €7.5 billion from three cohesion programs at its meeting next Wednesday, according to the conservative daily Frankfurter Allgemeine Zeitung. ( 23.11.2022-13:14)
If the Council adopts the Commission's proposals, it would mean 65 % of the funds for three Hungarian operational programs would be withdrawn from Hungary. This would mean blocking €7.5 billion, or around 3,000 billion HUF, which is around the third of the cohesion funding for the budget period up to 2027.
HUF weakened against the euro on the news.
source: www.faz.net

Quick Update BTC/USDT 2hrQuick Update BTC/USDT 2hr
#BTC/USDT 2hr ANALYSIS
BTC is consolidating in a bullish pennant between the
narrow range of $16,812 to $17,120. A solid breakout of the bullish pennant
and a break above the horizontal resistance will give a bullish confirmation
for a target of $1792.
Also Trading above 200EMA

SOLUSD Target Price 13.00Price closed below trend line. Now wait for a bearish price action signal. Enter a short position after a bearish price action signal forms.

$TSLA - IS IT H&S OR A BULL FLAG?Hi All,
TESLA is possibly forming a bull flag or in the process of forming an inverse H&S pattern on H4.
If it is the bull flag pattern, would expect a move to orange target line (around $214) after the break out.
If it is inverse H&S pattern, would expect a move to target 2 (about $240) which coincides with 0.5 FIB level if this setup plays out. Would wait until neckline breaks after a pull back to get into a position & sell about 30% of the position at target 1 to secure some profit. Target 3 is far overreach but still possible due to the prospect of a gap fill before next leg down. A strong price movement above neckline or a move below $166 would invalidate inverse H&S setup.
J Powell seemed less hawkish than his previous appearances & the year end rally for exec bonuses might make these plays possible. Considering these set ups as short term trade opportunities but have a bearish outlook for mid to long term.
* This is NOT a financial advice. Please do your own DD.
Thank you for your time and support.

GOING LONG IN NZDUSDI am taking a long position in NZDUSD due to the formation of an inverse head and shoulder pattern as we saw in the chart it also broke the resistance trend line as well as break the neckline so we have confirmation of the pump equal to the length from the head to the neckline
The Head and shoulder is a reversal pattern so it can change the trend also from bullish to bearish after retesting the height as we expect it to touch
Let's see what happens
Entry: 0.63030
SL: 0.62629
TP: 0.63390
Lots: 0.4

BYBIT CEO believes Bitcoin will fall below $10,000 USD!
I agree with Ben Zhou on his opinion about 4-digit Bitcoin!
He thinks that we are probably going to see more bombs coming in the next few months (liquidations of exchanges, coins, or other big players).
The CEO of Bybit has a lot of insider information about traders on his exchange. For example, he can see where the liquidity is and where people have their stop-loss orders.
"Everything in crypto happens very fast; I believe a 6-month or so of this downtrend before an uptrend again," he said in his next statement.
What do you think about it? Do you agree with Ben or not? Let me know in the comment section right now!
You can watch a full interview with Ben Zhou on the Moon YouTube channel if you are interested in his thoughts.
From my perspective, there are no signs of a trend reversal. As you can see on the chart, Bitcoin is pretty much drowning.
I believe the bottom of Bitcoin will be between 6500 and 10300 USD!
For more ideas, hit "Like" and "Follow"!
Bybit is currently the #2 exchange on CoinMarketCap in the section "Derivatives."

USDJPY LongThe currency shows strong confluence of bullish trend reversal from ABCD harmonics pattern along with formation of a nice inverted head and shoulders pattern to supplement the bullish flow.
Please note: Tomorrow's Fed announcements might change the probabilities.

IEX LONGiex form beautiful setup.
chart looking good to go for long investment
our system given buy triggered.our members holding position with sl
all levels shared for education purpose only.we are not sebi registered

Bitcoin - Cheat sheet (road to 3k, levels)
Everyone will call you a cheater for these levels because you can very well predict massive short-term bounces! I will never give you a zone. I will give you levels that are exact to the dollar!
You can use these levels if you are a swing or intra-day trader, but also if you are an investor and you want to buy Bitcoin cheap. These levels are for everyone!
I expect a massive bounce from 10254 USD. You can use this level for a 30% - 50% profit with a stop loss of 8700 USD. You can be sure that I will be a buyer at this level. I don't want to miss this opportunity.
The question is, how long do we have to wait for prices to reach these levels? It doesn't matter; it can be this year, next year, or even in a few years. The sooner the better because you probably do not want Bitcoin to be stuck in some range between 14k and 20k for another year, but it's possible.
I believe 6435 is very likely if bitcoin fails to hold the 0.618 FIB. A simple pattern for Bitcoin is: if BTC fails to hold the 10254 area, then 6435 is the next support. If BTC fails to hold the 6435 area, then 3516 is the next support. If Bitcoin fails to hold 3516, then we can see a huge capitulation wick below 3000 with strong buying activity from whales. If BTC fails to hold 3000, then sorry, you have been scammed, and maybe BSV is the real Bitcoin. But I don't want to speculate on this topic of BTC vs. BSV at this moment.
The previous all-time high, set in 2017, is now extremely powerful: 19798. We can go here in the short term before continuing in the dump. So do not fall for any fake pumps. The DXY index will go much higher after a correction.
Many stop-loss orders have been placed below the previous swing low: 9825. I believe the market is going to wipe out all orders below this level.
I wish you massive profits at these levels! I don't want to wish you good luck because trading is not about luck.
19798: 2017 ATH resistance (major)
12468: Start of the volume area high (VAH) + swing high (minor)
10254: 0.618 LOG Fibonacci retracement (major)
9343: Point of Control (POC) + GAP (major)
7293: GAP (minor)
6435: POC of the previous triangle + swing low (major)
5303: Volume profile node + triangle 4h POC (minor)
3782: POC of the previous triangle + swing low: (minor)
3156: Ultimate bottom of the impulse wave: (major)
