NEAR inverted head and shoulders#NEAR/USDT
$NEAR shaped an inverted head and shoulders pattern.
🐮 if price hold the previous low at $4.088, the right shoulder is completed and price can head up to break out the neck line and rise as high as head.
🐻🐮 I think price can have another leg down to make the low of right shoulder around $3.9 which is around parallel trend line of neckline, then increase to complete the H&S pattern.
Inverse Head and Shoulders

Quant testing the top trendline of the 1day symmetrical triangleWe can see that priceaction is currently attempting to both test the top trendline of the symmetrical triangle (in chartreuse) as well as trying to climb back above the 1 day 50ma(in orange). If price action can flip the 1 day 50ma back to solidified support then it can validate the bullish breakout from this symmetrical triangle. The breakout target from that symmetrical triangle will take price action far above this white line which is actually the neckline of an even bigger inverse head and shoulders pattern. If we are to hit 100% of the breakout target for the triangle ($165), this will greatly increase the probability of it also triggering the breakout of the inverse head and shoulders pattern as well which can send it considerably higher afterwards($224). Of course for now the 1 day 50ma is still resistance so we want to see a couple daily candle closes above that and any confirmation candles after that that retest it, testing it as strong support. Flipping tat 1day 50ma back to strong support will also confirm that the golden cross that recently happened will be sustained instead of flipping back into a deathcross and confirming a golden cross fake out. *not financial advice*

GBPUSD LongOANDA:GBPUSD
GBPUSD failed to create a new lower low, forming a reverse head and shoulder pattern.
Should price break above previous lower high, it will give us a bullish setup.

Ethbtc currently above inv h&s neckline.No confirmation yet but it’s looking quite bullish *not financial advice*

AMD Ppotential inverse head and shoulder Potential inverse head and shoulder
MA 50D Support at bottom

$SPY $SPX 5 Reasons to be Bullish vs 5 Reasons to be BearishBULL
1. SPY had an incredible bounce yesterday printing a bullish hammer at the $390 level which is a huge area of support. Inverse Head & Shoulder is still in play.
2. The RSI has created a bullish divergence (might be temporary - see bearish view).
3. MACD has started curling up after the big corrective decline.
4. Stoch RSI is and has been negative (oversold) for days.
5. The chance of 75bps (interest rate hike) announced at the next meeting is already mostly priced in as the FED gave a hawkish speech at Jackson Hole.
BEAR
1. RSI has not reached oversold territory on the daily (a double bottom could resolve that).
2. The weekly RSI was over-bought and has already began making its way down.
3. POWELL is actively trying to bring the markets lower.
4. Many gaps to the downside.
5. 50MA/100MA are squeezing on the daily - indicating volatility incoming, which also could be a bullish move.
Overall - bullish until proven support is broken.

Litecoin LTC - A new bull market started! | Elliott Wave
Great news for all Litecoin hodlers and traders! As per my technical analysis, this downtrend established in 2018 has finally finished!
This is the LTCBTC pair on the weekly timeframe. It means that it would be better to hold LTC instead of BTC. But there is no guarantee of the USDT value of your holdings.
Regarding my Elliott Wave analysis, a major impulse wave has been completed, and now I expect at least a retracement to the upside.
Also, we can spot very nice local inverse head and shoulders and falling wedge patterns that are very close to a breakout!
The falling wedge has been destroyed by the bulls successfully, and now we are waiting for the head and shoulders pattern.
The last weekly candle of the downtrend is an extremely strong bullish engulfing candle, which is absolutely great to see!
The BTC.D Dominance chart confirms this analysis (I will post the BTC.D technical analysis probably next week).
For more analysis, please hit "Like" and "Follow"!

IVZ - Right ShoulderInverted H&S pattern
The right shoulder arm is yet to form, this is when we can expect bullish results on this Weekly timeframe
It may even escape this huge horizontal range shown with the horizontal line
Very bullish pattern

SPY inverse h&s within greater patternSpecifically looking at yellow here, although purple, larger pattern in the making may play out as well with a large rally into the end of the year.
With media barking about how September is such a poor month for stocks + a lot now baked in post-Jackson hole meeting, I could see a large rally begin soon into SPY 420ish (5.82% move roughly). Potential of a higher move if it were to bust out of supply levels.
Looking for an easing up of selling pressure at these levels in the short term. Note the VIX in recent days has been net flat/red with a declining market.

Inverse Head & Shoulders : H4 - DPotential head and shoulders on the FRA40.
A lot of news and inflation flying around, this might also just drop?
I'm looking for the price to go back to the 6664 mark, might be a potential double top pattern.

Reversal Pattern for British PoundClear Inverse head and shoulders for GBPUSD. If british pound reverses then it can hit 1.7.

Inverse Head and Shoulders on BTC, Bitcoin might go up despiteVery simple, and early, but in no way guaranteed. Implied Move to about 24K on this, should it play out. 8-hour Time frame. Just throwing this out there, and playing it with very modest stakes (unlevered) small long. I know I have a previous elliot wave study pointing further down, but markets don't move in straight lines, and both ideas are valid until they aren't. I may be premature in drawing the head as I still see a lower move later today. I'm thinking 19600-500 is on deck in the short term. Next few hours will let us know I think.

HANA | Elliott Wave Projection | Inverse Head&ShouldersPrice action and chart pattern trading setup
> Elliott wave projection downtrend breakout with inverse head & shoulders pattern
> A possible wave B rebound targeting 0.382 - 0.5 retracement of A
> Entry @ H&S breakout SMA25W
> Target @ 0.382 retracement of Wave A / SMA50W zone +25%
> Stoploss @ right shoulder / SMA400W -12%
> Risk reward ratio: 2:1
Indicator:
> RSI Week bullish divergence, breakout MA line
> MACD Week golden cross below baseline
Always trade with affordable risk and respect your stoploss

WATCH $5LYBullish
- IHS
- Broke downward trend line
- Funds accumulating
- Healthy fundamentals
- Broke neckline
Entry idea
- For members
Stop loss depending on entry and risk appetite. But always set meaningful stops.
"All great achievements required time.”
Cheers and happy trading!

$NVDA Nvidia missed earnings! Next level of support has a gap.$NVDA has a very interesting chart.
Today NVIDIA announces earnings, missed. The price plunged a bit after hours but not as bad imo.
I see a solid accumulation/support near the $157-$161 level.
NVDA previously broke out of a falling wedge on July 15th, however, it didn't back test the break-out zone afterwards, holding the support level this week would set up a textbook INVERSE Head & Shoulder pattern with a first target/resistance near the $190 level. Closing above the $190 neckline would open the door to more possibilities such as filling the gaps above (marked in red) created in APRIL 2022.
Losing the $157 level would break it down to the low $140's setting up a possible double bottom pattern as a best case scenario. Gaming is a billion dollar industry and most of the crypto decline shock is priced in. NVIDIA is poised for continued upside in the coming years as we slowly enter the metaverse.


ADA bearish flag in short-term#ADA/USDT
$ADA shaped ascending channel and price is between the middle line and lower line.
🐻 this channel can act as a bearish flag pattern and possible drop price toward long-term support zone around $0.41 which is the same with the broken line of the falling wedge.
🐻🐮 if price holds the support zone then possible to head up again to shape an inverted head and shoulders.

Finolex cables keep on radarFINCABLES had given a very strong volume breakout from Inverted head and shoulders on 29th July. It had confluence with 200 DEMA breakout. It has been consolidating since 29th July in a tight range.
Once the stock breaks 445, it will move quickly to 475 levels.
Risk reward ratio at CMP is very attractive

GRTUSD GRAPH TOKEN - INVERSE H&S Spotted on the 4hr.Traders,
Spotted this inverse Head and Shoulders on the 4hr. If that neckline breaks to the upside Graph Token could finally escape this long-trending bullish descending wedge it has remained in for about one year!
Target for the 4hr trade is 11.5 cents.
LMK if you enter.
Best to you!
Stew

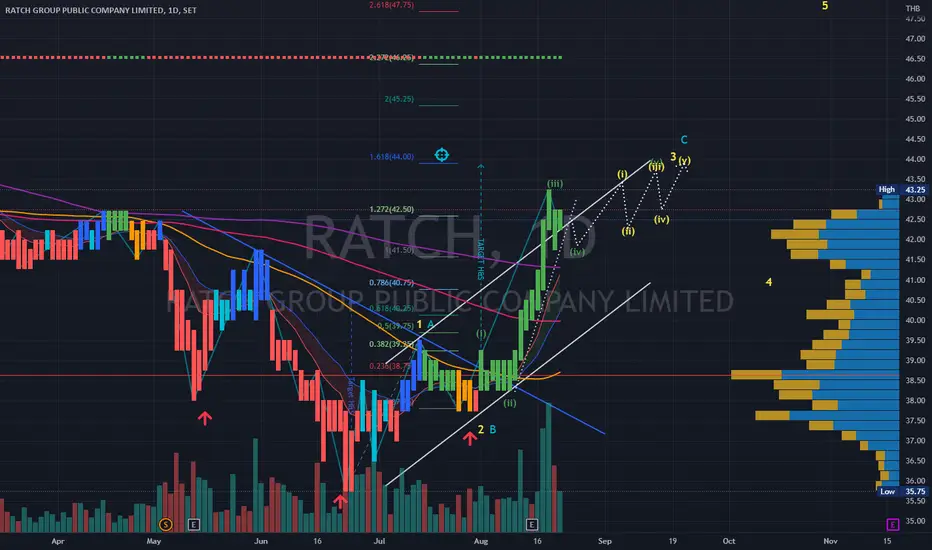
RATCH | Elliott Wave Analysis -Uptrend rising wedge projectionPrice action and chart pattern trading - take profit position
> Rising/Bearish Wedge false breakout wave iv correction
> Target Inverted Head & Shoulders 1.618 extension of wave 1 or A
> Recommend take some profit along upcoming wave (iii) of wave v of wave 3 or C should be the longest wave.
> Indicator: RSI / MACD should start showing bearish divergence during the next cycles
TRADE ALERT - BTC LONG 3XTraders,
Spotted this inverse Head and Shoulders on the 30 minute. I’m betting 3x it plays out. Target = 21,953. The rest of the data can be found on my spreadsheet.
R/R is 4/1
Stew

CRVInverted head & shoulders pattern in play here, and we are loaded in this coin. (my group) we been buying last 2-3 months.
$4 is only the beginning CRV will do some amazing moves IMO. One of my favorite coins.
And you ain't seen nothing yet IMO.

