#ETH: INVERTED H&S PATTERN! LOOKS BULLISH!!Hello everyone, if you like the idea, do not forget to support with a like and follow.
Welcome to this ETH update.
ETH looks good here. Forming an inverted head and shoulder pattern in 2hr time frame. Currently, it is in the process of forming the right shoulder. Once it breaks the neckline of the head&shoulder it will pump hard.
A strong support for ETH is at $1050
You can open a long position here with the SL of $1040
If you like this idea then do support it with like and follow.
Also, share your views in the comment section.
Thank You!
Inverse Head and Shoulders

Bitcoin reversal pattern? Inverse H&S on 4hr chartHowdy folks!
highlighting the formation of an inverse head and shoulders for a possible sign of a bitcoin reversal.
$24k needs to become support, $27k needs to be hit to continue going upwards n price and bring favour back towards the bulls
if price crabs at $20k then expect to see lower prices towards $12-13k area for the next most likely bounce area
can go either way here, have fun, play smart x


AZN - 50MA Inverse H&SAZN on this Monthly timeframe is extremely bullish
More interestingly though is the inverted H&S patterns that have formed a long this 50MA line
I have counted three in this post, all leading to a bullish result
More of a creative post

BTC: POSSIBLE SCENARIO! BULLISH!!Hello everyone, if you like the idea, do not forget to support with a like and follow.
Welcome to this quick BTC update.
BTC is forming an inverted head and shoulder-like pattern here which is generally a bullish pattern. Currently, it is in the process of forming the right shoulder and the important support here is $19,800-$20,200 level. I'm expecting a bounce from this zone.
Once BTC breaks the neckline of this inverted head and shoulder we can target for $26k-$27k level from here.
Invalidation level:- If it breaks and closes below $19.7k support then this inverted head and shoulder pattern becomes invalidated.
If you like this idea then do support it with like and follow.
Also, share your views in the comment section.
Thank You!

ZM - inverse Head & Shoulders in the making?I am watching to see if a breakup will materialise, and when it does, a high volume breakup will greatly improve the odds of this pattern succeeding.
This pattern is formed over 3.5 mths+ which is rather short (6 months or more prefered), meaning it could face more near term resistences on the way up. If it could go above 135 eventually then the coast will be clearer.
Disclaimer: Just my 2 cents and not a trade advice. Kindly do your own due diligence and trade according to your own risk tolerance and don't forget that money management is important! Take care and Good Luck!


GRTUSD: Inverted Head and Shoulders on 4 HourIf we are lucky we will see GRT atleast Rally up to the 200 SMA on the 4 Hour from here.

VIPS - inverted Head & ShouldersBullish argument for VIPS:
1. formation of inverted H&S
2. now above 200 days moving average
3. held above neckline and 200days MA for the past 2 wks
Less bullish:
volume is below average (would have prefered to see stronger volumes esp upon breakup)
Let's see if this inverted H&S will work out.
Disclaimer: Just my 2 cents and not a trade advice. Kindly do your own due diligence and trade according to your own risk tolerance and don't forget that money management is important! Take care and Good Luck!

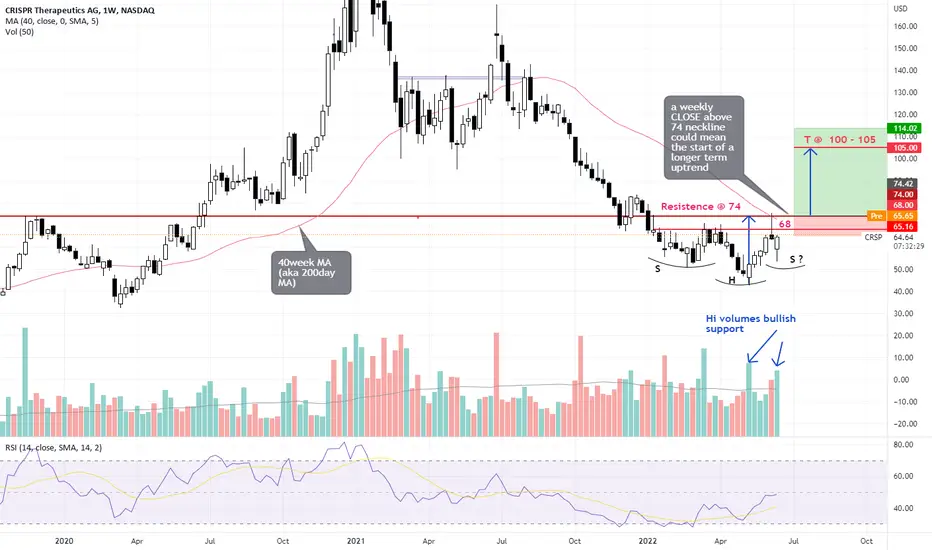
CRSP - bottoming in process?CRSP has been consolidating in what is potentially an inverted H&S pattern since hititng inot low on 12 May. Despite the overall market being extremely weak this week, CRSP dipped and quickly recovered forming a potentially bullish candle for this week.
If CRSP can have a weekly close above 68 then there could be grounds for more optimism. However, a weekly close above 74 (a longer term resistence and also the 200 days moving average) could up it's odds of sustaining a longer term uptrend.
We aren't at these levels yet so I'm just keeping a watch now.
p/s with overall US market being rather bearish right now, it is best to keep positions small and be ready to cut quickly if wrong.
Disclaimer: Just my 2 cents and not a trade advice. Kindly do your own due diligence and trade according to your own risk tolerance and don't forget that money management is important! Take care and Good Luck!

Nifty Making Inverted Head & ShoulderNifty making Inverted Head and Shoulder on Daily and hourly , closing above 17500 on daily will make the target to 19400 in comings weeks :)
Waiting for New life high soon.

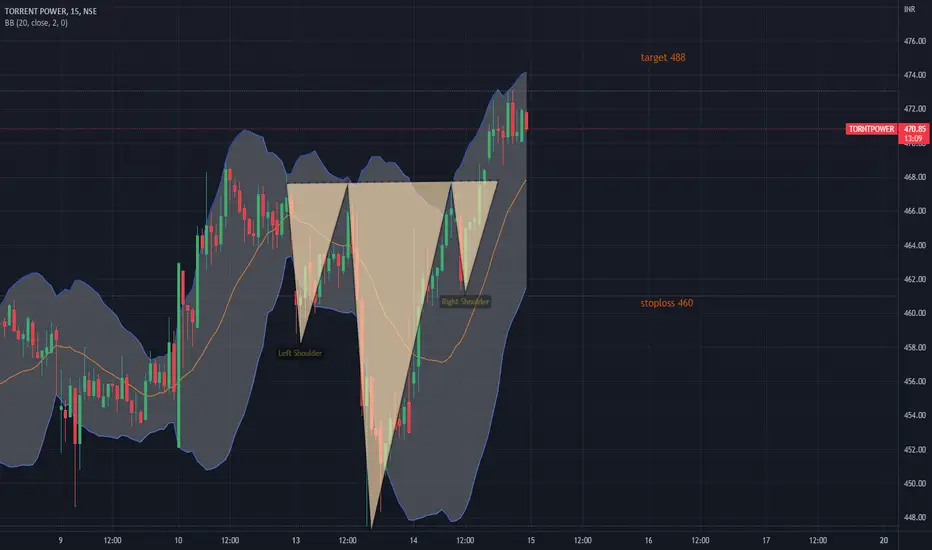
Torrent PowerTorrent Power made inverted head & shoulder on smaller time frames with good volumes.
Could be bought with mentioned stoploss & targets.
BTC - 4h - iHS idea23.04.2022 - 07:46
As long there is now LL, i think we see iHS.
When we see a LL, i think RED down line is next target.
When you want to long, this area is a good Option, but with SL or small Position to rebuy later low

TSLA IHSSeems like an inverted head and shoulders is forming on TSLA (1hr)
The left shoulder and pivot price being $680.20
A failure of that support to hold, we might retest lows at 615 (strong support, head) and 600 (psychological level)
If market bounces and we can form a right shoulder at $680 (rejection and support) we could push higher towards 785 (base)
I will be watching price tomorrow and next few sessions. I have no bias.

ALGO inverted head and shoulders#ALGO/USDT
$ALGO shaped inverted head and shoulders pattern and now try to break out from neck line.
🐮 breaking out from neck line will increase price to touch resistance zone between $0.47 and $0.49.

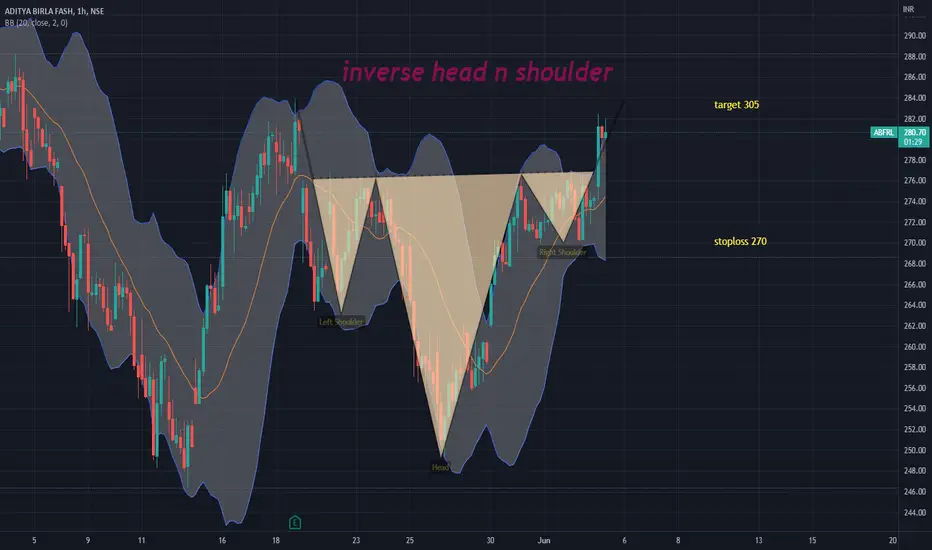
abfrlabfrl made inverse head n shoulder on an hourly charts with decent volumes.
could be bought with mentioned stoploss & targets.
$TRX > $BTC (MEGA BULL)Free bitcoins. Tell your friends. Not financial advice. #TheCryptocracy @dropaganda

XPRT Persistence Token Showing Inverse H&S Pattern FT 1.97Persistence Token XPRT is showing an inverse head and shoulders pattern on the 4hr. right now. With Bitcoin dominance BTC.D almost precisely tagging resistance at 47%, I believe the alts now have a small opening in the clouds to rise. That being said wait for this candle to close in 3+ hours on your 4hr chart for entry confirmation.
Entry = Price upon candle close on the 4hr.
Stop = Somewhere below neckline. I chose 1.53
Target = 1.97 but taking profits along the way.
Risk/Reward = 3.33
Best to you!
Stew
Here's the BTC.D chart showing resistance:


Long BTCUSDTlot of people had lost money buying YFII and investing in scam coins and wanted to recover their losses,
Whales had been defending this 29k-30k level multiple times.
Everytime, it drops below 29k, it will rebounce back, this shows a sign of strength where whales are accumulating.
This might be your last chance to buy bitcoin at the dip.
BTC had made a bullish flag pattern and it fake out of the range.
It made an inverse head, and closed back into the range.
This is a bullish formation whereby btc made a fake up before going up.
Now , btc is doing a small weird correction before going up to 38k
This is very bullish .
This should be the macro bottom.
Hence, btc should moon from here and target 38k .
This is not a signal and do not follow but a trade idea.
Disclaimer - This analysis alone DOES NOT warrant a buy or sell trade immediately. Before you enter any trade in the financial market, it is very important that you have a proper trading plan and risk management approach

Lucid breakout?I'm liking the look of this inverse Head & Shoulders forming, as well as approaching the down trend resistance we've been in since November. RSI broke this downtrend a while ago and recently re-tested, so I'd expect to see similar happen on the chart.
We're also in a descneding broadening wedge, recently bouncing off the bottom and looking to head towards resistance.
Waiting for confirmation will be the best trade, breaking $20 then getting a successful re-test of the neckline and trendline. My take profit target will be $25 to secure profits of about 25%, although it may overshoot to previous resistance of up to nearly $30.

GBPUSD Bearish Divergence4H Inverse Head & Shoulder
4H Bearish Divergence
1H Bearish engulfing is about to close 10 pm est. (Start of drop/pullback)
Expecting drop to 4h 50 EMA where previous support was or possibly a lil further.
Expecting one of the 2 levels to hold as support before continuing inverse head and shoulder pattern to upside.
