GBPUSD INVERTED HEAD & SHOULDERSGBPUSD has formed an inverted head n shoulder pattern indicating a bullish retracement is happening.
The Retracement target is the broken support turned resistance.
Inverse Head and Shoulders

SPY possible Inverted H&S ?Here is a look at the possible Inverted Head and Shoulder formation on SPY (1hr)
One thing to keep in mind, SPY is clearly in a downtrend, and there is no point in trying to time the bottom, the smartest thing to do is play what you see, take profits, reset and do it again.
On this 1 HR chart, there is a possible inverted H&S in the making.
Left shoulder being at 394.75 level (approximate) Head being the low at 385 and now SPY could attempt to put in the right should (394.75)
SPY has a very strong resistance at 404 / 406 level, which would be the neckline . Below that level, We are still in a bear trend. Above, we could have bottomed.
I want to see if we are going to pullback towards 394.75 to form the right shoulder and see where it goes from there.

U.S Dollar index U.S Dollar index , is very bullish today because it has formulated inverted head and shoulder and the target is 103.700 with a stop loss of %3 of your account.

Dow Jones dji index Dow Jones dji index , expected to be bullish and going long would ideal for today with a target of 33000 and stop loss of %3 of your account.

Mini Double Top Formation, what next?Hey Traders!
The inverse head and shoulders are weak, the MACD is also forming signs of a potential retest towards 27k.
Safe trading,
-Pulkanator

BTC is anyone seeing this?Hello Birdies.
I think BTC is forming a inverse H&S. It has a 72% success rate. If this happens it will put BTC right at the red line which we are looking to short as another big dump.
You can look into our previous charts and you will see that purple price tag there as well..

BTC inverse head and shoulders#BTC/USDT
$BTC broke out from neckline of inverse head and shoulders pattern.
and confirmed it as support.
so holding the neckline as support can increase price to resistance zone between $33k and $34500.

INVERTEDE HEAND & SHOULDER PATTERN 🎉A clear picture of APEcoin doing an inverted head and shoulder pattern on H4 TF, it depends on bitcoin bias and outplay.

BTC Inverse Head and Shoulder (UPDATED)As you can see, the market is following the predicted movement. The only problem we're facing is because of Terra a.k.a. $LUNA.
Apparently, Luna Foundation has transferred 80,394 $BTC from their reserves to Binance and Gemini. Let's see what their next movement is headed to.
If you like my idea then please like, share, and comment below.

SFP analysis- Head & shoulder patternIn 15min time frame, sfpusdt is making inverse head & shoulder pattern

BTC ScalpAccording to my view,Technicaly can be seen a inverse head and shoulder pattern in 15 min time frame, If BTC trying to test neckline I ll open my long position arround $ 29,500 - 29,750.
TP1 - $ 32000
TP2 - $ 33000
SL - $ 28750
#DYOR#
#IamNotaFinancialAdvisor#
Thank You

GBPAUDGBPAUD took support from Daily EMA12 and it's forming inverse head & shoulder on the lower timeframe. Watch out for the breakout for the targets marked on the charts.

TSLAGonna post this one once again right here.. inverse H/S setting up .. gonna create lots of TSLA fanboys to come out of no where lol and hope for 1200 test.
Close under 696 on the week and this may not play out.

Right on the DOT/USDTDOT/USDT
🟢entry: $18.060- $17.295
❌stoploss: $17.730
🎯tp1: $28.420- $27.360
🔼potential %profit: +56.57%
🔽potential %loss: -10.66%
r/r: 5.31
Hi Everyone,
🥀this trade idea is fairly self-explanatory. i see an inverse head-and-shoulder pattern developing. in addition to the chart pattern, there is significant volume and the left shoulder, the head, and (to a lesser extent) the right shoulder. this price/volume combination strengthens my confidence in the pattern.
🥀i am setting up the entry in a fairly tight range at the right shoulder, between $18.060 and $17.295.
🥀stop-loss is placed at an appropriate distance below entry, although there is not much in the way of price structure to give further guidance in placement.
🥀target exit is at the last point before price dropped off with volume and began to form the left shoulder of the pattern.
check back for updates as the position progresses.
feedback and constructive criticism is always appreciated.
✌️all good luck and always practice strict risk management!

#Hex vs #Doge. #Memes, #Metaverse plays & #NFT's are doomed. Inverse Head and Shoulders: The two targets represent a Unlogged & Logged projection from the Head to the neckline. Giving two vastly different results. To meet the 100:1 doge:hex ratio could signal which seems outrageous. But during a prolonged bear market. we can definitely witness a Doge at a Penny. And the premier store house of value reach a Dollar in the next 12-18 months.

INDUSINDIndusind made inverse head & shoulder pattern on an hourly charts with good volumes.
\
Could be bought with mentioned stoploss & targets.

Bitcoin - Small bull trade ideaKeep it plain, simple and minimize the noise!
We nailed our last few trades! :)
Sorry for the phone upload, but here we have an inverse head and shoulder retesting the neckline with a bull flag (continuation pattern).
If we get our confirmations, my target is around 33k.
Also not surprised if we just nuke straight through this, as the market is clearly bearish.
At the moment - the market is sideways, choppy and RISKY.
I have various different set-ups I'm watching and always waiting for confirmations of each one BEFORE entering a trade.
Comment your ideas down below :)

MACYS Inverse H&S WeeklyAn inverse H&S formation on the Weekly chart on Macys
The price will form a right shoulder and climb out of 1.618
This is bullish for price once completed

XAUUSD BuysThis is just a simple chart pattern that shows you the head and shoulder pattern inversed. Safe trade to secure a few pips. The target will be 1917 for XAUUSD.
OANDA:XAUUSD

DOGE/USD Inverted Head and Shoulders at PCZ of Bullish ButterflyWe are at a PCZ of a Bullish Butterfly printing a Potential Right Shoulder of an Inverted Head and Shoulders Pattern Visible on the Weekly with a bit of Bullish Divergence to top it off.
My Stop loss will be below 10 cents and my TP will be above 30 cents.

Nifty 50 potential positional long trade
Potential inverse head & shoulders pattern developing on Nifty 50. The trade can be initiated upon the break of the neckline with a target of All Time Highs.

Short-term technical upward move likelyThis is a short-term trade. On the technical side, we've got the following things that make a bullish move more likely:
According to seasonality, in the last 15 years, only in one year went the price down within the timespan from the 7th of May until the 23rd of June. So, it's a bullish time for this stock according to seasonality.
The prior inverse H/S pattern got broken; the price went up, came down, and tested precisely the neckline yesterday.
A clear hammer candle formed yesterday.

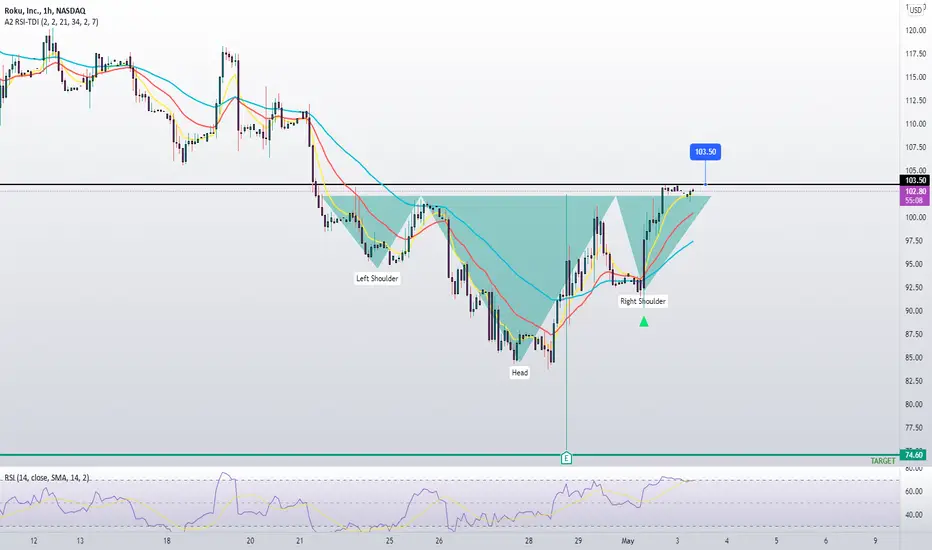
ROKU Inverted H&SClassic inverted H&S on ROKU,
Waiting for a break of the neckline for a confirmation.
FOMC tomorrow, so market might be choppy, be careful!