Why not buy IOTA for 100 % profitAs we see here the correction is at its end, if BTC lets, it will see 2.5 $ in next days. Buy for long by leverage 2 or 3 is full safe.
Iotausdt

IOTA +60% RUN, OR DO WE GO FURTHER DOWN?Hello Cryptnonauts
Let's take a look at IOTA! Recently we just saw IOTA Facing a new resistance Level between around 1.3275 and 1.3475. After a quick bounce away from that resistance, we are now looking forward to rechallenging this level.
So, therefore, you might ask if you should go and buy a potential breakout or maybe short at the resistance? These are good questions, and I try to give you a few possible setups that might appear.
Let's Take a look at the Bigger Picture first!
On the 1 Hour chart, we see that we are in a significant trend facing the bottom side. So generally speaking, a movement further down might be more likely at this point. But a trend can break every time, so we are also looking at the potential longs.
So let's go and cover a few potential scenarios.
Scenario 1 (Short) down to the support level
1Hour Chart
5Min Chart
At our Short scenario, we might move now a little bit more up until we either hit the resistance level or the red Trendline and push back from there down to our support level around 1.0400
So for potential entries, we would look at movements that are moving back to the downside from those levels.
Scenario 2 (Short) down into a Sideways Market and a potential Trendline break
In our second Short scenario, we are looking for a potential ending in a sideways market until we break the trend line for a bullish movement.
We are looking at the same Setup as in our first Short scenario but with another target.
Same Chart Setup for the Short position
Facing the new build support?
In this scenario, we are now looking at the new build support from the price bounce around 1.2000.
That level might end up in new support since 1.2000 also is a pretty easy number to trade, and it might stick in traders' heads for potential long positions. That's why we might end up in a sideways market, which has a great potential to break the overall downtrend and end up in a bullish market.
Scenario 3 (Long) Trend and Resistance level Breakout
Once Again, we are looking basically at the same chart, but with two potential breakouts this time. We can either directly break entirely through the resistance and trend levels or, what I believe would be more likely, break through the first Trendline, turn the resistance into a support for a price correction and then continue to breakthrough.
direct breakthrough
Trend Breakthrough with a minor price correction to the past resistance that then acts as support before we entirely turn into a bullish trend.
Those are the potential setups and movements I am looking into to make some trades. I hope I could give you some insights into my thoughts.
Happy Trading

bullish wolfe wave IOTAUSDTAlready broken out, but not seen too late.
Order also possible at the Daily SR over we are just. LFG


IOTABTC Technical Analysis
⏳ Spot
💎 IOTABTC has formed a triangle in the channel. It is also at the Support zone and I expect that we get a bounce at this zone. We might see a Bullish engulfing at this zone otherwise the price might go lower before it Heads up
🏁 Short Term
💵 Invest Only 5% of your Portfolio
🎳 Entry at market or 0.00002945
☕️ TP1 0.00003115
🍺 TP2 0.00003250
🍻 TP3 0.00003400
🍾 TP4 0.00003480
🍷 TP5 0.00003690
🍸 TP6 0.00003830
🍹 TP7 0.00004200
🎁 TP8 ___________
🚫 SL 0.00002820
Good Luck 🎲
Check the Links in Description and If you LIKE this analysis, Please support our page and Ideas by hitting the LIKE 👍 button. ❤️ Your Support is really appreciated! ❤️
Traders, if you have your own opinion about it, please write your own in the comment box. We will be glad for this.
Feel free to request any pair/instrument analysis or ask any questions in the comment section below.
We will have more FREE forecasts in TradingView soon
Have a Profitable Day


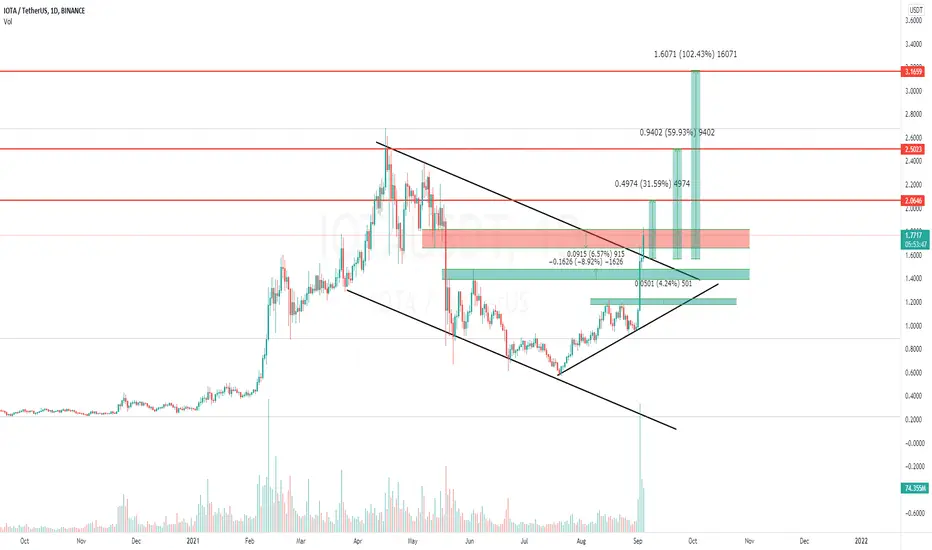
IOTA to 2.38?IOTA broke up this triangle 📐 and I think there is chance for run to 2.38 and even higher. Just bought at 1.63.
ENTRY : below local high @ 1.663
SL : local low @ 1.47
TARGET : height of the triangle projected from midpoint of the local range (LOCAL HIGH - SL) @ 2.38
RRR : 4.6
INVALIDATION : when SL level hit
Please like👍, comment🗣️, follow me✒️, enjoy📺!
⚠️Disclaimer: I'm not financial advisor. This is not a financial advice. Do your own due dilingence.

IOTA break out of Pennant and retested it price broke out of this pennant and successfully retested it, so I enter a long at the current price of market with a stop-loss just below the previous low and tp at top of the pennant.

IOTA/USDT SELL SIGNALhere is selling pressure accross the crypto market, which can send most coins along with the BTC down by 10% or more %.

IOTAUSDT (4h Chart) - Trend Breakout!IOTAUSDT (4h Chart) Technical analysis
IOTA/USDT (4h Chart) Currently trading at $1.59
Buy level :Abow $1.57
Stop loss: Below $1.42
TP1: $1.77
TP2: $1.92
TP3: $2.12
Max Leverage 3x
Always keep Stop loss
Follow Our Tradingview Account for More Technical Analysis Updates, | Like, Share and Comment Your thoughts.

IOTA/USDTMy notes for tracking my x3 leveraged iota long position.
First entry filled orders (%50 in total)
@1.6370 %15
@1.1620 %18
@1.6050 %17
Average : 1.6195
Expected second entry average: 1.1600
SL: 1.5219
TP: 1.8854
nfa

IOTA/USD Breaks Above $1IOTA / USD ANALYSIS
The IOTA price is trading bullishly and a breakout above the channel may trigger a rapid increase.
The daily chart reveals that IOTA/USD has now resumed the bullish continuation as the buyers gain control of the market. The 4.67% surge in volatility has leveled up the trading price at around the $0.96 resistance level. The MIOTA price is seen trading above the 9-day and 21-day moving averages.
Can MIOTA Price Keep the Uptrend?
According to the daily chart, the IOTA price has been increasing since July 21 and traders may see more climbs if the coin crosses above the upper boundary of the channel as the bulls are taking control of the market. On the downside, the 21-day moving average at $0.80 could provide support for a possible bearish retracement.
However, if the MIOTA price crosses below the moving averages, the coin may test the $0.72, $0.62, and $0.52 supports. As revealed on the Relative Strength Index (14), the signal line is crossing above 60-level and the current buying pressure is clearly revealed above this level. At the moment, we can say the MIOTA market is following a bullish scenario and the resistance levels are located at $1.20, $1.30, and $1.40.
IOTA/USD Market
Key Levels:
Resistance levels: $1.20, $1.30, $1.40
Support levels: $0.72, $0.62, $0.52
-For more chart analysis on the crypto market follow, and if you agree with this, like and share.

IOTAUSDT trend Resistance Line Breakout!IOTAUSDT (DAY CHART) Technical Analysis Update
Trend Resistance line Breakout
IOTA/USDT currently trading at $1.75
Buy-level: Above 1.75
Stop loss: Below $1.62
Target 1: $1.86
Target 2: $1.95
Target 3: $2.05
target 4: $2.25
Max Leverage: 3X
ALWAYS KEEP STOP LOSS...

IOTA Buy a break.IOTA - Intraday - We look to Buy a break of 2.112 (stop at 2.038)
We are trading at overbought extremes.
This provides an excellent risk/reward opportunity to fade the current bullish move.
A break of bespoke resistance at 2.100, and the move higher is already underway.
Our profit targets will be 2.334 and 2.389
Resistance: 2.100 / 2.200 / 2.300
Support: 2.000 / 1.900 / 1.800

IOTA TREND LINES PREDICTION...This is my prediction of IOTA. Everything is bullish, The price is still over the moving averages. That's enough to be sure.

IOTA / TetherUS Trending Up under High VolumeIOTA / TetherUS Trending Up under High Volume - IOTA is a cryptocurrency with its own blockchain. IOTA is a cryptocurrency, with a purpose for IoT (Internet of Things). It's build upon DAG (Directed acyclic graph), called Tangle. The Tangle ledger is able to settle transactions, with zero fees.

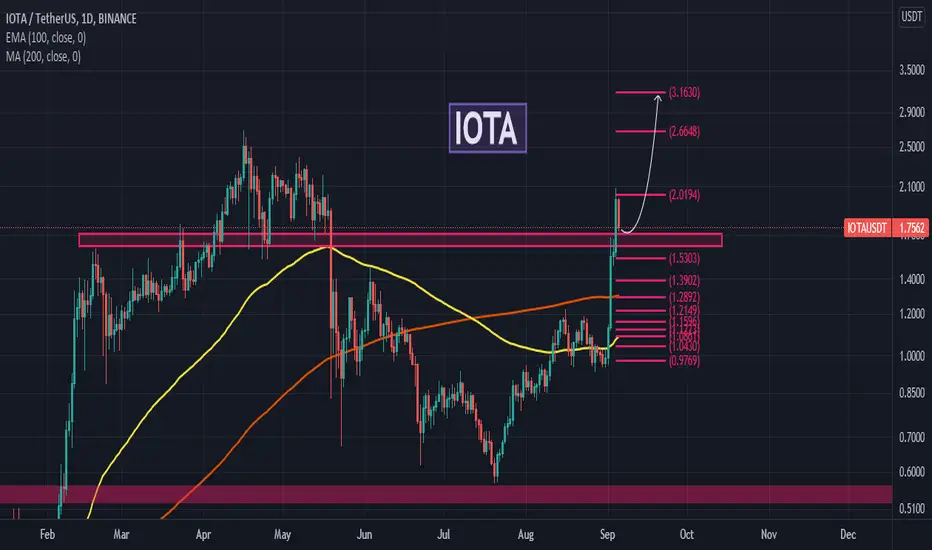
IOTAUSD D4: 200% gains BEST level to BUY/HOLD (SL/TP)(NEW)Why get subbed to me on Tradingview?
-TOP author on TradingView
-2000+ ideas published
-15+ years experience in markets
-Professional chart break downs
-Supply/Demand Zones
-TD9 counts / combo review
-Key S/R levels
-No junk on my charts
-Frequent updates
-Covering FX/crypto/US stocks
-before/after analysis
-24/7 uptime so constant updates
🎁Please hit the like button and
🎁Leave a comment to support our team!
IOTAUSD D4: 200% gains BEST level to BUY/HOLD (SL/TP)(NEW)
IMPORTANT NOTE: speculative setup. do your own
due dill. use STOP LOSS. don't overleverage.
🔸 Summary and potential trade setup
::: IOTAUSD D4 chart review
::: still bullish outlook in IOTAUSD
::: massive gains recently
::: upside momentum intact for now
::: TP BULLS near 4.20 USD
::: right now more upside possible
::: recommend to BUY ANY DIPS
::: 1.50/1.60 USD great reload BULLS
::: BULLS maintain control until 4.20 USD
::: until we get a decent pullback
::: wait for the pullback now
::: before buying it
::: Speculative bullish setup
::: reload bulls is later maybe this week
::: strong mirror S/R level
::: 1.60 USD strong reload BULLS
::: get ready to BUY low / hold it
::: 200% gains possible from my level
::: strategy: BUY LOW after pullback
::: TP bulls is +200% gains BUY/HOLD setup
::: buy near my level and get rewarded
::: TP bulls is +200% or 4.20 USD
::: good luck traders
🔸 Supply/Demand Zones
::: dem/supp N/A
🔸 Other noteworthy technicals/fundies
::: TD9 /Combo update: N/A
::: Sentiment short-term: BEARS/CORRECTION
::: Sentiment outlook mid-term: BULLISH /200% PUMP
RISK DISCLAIMER:
Trading Futures , Forex, CFDs and Stocks involves a risk of loss.
Please consider carefully if such trading is appropriate for you.
Past performance is not indicative of future results.
Always limit your leverage and use tight stop loss.

IOTA, RETEST CONFIRMED BEFORE A PUMP !Very nice retest we has recently. still very bullish !!!
Just enjoy... >_-
Broken Channel Crypto AnalysisIOTAUSDT has broken the channel on daily time frame it is good buy around marked demand area with bottom level as stoploss on closing basis for the target given on the chart. Let's see
What comes next for IOTA/USDT? HUGE POTENTIAL TO THE UPSIDE!1. Price broke through the major level
on a daily tf.
2. Price found resistance on 1.6080 area.
3. I'll be waiting for the price to test
our fib level for buy position.
4. Expecting the price to form some sort of
bullish correction (flag) pattern.

IOTA/USD:UPTREND|WAITING FOR NEW BULLISH IMPULSE|LONG🔔Welcome back Traders, Investors, and Community!
Check the Links on BIO and If you LIKE this analysis, Please support our Idea by hitting the LIKE 👍 button
Traders, if you like this idea or have your own opinion about it, please write your own in the comment box . We will be glad for this.
Feel free to request any pair/instrument analysis or ask any questions in the comment section below.
Have a Good Day Trading !

IOTA amazing profits after my call (results)IOTA / USDT
Iam sharing with you some of my results
all targets done today against USDT pair since sending this signal
Profits are running with 103.5% gains
See original signal below 👇

IOTABTC Technical Analysis
⏳ Spot
💎 IOTABTC after the breakout of the resistance will go for a retest and then again will go up. It may go to the Pullback zone before it goes up.
🏁 Short & Medium Term
💵 Invest Only 5% of your Portfolio
🎳 Entry at market or 0.00002135
☕️ TP1 0.00002420
🍺 TP2 0.00002470
🍻 TP3 0.00002525
🍾 TP4 0.00002590
🍷 TP5 0.00002990
🍸 TP6 ___________
🍹 TP7 ___________
🎁 TP8 ___________
🚫 SL 0.00001955
Good Luck 🎲
Check the Links in Description and If you LIKE this analysis, Please support our page and Ideas by hitting the LIKE 👍 button. ❤️ Your Support is really appreciated! ❤️
Traders, if you have your own opinion about it, please write your own in the comment box. We will be glad for this.
Feel free to request any pair/instrument analysis or ask any questions in the comment section below.
We will have more FREE forecasts in TradingView soon
Have a Profitable Day
