$JPM Tweezer Top on Daily$JPM - Declining volume on latest run-up post earnings. Expecting additional retrace in the near term. Target $110-$114.50 range. Will monitor Fibonacci support levels for further breakdowns.
JPM

BAC SHORTBAC (and the rest of the banking industry) has a rough few months ahead. The major institution has seen solid gains over the past year and is about to relinquish them all. The major indication this downtrend is about to pick up steam is seen as the 50 day moving average is ready to cross below the 200 day moving average, a major bearish sign known as the death cross. Price on the weekly candle has managed to close significantly below this intersection point, a sign that a significant decline could come sooner than later as there is very little support below the current price. Seen on the chart above, RSI is also headed south with no sign of retracement anytime soon. Money Flow is in a steep downtrend as well. I anticipate BAC seeing at least a 20% decline in the coming months. The last time BAC had a similar set up with the 50 day moving average crossing over the 200 day moving average, the stock fell 33% in 6 weeks. I have picked up November and December puts for BAC (and JPM because the chart and my prediction is basically the same).


JPM - J.P. Morgan ChaseBanks have sold off here and I believe if the market can start to move again, financials will recover. I structured a Super bull for this trade.
Trade: In chart.
Overall, $.46 credit on the trade.
Current risk: $454
Current R/R: 10.2% ROC (likely to increase if I can capture profits in the call spread.

Buy the Banks, Suckers!Every time I turn on CNBC, FBN, or the like, I hear a pundit or analyst pounding the table to "buy the banks." The go on to ramble a spiel about low valuation rations (P/B, P/E, P/FCF, etc), rising rate environments, yield curve inversions, and other reasons that they should outperform the markets going forward. But who's biting?
A quick glance at the SPDR financial ETF - XLF - and you will likely arrive at the conclusion that this is a sell, not a buy. We've broken short term trends (red dotted lines), intermediate term trend (orange dotted line) from 2016 lows, and are approaching a trend line (green dotted line) from the recession lows nearly a decade ago. Even worse, it looks to have formed a double top at the $30 level, the first peak coming in 2007.
Until there's a bid to reverse trend, this is a hard sell. Support looks to come in around $25. If that fails, the next support is around $21, but that's crash-level support.
Of course, one must ponder... if the banks are rolling over, how well can the broader markets hold up? Is this the warning shots of a larger correction in the markets? Hmm...

A Bad Year For US Financials Looking Even WorseMorgan Stanley, Bank Of America, Citigroup and JPMorgan - all exhibiting similar year to date behaviour. The whole sector is rolling over, reversing the 2017 rallies as the yield curve remains flat, and possibly set to invert. JPMorgan and Bank Of American look particularly bad.. notice both are just managing to hold up above a clear 6 month support. I would bet on break lower in the coming weeks, possibly days. BAC, JPM, C, MS, XLF.

$JPM JP Morgan - Gap-fill Holding LT Support Line$JPM JP Morgan - Gap-fill from last week, now bouncing off long term support trend line. Expect to see $112 in the near term.
Medium term will most likely see another move down within triangle pattern before an eventual breakout to the upside (assuming solid ER mid-July).


JPM: ABCD Completion with upside target to $121.60Couple of harmonic completion in JPM:-
#1 The Feb to Mar butterfly formation which resulted in...
#2 An extended ABCD down move to 106.
#3 Price reversal with heavy volume on the 138.2% extension of the #2 ABCD which...
#4 Happens to be the 78.6% retracement level (higher low) from the 6 Feb low.
All these leads me to think JPM is about to make a move up to try a new high at $121.60, c.+9% upside. This is earnings season, all the volatility in global markets should = great trading results for JPM & fellow banks = pop in share price = Feds raise rates = +ve feedback loop on banks' share price. If you have not closed your shorts since my last post on the ESA, it's still not too late to do so.

JPM Inside day after earnings and 2618JPM had an inside day after earnings; it could be a solid setup itself most of the time.
In this case, it is also an bullish pattern and 2618 combination long, and now this inside day could be a confirmation entry!
What's more, the earning gap already tested the previous gap resistance, so if the inside day is able to break to the upside,
it could be a solid long trade!
If it breaks to the downside first, this trade doesn't exist anymore.
Let's see how it goes!

JPM | 115-120 May 18th bull call spread $100 debitDown on great earnings
Financials expected out performance

THE WEEK AHEAD: JPM, C, WFC, SMH, AND XBILater in the week, we kick off earnings season with a trio of financials: JPM, C, and WFC,* all of which announce on Friday before market open.
Generally speaking, I haven't played a lot of financials in the past, since their background implied volatility never seems to bump up significantly enough. Here, however, with JPM's implied at 32, C's at 33, and WFC's at 33 -- all toward the upper end of their 52-week ranges, I figured I'd take a look to see whether "this time is different." It looks like it is ... .
The April 20th 23 delta 104/114 short strangle in JPM is paying 1.47 at the mid with break evens at the one standard deviation line, and the corresponding defined risk setup (an iron condor) with strikes at 101/104/114/117 is nearly paying one-third the width of the wings -- a .96/contract credit, with break evens between the expected and a one standard deviation move.
The C April 20th 65/72.5 20 delta short strangle is paying 1.00 even with break evens at the one standard deviation line, implying that a defined risk setup isn't going to pay at least one-third the width of the wings. Moreover, the longs clear of the 20's go 2 1/2 wide ... .
In WFC, the April 20th 49.5/55 22-delta short strangle pays .87/contract with expected move break evens ... .
Out of these three, I'd probably go with the JPM play because the defined risk setup is paying nearly one-third, and the strikes wide of the 20-delta strikes don't go all "wanky." Having strikes in one-wide increments basically everywhere generally leads to fewer rolling headaches. That being said, it's a long way between here and Thursday close, which is when you'd want to look at these underlyings again, adjust your setups accordingly, and see whether they're still worth your while.
On the exchange-traded fund front, the top five implied volatility wise are: OIH (37), SMH (36), XBI (36), XOP (35), and EWZ (32). I'm already in XOP and EWZ plays, so the only thing that makes personal sense for me out of that group are potential plays in SMH or XBI, although I'm sure there's still juice to be had in just short strangling XOP (the May 25th 31.5/38's paying 1.00).
The SMH May 18th 90/108 short strangle (20 delta) pays 2.55 with expected move break evens; its defined risk counterpart, the 87/90/108/111 pays .93, slightly short of the one-third I normally look for, but probably good enough for a less than 40 day until opex setup.
The XBI 75/91 pays 1.98 with expected move break evens; the 72/75/91/94 pays .85 ... .
* -- Given that this trio is closely correlated, it may also be worth taking a look at XLF, although with a background implied of 28, that isn't looking all that juicy at the moment ... .

monitoring bearish Head & Shoulders set upXLF needs to get over $29.50 to invalidate the bearish head and shoulders pattern present. Focusing on the right shoulder Red Box . Head and shoulders pattern is not confirmed nor completed yet. Disclosure i'm short $bac Bank of America

CSCO 120M butterfly reversalIs tech hot steak coming to an end? CSCO exhibiting a beautiful butterfly formation. What other butterflies can you spot? Clue...think banks, big banks...

Heading towards levels seen before 2008's crisis Banks earnings, Trump and the Fed drove XLF back to where it was before the major financial crisis of 2008.
10 Years later, will history repeat itself?

Long Triggered @ WK Demand on JPMJPM reached WK Demand, price reacting to it, possible bullish engulf by end of day.

$XLF Is the Financial Pullback Something More? (includes video)U.S. financial stocks have been in pullback mode this week despite the SPX moving higher. Considering that financial stocks had been a big boost to market gains over the last several months, this could be concerning.
The XLF is down about 3% - and regional banks KRE down 6% - since the recent top. Let's put this move into context, shall we?
As MacroView as posted before, financial stocks really began to rally in early Sept just as the 10s/fed funds curve bottoms around 90 basis points. The correlation has been rather strong between .65 to .93.
In our view, the curve and financials rallied on two things: markets were trying to price higher inflation (we saw this as the long-end steepened) vis-a-vie higher commodity prices. Then, markets were anticipating Pres. Trump nominating John Taylor as the next fed chair, who would be uber hawkish.
We were happy to take the other side of that bet. Powell is dovish. In turn, we saw yields and copper, particularly, head lower.
The 10s/fed funds rate topped out at 131 basis points and began to trade lower on the above events. Price action in XLF and KRE weakened and the pullback ensued.
Click the here to listen to where support may be found and whether or not financials and the curve will rebound.
Check us out on twitter @macro_view

JPM - Ascending channel, found support on bottom of channel.JPM in a strong ascending channel on the 30min chart. I would long any bounce off of the bottom channel, just like what you see now(10/29).


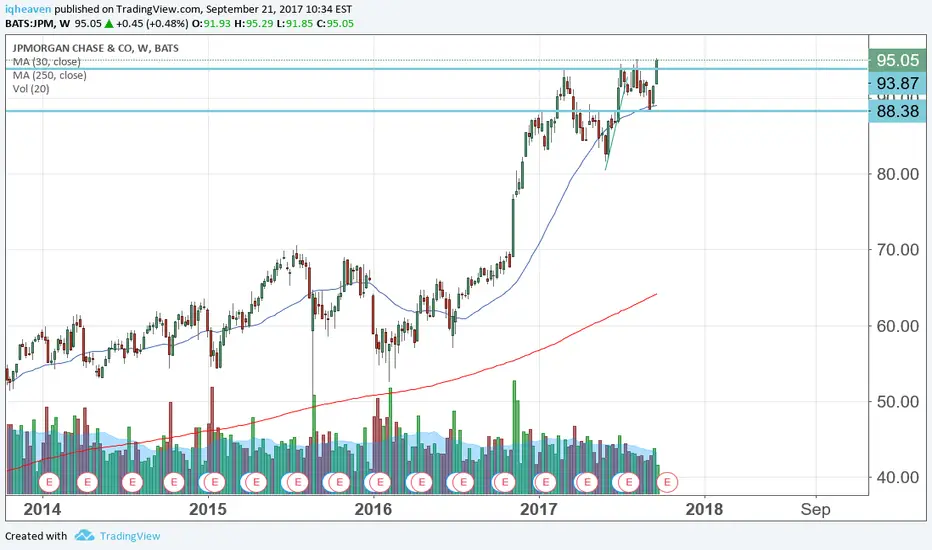
JPMorgan - Potential accumulation towards 98.38Since price rallied from 81.60 in June this year to the recent high in July, price has been in a consolidation phase.
We saw a false breakout above the 94.47 high in July before making a recent low of 89.07 in September. This is a typical expanding flat structure according to the wave patterns.
Price has too met the minimum expectation area of 123.6 to 161.8 fib expansion.
We are now expecting price to continue its move higher from here potentially targeting 98.38 area.
*Disclaimer - do your own due diligence on the fundamentals of JPM before investing into it.

A potential long position on JPM in a few daysLong position on JPM.
1.- Big buy of market makers with a lot of volume
2.- Price on the long-term trend line for the fourth time.
3.- RSI approaching the oversale area
Goal 1; Intermediate resistance at $ 92.55
Goal 2: Roof of the range at $ 94.03
Let's wait until the price get back into the range that should happen in less than 5 days.

JP MORGAN (JPM)96.3$ is possible target of impulse wave 3.
the impulse wave #4 has several possible targets:
# 67.26
# 78.34
# 82.18
# 85.19
Lets wait for correction and first of all wait for confirmation of end the impulse wave #3
