MARKET OVERVIEW 👨👩👧👦 | $SPY + $APPL + $JNJ + $JPM + $T📊📊📊Let's take a look at the S&P, Apple, Johnson and Johnson, and AT&T. Today we are looking to see if we can find the direction of the market going into the week by analyzing some top S&P holdings that are indicative of different key sectors.
The idea is to look at two bullish sector charts Apple (tech) and Johnson and Johnson (healthcare), and two bearish charts JP. Morgan (financials) and AT&T (communications), to see if we can find the direction of the market.
While our money is on more upside eventually (especially with Apple making an All-Time High (ATH), zero interest rates, and stimulus outweighing temporary slow recovery concerns), we want to know if the bears of the market pull us down or the bulls can sustain continued uptrend going into the week.
This write up took a long time so please Hit that 👍 button to show support for the content and help us grow 🐣
---
S&P 500 Index
Support S&P:
We have found a reaction on the S1 major price pivot point at the S/R flip. This is of course the ideal spot for the bulls to find support. If that last wick was the only test of this level we end up getting, all the better for the bulls.
If we do need to test lower levels, then the S2 untested bullish orderblock right below us provides another chance at retaining a bullish market structure.
If neither of these hold, the bulls have one last chance at the uptrend with the S3 orderblock cluster and previous range lows. A grind down to this level like we see with AT&T seems like one possible pathway there.
Resistance S&P:
The main resistance we will be looking at with most of these charts is seen in the S&P's R1 orderblock cluster at the previous swing high.
Regardless of where we find support, this resistance will be the main point of contention.
---
Apple
Support APPL:
Apple is by far the most bullish asset here. It is also the top holding of the S&P. The major support for Apple is the S1 orderblock and S/R flip cluster at the previous All-Time High. For the rest of the market to retain a bullish structure, S1 holding is key.
If S1 can't hold, the S2 orderblock and gap-fill is the next best hope for the bulls. The bulls don't want to see any weakness for Apple, so holding these levels and making new highs is key.
Resistance APPL:
Apple resembles the S&P, and that is logical because it is the biggest S&P holding. Rejection at R1 for Apple means no new ATH. Breaking R1 means a new ATH. How Apple reacts matters for the market. We see this one being broken eventually, but it has to happen sooner rather than later to lift the rest of the market up and avoid a "slow recovery."
---
Johnson & Johnson
Support JNJ:
The S1 orderblock and gap-fill on JNJ is about to be tested and is the ideal support. Finding support here means another point for the S&P bulls because we get JNJ working for us and not against us.
If S1 can't hold, we have S2 not too far away, this plays into the S&P's S2 holding as well. A dip this low isn't ideal, but the bullish market structure isn't broken if S2 holds.
Resistance JNJ:
JNJ has been correcting longer than most of the stocks on this chart. Of course, it also has a more bullish overall structure than our JPM and T bearish charts. For JNJ though, the longer correction means more levels of resistance, both the R1 S/R and orderblock and R2 S/R stand in the way for JNJ. This makes it a little harder to rely on than Apple from a pure TA perspective.
---
J.P. Morgan
Support JPM:
Big banks have their pros and cons right now, but for the market to reflect those pros S1 holding is ideal. JPM could be off to the races, or it could be making a drawn-out bottom formation.
A retest of S2 gives weight to that long drawn out bottom, therefore the big bank and S&P bulls want S1 to hold so we can maintain momentum.
Resistance JPM:
The primary resistance for J.P. Morgan is the R1 orderblock at the prior swing high. The recent market structure is similar to Apple and the S&P as a whole, it is only the previous structure that signals that JPM is a weaker asset currently. Some good JPM fundamentals could help the S&P here.
---
AT&T
Support T:
AT&T is the most bearish S&P holding we are charting. It lost its major support and is onto the S2 S/R and orderblock cluster. If this one doesn't hold, giving us a higher low, then we are simply retesting the COVID lows. If major holdings start breaking down to new lows, its a bad look for the market. The best way to avoid making new lows is not to retest old lows and instead to make lower highs. This is what the bulls want from T.
Resistance T:
Even though this is the most bearish chart, there isn't a ton of noteworthy resistance, which is a good thing. R1 is the main resistance for T. This range is notable as it was a previous resistance as well, T has this in common with the S&P... which helps confirm R1 being an important level to breach for the bulls.
---
Summary:
The S&P rallying from here or consolidating above S1 would be ideal for the bulls. For this, we need the more bullish S&P holdings like APPL and JNJ to hold their respective support levels and then rally while weaker holdings like JPM and AT&T avoid too much further correction.
If some of the weaker holdings can find support at their current ranges, or perhaps even at the next range down while the more bullish holdings stay their ground, then we could still be looking for S1 and S2 to hold for the S&P.
However, if the market tries to go bear, then we would more be looking big tech like Apple to hold up the rest of the market like Atlas while we eye S3 for support for the S&P.
It seems unlikely that we make new lows, and so we are looking for support to hold overall, but a trip down to S3 certainly will have an overall market recovery mimicking the slower recovery noted by the FED and this scenario likely results in retests of the bottom for some of the weaker S&P holdings.
Will the S&P pull an Apple and aim for new All-Time Highs, will it correct for a bit like JNJ perhaps taking us to S3, or are we going to get a JPM and T style upset? That is the question.
Resources:
www.zacks.com + www.nytimes.com
Jpmorgan

$JPM J.P Morgan PUT ideafirst caught my attention during the last few minutes before close. A buyer stepped up taking a $820K bet $100 Put $820K premium with a 01/15/21 expiration. Firstly I don't blame the trader/hedge because the market is in a euphoric state, while reality not so HOT.
I am looking for the $110 break tomorrow w/ $SPY selling off aggressively. This all depends on the overall market if confirms upside, will take calls.

Will JPMORGAN continue climbing to historical summit?The movement of stocks is known in the past days, a strong movement in all sectors, even the financial sector knows a strong movement and among them the JPMORGAN CHASE & CO after the stock bounced from a weekly trend
The stock formed a classic triangular, and it was able to penetrate it with a respectable volume, and with a price gap.
The stock will currently try to descend towards the upper side of the triangle to retest at 105, which is a good opportunity to buy by targeting the top at 135.

Hunt my stop loss / you missed!!What up every one.
I told you my trading zone Gold under 1730
Now this is your opportunities
My trips, I shoot 4 Bullets
-1720 : 1 order
-1710 : : 1 order
-1700 : : 1 order
3 day ago. I show stop loss at 1700. I really surprise. the price go down to my stop loss.
It is ridiculous. Are they hunting my stop loss. you missed!!!
Now back to 1720. We will fight back.
JP Morgan predicted that there is a 60% chance that a recession will occur in 2020
You can't escape recession .
Gold is money.
Give money to me.
Give a profit to everyone.

#Daily: JPM gonna riseJPMorgan Chase & Co. CEO Jamie Dimon spoke during the Deutsche Bank Global Financial Services Conference Tuesday and argued the bank's stock is "very valuable" at current levels.
The price broke the $99,45 level. Long on retest of $99,45 or $103,11. Targets: $112,63, $125,73.
Earlier: Trump and SP500

#BTC Update [May, 12th] : building out an ascending channel#BTCUSD: Looks to be building out an ascending channel
#Bitcoin still remains bullish after a show of high volatility on these complex events; the bitcoin halving, Paul Tudor bought bitcoin, JPMorgan bank takes on Coinbase , Gemini as its first crypto exchange customers,...
Two possible scenarios
1.
Retest 8,400 and bounce on the uptrend support then we most likely get the top of the channel at 10,000 ~ 10,500 again; or heading upwards now to hit 10,500 level without retest support line.
2. Leaning towards the bearish side, breakdown of the support line will result in revisiting 7,600 level. If losing that support would lead bitcoin to the bear market on the mid term.
Don't predict the market, stick your plans in all scenarios and always have a plan B.

JPMorgan Breaking Out of Bear FlagJPMorgan may be breaking out below a bear flag formed from the March lows as we speak.

CLEAR ascending support on JPM - and we are lazy at it right nowAscending support on JPM - some will also identify the pivot highs calling for a triangle pattern.
Keep an eye on this support level if the market gets weaker - looking for things that were already lazy when the market was strong... looking for those to then get even weaker when the market gets weak... this is a good way to find intraday setups!
Hope this chart perspective helps the community
xeenos trading - sending positive energy to all those watching.


JPM opportunitya really interesting picture is developing here, I think we are currently undergoing a healthy retracement that might be open up an amazing trade longterm.

WOW - Remembering all Mr. PresidentsLmao, I did not remember this. It's from long time ago trying to understand a little bit more this bank. Maybe is something irrelevant but it could be helpful to feed the curiosity some people still have and expand their knowledge with a better research. Also if i lose this idea again for some months I'll know where to find it now.
There I tried to find correlation between democrat presidents or republican and the action price development from that far, just for educational purposes like I said. Just to be able to dig a bit more and find political causes related to the historical growing of one of the biggest banks on Earth.
I found this when I was checking other "too big to fail" banks recent movements, to check the impact with all this infinite stimulus have been announced almost everywhere, and anyone with sufficient authority is printing money now. What a mess, isn't it?
Please hope you find your own conclusions from here, always keep that curiosity... and doubt.
Thanks!


JP Morgan AnalysisShort on JPM, still practicing fib spirals, may be for awhile, enjoying them. hope you guys enjoy..
Bullish 'Fib' wave in green, bearish in yellow
Top to bottom for bullish waves
Bottom to top for bearish waves ~Spirals

JMP technicaly based forecast
📌Short intro:
I am full time trader - analyst * High accuracy of ideas * Technicaly and Fudnamentaly side in analysis * Comment if have any questions or want to send support * Price action - FIBO - Candl pattern * FX - STOCK - CRYPTO * Simple ideas
💡 JPM technicaly based idea, technicaly indicators showing we can expect higher recovery phase, global economy is in slow phase of recovery, we can see price is near to break FIBO 0.382 in this case FIBO 0.382 is and support zone, expecting to see break ad higher push in price till FIBO 0.6 or till trend line.
📌Have on mind, trading involves risk, check idea on your own tactic, if have questions pls comment!
Thanks on supporting!
All best, good luck!

EVIDENCE OF MANIPULATION!THE LAST TIME WICKS OF THIS NOMINAL SIZE OCCURRED, BUYING HAD BEEN BANNED (FOLLOWED BY BUYING LIMITS), THE VATICAN WAS SHORT SELLING THEIR METALS RESERVES TO SUPPRESS THE PRICE, AND THE CURRENT FUTURES PRICE SUPPRESSION MECHANISM WAS ESTABLISHED!

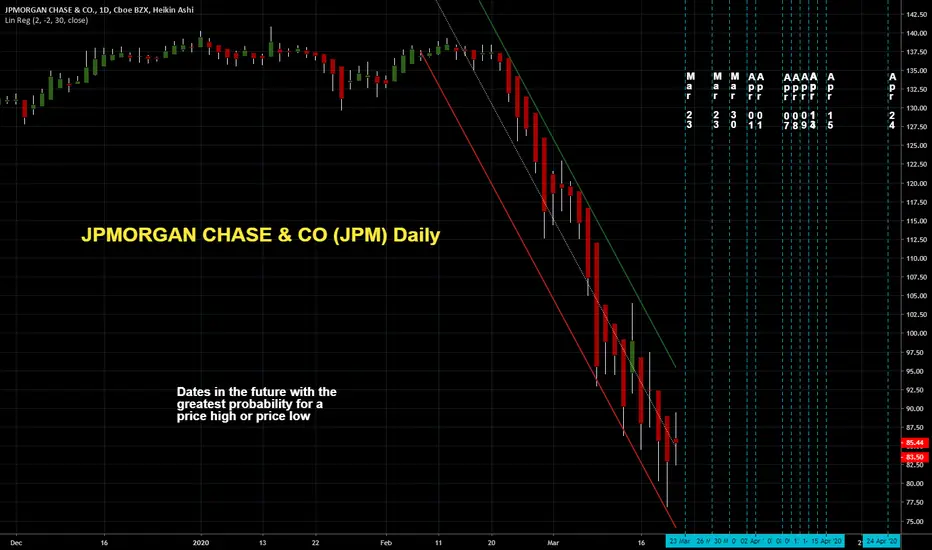
JPMORGAN CHASE & CO (JPM) DailyDates in the future with the greatest probability for a price high or price low
KEEP CALM ...and simply blame the Germans laterThe compared price charts are speaking for themselves.
DAX vs DEUTSCHE BANK vs COMMERZBANK
vs JP MORGAN CHASE / BANK OF AMERICA
What do you think? Please comment if you want to start or engage in a discussion.
Cheers & All the Best

JPM Bearish Exaggerated DivergenceAn exaggerated bearish divergence occurs when price forms a clear top, while the technical indicator (in this case RSI) diverges and forms a lower high.

China comes back to life, experts calculate lossesChina yesterday began to actively restore economic and industrial activity in the country. Judging by official figures, the epidemic has begun to decline, so there is reason to believe that the worst is over.
In this light, yesterday's growth in demand for risky assets is generally explainable. Perhaps the global economy in general, and China in particular, will get off easily. At least Bloomberg analysts believe that the impact of the epidemic on the economy will be extremely short-term. Although they note, in the first quarter of China's GDP growth will slow down to 4.5%.
In general, the uncertainty with economic damage is likely to be a factor restraining another bout of unbridled optimism in the financial markets.
The fact is that its scope can be more serious and tangible. For example, Simon McAdam from Capital Economics believes that the coronavirus will cost the world economy $ 280 billion and ultimately lead to the fact that the world economy in the first quarter of 2020 will not grow for the first time since 2009.
JPMorgan analysts expect China’s GDP to grow by only 1% y/y in the first quarter (they predicted an increase of 6% y/y before the epidemic). Goldman Sachs expects the coronavirus to subtract 2% from the global GDP.
And Morgan Stanley recently proposed how to measure the real extent of the downtime of the Chinese economy - by analyzing the level of air pollution. According to their calculations, air pollution in Guangzhou, Shanghai, and Chengdu is only 20-50% of historical values. This may mean that human activity here (transportation and industrial production) is only 50-80% of the usual.
In general, the optimists or pessimists will determine the dynamics of prices in financial markets on who ultimately turns out to be right. Uncertainty just hangs in the air, which means that for now, it is better to trade inside the day with small stops. We will look for points to buy gold and the Japanese yen intraday. We will sell oil at the time of its growth.
Also, we will buy the British pound. Yesterday's data on GDP (+ 1.1% y/y against the forecast of 0.8% y/y) and industrial production (+ 0.1% against the forecast + 0.3%) did not give rise to sales and important support 1,29. So, a rebound up is quite likely.

"JP Morgan: Long Setup" by ThinkingAntsOk4H Chart Explanation:
- Price is close to the All Time Highs Zone.
- Price is on an strong Ascending Trendline.
- If price breaks the Resistance Zone, it has potential to move up towards the Fibo Levels.
Weekly Vision:
Daily Vision:
Updates coming soon!


JPM retracing back to 130 ? Trade idea 17 Jan 2020With Tuesday candle rejecting 140 and subsequent days with lacklustre buying volume, we might expect a minor retracement.
If 140 gap is not covered and is continuously rejected, we might see JPM retracing back to the 130 level or even lower.
