Results of the week, 10 years of growth in US and plan for week
The publication of statistics on the US labor market was the top story. We warned that the data will come out much worse than forecasts and recommended selling the dollar before the data has been published. Those of our readers who followed the advice should have earned good money. But back to the data. With the forecast of + 175K, in fact, the number of NFP was only + 75K. In addition, wage growth was below the expectations of experts.
This is definitely bad news for the dollar, which is giving the Fed a reason to lower the rate at the meeting to be held next week. In this regard, our recommendations remain unchanged this week - we will look for points for its sales.
At the same time, we cannot but note an important for the US economy anniversary - 10 years in a row of economic growth. Also, this fact is remarkable by the fact that if growth continues for another month, it will be the longest period of economic growth in the United States since 1854 (!). But there was no particular joy among analysts and investors. The aggregate GDP growth for this period has not even grown by half from the growth that was recorded in the period 1991-2001. And investors' fears that growth will stop increasing with each passing day. China, Mexico, the EU and might be Japan. The economic data is a growing concern so far, recall the statistics from ADP or the data on the Manufacturing Purchasing Managers Index from Markit, that in ay dropped to the lowest values since September 2009. As a result, analysts JPMorgan Chase & Co. increased the likelihood of a recession in the United States from 25% to 40% in the second half of 2019.
There are no major events like NFP or announcements of the results of the leading Central Banks, but there will be plenty of statistics on China (trade balance, inflation, industrial production and retail sales), Great Britain (GDP, trade balance, labor market and industrial production) and the USA (inflation, industrial production and retail sales).
As for our trading preferences, they have not changed over the week. And what's the point of changing positions that make a profit? Almost all of our recommendations for last week turned out to be a good plus. So, we will continue to look for points for the sales of the US dollar primarily against the Japanese yen, as well as the euro and the British pound, sales of oil and the Russian ruble, as well as buying of gold.
Jpmorgan

Fair price for Bitcoin, the pound - worst week, artificial oilJPMorgan Chase & Co analysts in connection with the rapid growth of the cryptocurrency market in recent times, and Bitcoin in particular, have thought about the question “what is its fair price?”, so-called intrinsic value. Determining the fundamental cost of cryptocurrency is a very difficult and highly ambiguous question, but considering Bitcoin as a commodity asset, you can simply calculate the amount of the cost of "its production" (electricity, the computing power of computers, equipment depreciation, etc.).
So, according to their calculations, the current price sharply exceeded the “cost price” of Bitcoin. This last happened in 2017. We know the result. Recall, any increase in cryptocurrency should be used for their sales – that is our position.
The pound remains under pressure. Actually, previous week was the worst for the pound since 2017. There was little chance that the Government will accept the deal. And the chair Theresa May is sitting on wobbling quite a lot. According to the polls, the most likely candidate is Boris Johnson. Property prices in the UK are continuing to decline, reflecting the concerns of investors and consumers about the results of Brexit. Given that there is no domestic political unity in the UK, the chances for a positive outcome in the near future are not visible. This means that the pound will continue to be under pressure. Like real estate prices in the country.
Oil price is growing. The reasons are the same - tensions in the Middle East and the potential threat of war with Iran. Despite the fact that the current desire of the market is to buy oil, we recommend looking for points for sales on the intraday basis as well as medium-term. Why? - some artificiality of the current market conditions. OPEC + has limited the offer, but this process is unnatural and at any time in the market may appear 1.2 million b / d above. The current position of Russia, that proposes not to rush to the issue of extending OPEC + after June is playing in its favor. At the same time forecasts for oil demand have become increasingly gloomy lately.
Important macroeconomic statistics will not be published today, so the events will probably continue to evolve in line with current trends.
Our trading positions for today are as follows: we will look for points for buying the euro against the US dollar. Points for selling oil and the Russian ruble and points for buying gold and the Japanese yen.

DARPA/Israel/JP Morgan CoinImagine betting against the jews and not accumulating ZEC and BSV, I would kill myself for being a retarded sheep. Enter on break and retest of 69.2. Target is several thousand USD (dead serious).

$JPM bullish pennant in play$JPM broke out of his bullish pennant and it setting the numbers higher. New ATH incoming?

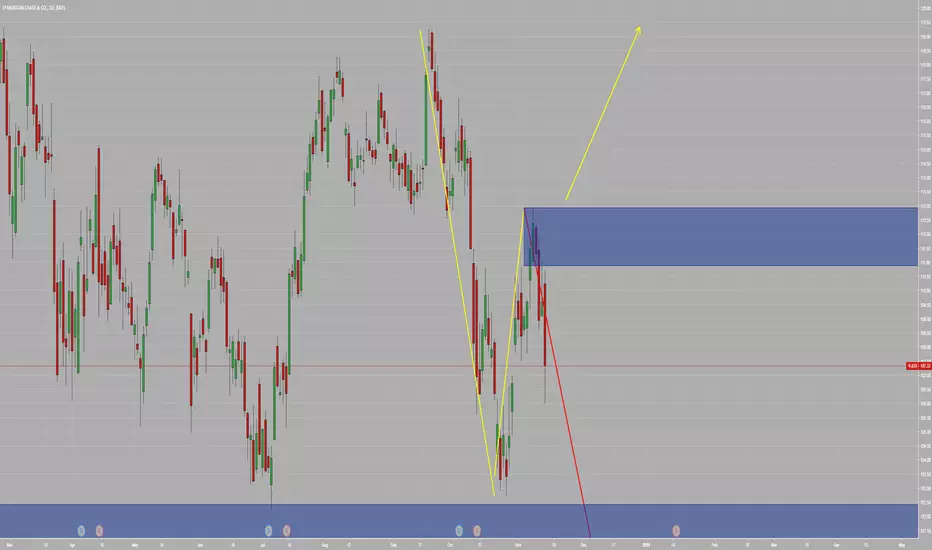
JPMORGAN CHASE (JPM)(NYSE) Sell $113.73 >>> Target $106.74NYSE:JPM
JPMORGAN CHASE & CO
Stock - NYSE (USA)
Profit:Risk = 2.24:1
---
Sell = $113.73
Take Profit = $106.74
Stop Loss = $116.85
------
Take Profit = +6.15%
Stop Loss = -2.74%

Snooze Ville in FOREX, pound’s immunity and China gives hopeIn general, the previous week was relatively calm. As a result, the volatility index of exchange rates, which is calculated by the investment bank JP Morgan, fell to its new minimum since 2014. For instance EURUSD. Since the beginning of 2019(that is already 3.5 months), it has been fluctuating in a range of width less than 400 points (such a range a pair could pass in 3-4 days even without any volatility explosions).
The most likely contenders for the “role” of irritant can only note the start of a full-fledged trade war between the US and the EU.
The main event of the week was another Brexit postponement. In general, the word “another” has already become a prefix to Brexit: the next voting in Parliament, the next failure of May’s plan, the next negotiations, etc. The main result of the appearance of this “prefix” was the development of immunity in pounds for information regarding Brexit. The GBPUSD dynamics of last week is proof of that. Actually, we can hardly expect any breakthroughs this week, that means that the pound will continue to fluctuate without a clear direction. This should be used for active trading with no clear preference, buying a pound on descents and selling after local growth.
Among other events, it is worth noting the publication of the Fed's minutes, as well as the announcement of the results of the ECB meeting (again, nothing new and unexpected).
It is worth paying attention to the block of key data on the Chinese economy (GDP and industrial production). After the next drop in forecasts of the pace of economic development by the IMF, the markets would be very happy to see a positive trend in the economic development of the world economy.
In general, there are reasons for optimism. On Friday, data on China’s trade balance were published, which showed an extreme rise in China’s exports. In addition, a sharp increase in loans showed that measures to stimulate the economy in China seem to be yielding results.
In terms of trading preferences, we start approximately the same as we ended the previous one: we will continue to look for points for selling the dollar in the foreign exchange market (except USDJPY, we are buying it), buying gold and oil in the commodity markets, besides continue to sell the Russian ruble.

JPMorgan: All signs point to impending melt-up in stocksJPMorgan (JPM) reported record earnings last week with strength across all major lines of businesses amid a “more constructive environment”. The stock jumped 4.2%, the biggest one day move since Nov 2016. With a close above the weekly Ichimoku cloud within reach, all signs point to an impending melt-up in stocks.


JPM SELL (JP MORGAN)Hi there. Price is forming a continuation pattern to the downside. Watch strong price action for sell.


JP Morgan BullishThere is a reverse Head and Shoulders pattern, so JPM should go up then deflect off the resistance.

JP Morgan | Earnings Will Be BadLooking at JP Morgans chart.
The SQZ indicator continues to turn hard green. Indicating further down side.
The stock has been ascending on descending volume. Bearish sentiment.
The MacD is about to have a bearish crossover.
The chart follows the bearish sentiment that is seen across the market.

JP MORGAN CHASE & CO. (JPM): A Lower Low To The Next Support?Find Winning Trades In Seconds >> efcindicator.com (Special Discount)
We are about to start the subwave of wave 5. Keep an eye on RSI and MFI to get the best timing for entry.


JP Morgan double topDouble top with great RSI divergence, triggered through 100SMA and neckline, MPO shows target at 86, also 50% fib and where the 3rd touch on the uptrend line could happen. Currently closed Friday at 38.2%. Still holding short, potential long when 50% fib is hit. 200SMA is coming up to it as well.
Technically one of the best stock charts I have seen, as it is also a huge percentage of the DOW, helping to forecast its movement, their charts are very symmetrical.


JPM Defensive stock!Warren Buffett’s Berkshire Hathaway (BRK-A, BRK-B) just revealed its recent stock moves and the “Oracle of Omaha” is making a big bet on financials.
During the third quarter, Berkshire Hathaway snapped up a new position in JPMorgan Chase (JPM) of 35.6 million shares, making it the 10th largest stock holding.
It’s notable because the 88-year-old investor has publicly praised JPMorgan’s CEO Jamie Dimon for years, but had not owned the stock. A huge fan of Dimon’s annual letter, Buffett told Yahoo Finance’s editor-in-chief earlier this year that he made a “mistake” not investing in the bank’s stock.
“I should’ve ,” Buffett said at the time. “Very obviously. I mean, it’s been a terrifically run operation. And it was very cheap, just like a number of others were.”
JPM - POTENTIAL EXPANDING CORRECTION ON THE MAKINGJPM seems in the middle of a long term correction. It could be an expanding triangle or a flat correction. Look to the price action on the lower channel for a potential bounce.

JPM Set to Bounce After EarningsJPM reached a support level consistent with a trend line dating back to June 2017 and RSI just dropped below 30 - indicating oversold conditions. In addition - JPM is set to benefit from increased interest margin. JPM will also increase it's share buyback program following earnings, which will increase volume and the likelihood of a price increase.

JP MORGAN IS LOOKING BULLISH ON D1* Some indicators are looking bullish on D1
* "TD Count" has been started to count green.
* Cloud is a strong support area for this stock.
Bullish for this week.

Timing the Next Market Top; Don't Wait Too LongI keep narrowing my projection for the top of the market as more days elapse and more data comes in. I have been contrarian to the 'pundits' and still strongly believe the market will top before the end of 2018. I am right now projecting a near-term top to occur by the end of this week or beginning of next week around 2930. This will wrap up intermediate wave 3 which is presently in minor wave 5, minute wave 5.
I have intermediate wave 4 ending down around 2841 around October 5, 2018. After that, the final market top should occur between November 1 and November 16, 2018. The final top should occur slightly above 3000. I initially forecasted the top above 3100, but do not see the top occurring higher than 3070. All of these moves can be monitored in the interactive chart below. The white box was one of my more recent projections, but the green box is my current forecasted zone for the top.
I recently published my article detailing 8 stocks that have been great forecasters of market tops. These symbols indicated the tops in 1987, 2000, and 2008. The full article is free as always at ElliottWaveIdeas.

JPM: Top of range reversal to $106The yield curve is flattening in hurry with the Turkey crisis and that is baaad for US banks. JPM is reversing off the top of a well established channel with MACD confirmation. Downside target of $106 gives a potential 7% return. Do note I am not advocating a straight line decline to the bottom of the range. Moves within channels are generally ABCD formations so trade accordingly. Other mega US banks like BAC and WFC are exhibiting roll-overs from lower highs with similar risk reward profiles so there are a few options out there.
