USDJPY Downtrend USD/JPY is currently in a strong downtrend, indicating a bearish market sentiment. The pair continues to follow the descending trendline, respecting lower highs and lower lows, which confirms the ongoing downward momentum.
Bearish Scenario: Trend Continuation
First Key Support – 148.100
This level serves as a major support zone where price could find temporary consolidation or a minor pullback.
If price breaks below 148.100 with strong bearish pressure, further downside is expected.
Next Major Support – 142.000
A clean break and close below 148.100 could accelerate selling pressure.
The next critical level to watch is 142.000, a strong historical support zone and a psychological level.
If this level is reached, the bearish trend will likely extend further.
Bullish Scenario: Trendline Breakout
If USD/JPY breaks above the descending trendline, it may signal a potential trend reversal or retracement.
The key resistance to watch for a breakout is 151.300, which acts as a strong support-turned-resistance level.
Jpy

AUD/JPY: Counter-trend bull flag in focusI have outlined my bearish case for AUD/JPY for the year in prior articles and videos, but today I want to look at a potential countertrend setup.
A bull flag is forming on the daily chart. Usually I'd prefer to see such patterns during a strong uptrend as a continuation pattern. But given we saw a false break of an elongated bullish pinbar and sharp reversal higher, I suspect there is at least one more leg higher brewing for AUD/JPY. And because this is counter trend to my core bearish bias, I am not seeking the usual flag projection target, and instead will be happy with a more conservative reward if successful.
Prices are holding above the 10-day ERMA and weekly pivot point, but bulls could also seek dips towards the high-volume node (HVN) at 95.11 or around the 98 handle.
Bulls could target the 97 handle, with a break above 97.20 brining the weekly R1 into focus just below 98.
Matt Simpson, Market Analyst at City Index and Forex.com

GBPJPY: Channel Down on its new bullish wave.GBPJPY is bearish on its 1D technical outlook (RSI = 41.292, MACD = -0.960, ADX = 36.514) as since the February 13th LH and rejection near the 1D MA50, it was been on its new bearish wave. The 1D RSI doesn't give a buy signal until it hits its S1 Zone, so we remain bearish on this pair with a typical TP = 185.500, unless the RSI hits S1 first, in which case you'll be encouraged to take profit earlier.
## If you like our free content follow our profile to get more daily ideas. ##
## Comments and likes are greatly appreciated. ##

Bullish rise?AUD/JPY is falling towards the support level which is a pullback support that lines up with the 61.8% Fibonacci projection and could bounce from this level to our take profit.
Entry: 94.65
Why we like it:
There is a pullback support level that aligns with the 61.8% Fibonacci projection.
Stop loss: 93.88
Why we like it:
There is a pullback support level that lines up with the 78.6% Fibonacci projection.
Take profit: 96.15
Why we like it:
There is an overlap resistance level that is slightly below the 61.8% Fibonacci retracement.
Enjoying your TradingView experience? Review us!
Please be advised that the information presented on TradingView is provided to Vantage (‘Vantage Global Limited’, ‘we’) by a third-party provider (‘Everest Fortune Group’). Please be reminded that you are solely responsible for the trading decisions on your account. There is a very high degree of risk involved in trading. Any information and/or content is intended entirely for research, educational and informational purposes only and does not constitute investment or consultation advice or investment strategy. The information is not tailored to the investment needs of any specific person and therefore does not involve a consideration of any of the investment objectives, financial situation or needs of any viewer that may receive it. Kindly also note that past performance is not a reliable indicator of future results. Actual results may differ materially from those anticipated in forward-looking or past performance statements. We assume no liability as to the accuracy or completeness of any of the information and/or content provided herein and the Company cannot be held responsible for any omission, mistake nor for any loss or damage including without limitation to any loss of profit which may arise from reliance on any information supplied by Everest Fortune Group.

AUDJPY INTRADAY Downtrend capped by 96.30The AUDJPY currency pair price action sentiment appears bearish, supported by the longer-term prevailing downtrend. The recent oversold bounceback is retesting major resistance at 95.47 (intraday swing low).
The key trading level is at 96.30, which is the current swing high and falling resistance trendline level. An oversold rally from the current levels and a bearish rejection from the 96.30 level could target the downside support at 94.43 followed by 94.10 and 93.55 levels over the longer timeframe.
Alternatively, a confirmed breakout above 96.30 resistance and a daily close above that level would negate the bearish outlook opening the way for further rallies higher and a retest of 96.90 resistance followed by 97.70 levels.
This communication is for informational purposes only and should not be viewed as any form of recommendation as to a particular course of action or as investment advice. It is not intended as an offer or solicitation for the purchase or sale of any financial instrument or as an official confirmation of any transaction. Opinions, estimates and assumptions expressed herein are made as of the date of this communication and are subject to change without notice. This communication has been prepared based upon information, including market prices, data and other information, believed to be reliable; however, Trade Nation does not warrant its completeness or accuracy. All market prices and market data contained in or attached to this communication are indicative and subject to change without notice.

EURJPY forming a bottom?EURJPY - 24h expiry
Posted a Bullish Hammer Bottom on the 4 hour chart.
Bullish divergence can be seen on the 4 hour chart (the chart makes a lower low while the oscillator makes a higher low), often a signal of exhausted bearish momentum, or at least a correction higher.
This is positive for short term sentiment and we look to set longs at good risk/reward levels for a further correction higher.
Further upside is expected although we prefer to buy into dips close to the 156.97 level.
Although the anticipated move higher is corrective, it does offer ample risk/reward today.
We look to Buy at 156.75 (stop at 155.72)
Our profit targets will be 159.47 and 160.55
Resistance: 159.10 / 160.55 / 162.00
Support: 154.40 / 151.10 / 149.30
Risk Disclaimer
The trade ideas beyond this page are for informational purposes only and do not constitute investment advice or a solicitation to trade. This information is provided by Signal Centre, a third-party unaffiliated with OANDA, and is intended for general circulation only. OANDA does not guarantee the accuracy of this information and assumes no responsibilities for the information provided by the third party. The information does not take into account the specific investment objectives, financial situation, or particular needs of any particular person. You should take into account your specific investment objectives, financial situation, and particular needs before making a commitment to trade, including seeking advice from an independent financial adviser regarding the suitability of the investment, under a separate engagement, as you deem fit.
You accept that you assume all risks in independently viewing the contents and selecting a chosen strategy.
Where the research is distributed in Singapore to a person who is not an Accredited Investor, Expert Investor or an Institutional Investor, Oanda Asia Pacific Pte Ltd (“OAP“) accepts legal responsibility for the contents of the report to such persons only to the extent required by law. Singapore customers should contact OAP at 6579 8289 for matters arising from, or in connection with, the information/research distributed.

GBPJPY it is bullishhello guys!
I believe this pair is bullish. However, it has touched the top line of the channel, and we can assume a correction!
but the target of the long position is the blue area!
it is up to you to get a long position in the purple area or sooner!

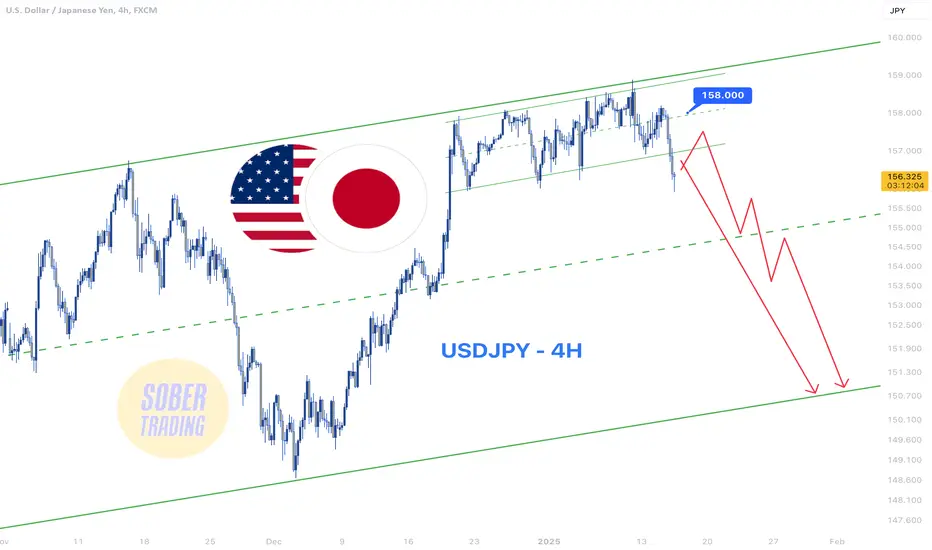
USDJPY - 4H Short Opportunities Amid DowntrendFollowing the sharp fall in FX:USDJPY after PPI and CPI news, we expect further downside, potentially reaching the middle or bottom of the channel. 📉
Each push-up could be a short entry opportunity. Even a strong rise below 158 might be a dead cat bounce and a better short entry point. Stay cautious and strategic! 🔻
GBP/JPY - Triangle Breakout (Weekly Forecast Feb 24-28)The GBP/JPY Pair on the H4 timeframe presents a Potential Selling Opportunity due to a recent Formation of a Triangle Breakout Pattern. This suggests a shift in momentum towards the downside in the coming hours.
Possible Short Trade:
Entry: Consider Entering A Short Position around Trendline Of The Pattern.
Target Levels:
1st Support – 185.04
2nd Support – 182.94
🎁 Please hit the like button and
🎁 Leave a comment to support for My Post !
Your likes and comments are incredibly motivating and will encourage me to share more analysis with you.
Best Regards, KABHI_TA_TRADING
Thank you.

USDJPY: Bullish signal on the 0.5 Fib.USDJPY is almost oversold on its 1D technical outlook (RSI = 32.042, MACD = -1.350, ADX = 47.008), pulling back on a technical retrace inside the long term Channel Up. This bullish wave correction is identical to the 0.5 Fibonacci pullback of December 29th 2023 that also traded on similar RSI levels. We expect the price to start recovering now and aim at the 1.382 Fibonacci. Go long, TP = 166.300.
## If you like our free content follow our profile to get more daily ideas. ##
## Comments and likes are greatly appreciated. ##

Bearish drop?USD/JPY is rising towards the pivot which is a pullback resistance that aligns with the 38.2% Fibonacci retracement and could drop to the 1st support which acts as a pullback support.
Pivot: 151.27
1st Support: 149.66
1st Resistance: 152.64
Risk Warning:
Trading Forex and CFDs carries a high level of risk to your capital and you should only trade with money you can afford to lose. Trading Forex and CFDs may not be suitable for all investors, so please ensure that you fully understand the risks involved and seek independent advice if necessary.
Disclaimer:
The above opinions given constitute general market commentary, and do not constitute the opinion or advice of IC Markets or any form of personal or investment advice.
Any opinions, news, research, analyses, prices, other information, or links to third-party sites contained on this website are provided on an "as-is" basis, are intended only to be informative, is not an advice nor a recommendation, nor research, or a record of our trading prices, or an offer of, or solicitation for a transaction in any financial instrument and thus should not be treated as such. The information provided does not involve any specific investment objectives, financial situation and needs of any specific person who may receive it. Please be aware, that past performance is not a reliable indicator of future performance and/or results. Past Performance or Forward-looking scenarios based upon the reasonable beliefs of the third-party provider are not a guarantee of future performance. Actual results may differ materially from those anticipated in forward-looking or past performance statements. IC Markets makes no representation or warranty and assumes no liability as to the accuracy or completeness of the information provided, nor any loss arising from any investment based on a recommendation, forecast or any information supplied by any third-party.

USDJPY Potential DownsidesHey Traders, in today's trading session we are monitoring USDJPY for a selling opportunity around 149.900 zone, USDJPY is trading in a downtrend and currently is in a correction phase in which it is approaching the trend at 149.900 support and resistance area.
Trade safe, Joe.

Why Morgan Stanley and MUFG back JPY? Morgan Stanley and MUFG both see the Japanese yen as the strongest G10 currency in 2025. They expect it to gain value as U.S. interest rates fall and Japan’s central bank raises its own.
On the daily chart, USD/JPY oscillators are still away from being in the oversold zone, suggesting that the path of least resistance could to the downside.
MUFG predicts further yen gains, especially against the euro, and has set a target of 150 for EUR/JPY, down from 157.
Morgan Stanley also favors the Australian dollar. Meanwhile they believe the New Zealand dollar will appreciate but underperform the Australian dollar due to a weaker domestic outlook.

Bullish bounce off overlap support?USD/JPY is falling towards the pivot which is an overlap support that aligns with the 138.2% Fibonacci extension and the 50% Fibonacci retracement and could bounce from this level to our take profit.
Entry: 149.37
Why we like it:
There is an overlap support that aligns with the 50% Fibonacci retracement and the 138.2% Fibonacci extension.
Stop loss: 147.14
Why we like it:
There is a pullback support level that aligns with the 61.8% Fibonacci retracement.
Take profit: 151.27
Why we like it:
There is a pullback resistance level.
Enjoying your TradingView experience? Review us!
Please be advised that the information presented on TradingView is provided to Vantage (‘Vantage Global Limited’, ‘we’) by a third-party provider (‘Everest Fortune Group’). Please be reminded that you are solely responsible for the trading decisions on your account. There is a very high degree of risk involved in trading. Any information and/or content is intended entirely for research, educational and informational purposes only and does not constitute investment or consultation advice or investment strategy. The information is not tailored to the investment needs of any specific person and therefore does not involve a consideration of any of the investment objectives, financial situation or needs of any viewer that may receive it. Kindly also note that past performance is not a reliable indicator of future results. Actual results may differ materially from those anticipated in forward-looking or past performance statements. We assume no liability as to the accuracy or completeness of any of the information and/or content provided herein and the Company cannot be held responsible for any omission, mistake nor for any loss or damage including without limitation to any loss of profit which may arise from reliance on any information supplied by Everest Fortune Group.

Bearish drop?EUR/JPY has broken out of the pivot and could drop to the 1st support which acts as a pullback support.
Pivot: 157.19
1st Support: 155.60
1st Resistance: 158.37
Risk Warning:
Trading Forex and CFDs carries a high level of risk to your capital and you should only trade with money you can afford to lose. Trading Forex and CFDs may not be suitable for all investors, so please ensure that you fully understand the risks involved and seek independent advice if necessary.
Disclaimer:
The above opinions given constitute general market commentary, and do not constitute the opinion or advice of IC Markets or any form of personal or investment advice.
Any opinions, news, research, analyses, prices, other information, or links to third-party sites contained on this website are provided on an "as-is" basis, are intended only to be informative, is not an advice nor a recommendation, nor research, or a record of our trading prices, or an offer of, or solicitation for a transaction in any financial instrument and thus should not be treated as such. The information provided does not involve any specific investment objectives, financial situation and needs of any specific person who may receive it. Please be aware, that past performance is not a reliable indicator of future performance and/or results. Past Performance or Forward-looking scenarios based upon the reasonable beliefs of the third-party provider are not a guarantee of future performance. Actual results may differ materially from those anticipated in forward-looking or past performance statements. IC Markets makes no representation or warranty and assumes no liability as to the accuracy or completeness of the information provided, nor any loss arising from any investment based on a recommendation, forecast or any information supplied by any third-party.

GBP/JPY Triangle Pattern (14.2.25)The GBP/JPY Pair on the M30 timeframe presents a Potential Selling Opportunity due to a recent Formation of a Triangle Pattern. This suggests a shift in momentum towards the downside in the coming hours.
Possible Short Trade:
Entry: Consider Entering A Short Position around Trendline Of The Pattern.
Target Levels:
1st Support – 189.83
2nd Support – 188.42
🎁 Please hit the like button and
🎁 Leave a comment to support for My Post !
Your likes and comments are incredibly motivating and will encourage me to share more analysis with you.
Best Regards, KABHI_TA_TRADING
Thank you.

NZD/JPY - H1 Chart - Trendline Breakout (18.02.2025)The NZD/JPY Pair on the H1 timeframe presents a Potential Selling Opportunity due to a recent Formation of a Trendline Breakout Pattern. This suggests a shift in momentum towards the downside in the coming hours.
Possible Short Trade:
Entry: Consider Entering A Short Position around Trendline Of The Pattern.
Target Levels:
1st Support – 86.00
2nd Support – 85.60
🎁 Please hit the like button and
🎁 Leave a comment to support for My Post !
Your likes and comments are incredibly motivating and will encourage me to share more analysis with you.
Best Regards, KABHI_TA_TRADING
Thank you.

Could the price bounce from here?AUD/JPY is falling towards the support level which is a pullback support that is slightly below the 50% Fibonacci retracement and could bounce from this level to our take profit.
Entry: 95.69
Why we like it:
There is a pullback support level that is slightly below the 50% Fibonacci retracement.
Stop loss: 95.06
Why we like it:
There is a pullback support level that is slightly above the 78.6% Fibonacci retracement.
Take profit: 96.62
Why we like it:
There is a pullback resistance level.
Enjoying your TradingView experience? Review us!
Please be advised that the information presented on TradingView is provided to Vantage (‘Vantage Global Limited’, ‘we’) by a third-party provider (‘Everest Fortune Group’). Please be reminded that you are solely responsible for the trading decisions on your account. There is a very high degree of risk involved in trading. Any information and/or content is intended entirely for research, educational and informational purposes only and does not constitute investment or consultation advice or investment strategy. The information is not tailored to the investment needs of any specific person and therefore does not involve a consideration of any of the investment objectives, financial situation or needs of any viewer that may receive it. Kindly also note that past performance is not a reliable indicator of future results. Actual results may differ materially from those anticipated in forward-looking or past performance statements. We assume no liability as to the accuracy or completeness of any of the information and/or content provided herein and the Company cannot be held responsible for any omission, mistake nor for any loss or damage including without limitation to any loss of profit which may arise from reliance on any information supplied by Everest Fortune Group.

USDJPY Potential DownsidesHey Traders, in today's trading session we are monitoring USDJPY fora selling opportunity around 151.800 zone, USDJPY is trading in a downtrend and currently is in a correction phase in which it is approaching the trend at 151.800 support and resistance area.
Trade safe, Joe.

AUDJPY Sell signal below the 4H MA50.The AUDJPY pair has been trading within a Bearish Megaphone and is currently going sideways within the 4H MA200 (orange trend-line) and 4H MA50 (blue trend-line). Every time the latter broke to the downside, the pattern started its new Bearish Leg.
Assuming it hits at least the 1.236 Fibonacci extension like the first Bearish Leg, we are looking at a short-term Target of 93.750, if the 4H MA50 breaks.
-------------------------------------------------------------------------------
** Please LIKE 👍, FOLLOW ✅, SHARE 🙌 and COMMENT ✍ if you enjoy this idea! Also share your ideas and charts in the comments section below! This is best way to keep it relevant, support us, keep the content here free and allow the idea to reach as many people as possible. **
-------------------------------------------------------------------------------
Disclosure: I am part of Trade Nation's Influencer program and receive a monthly fee for using their TradingView charts in my analysis.
💸💸💸💸💸💸
👇 👇 👇 👇 👇 👇

Heading into 50% Fibonacci resistance?USD/JPY is rising towards the pivot and could drop top the 1st support.
Pivot: 152.85
1st Support: 151.21
1st Resistance: 153.74
Risk Warning:
Trading Forex and CFDs carries a high level of risk to your capital and you should only trade with money you can afford to lose. Trading Forex and CFDs may not be suitable for all investors, so please ensure that you fully understand the risks involved and seek independent advice if necessary.
Disclaimer:
The above opinions given constitute general market commentary, and do not constitute the opinion or advice of IC Markets or any form of personal or investment advice.
Any opinions, news, research, analyses, prices, other information, or links to third-party sites contained on this website are provided on an "as-is" basis, are intended only to be informative, is not an advice nor a recommendation, nor research, or a record of our trading prices, or an offer of, or solicitation for a transaction in any financial instrument and thus should not be treated as such. The information provided does not involve any specific investment objectives, financial situation and needs of any specific person who may receive it. Please be aware, that past performance is not a reliable indicator of future performance and/or results. Past Performance or Forward-looking scenarios based upon the reasonable beliefs of the third-party provider are not a guarantee of future performance. Actual results may differ materially from those anticipated in forward-looking or past performance statements. IC Markets makes no representation or warranty and assumes no liability as to the accuracy or completeness of the information provided, nor any loss arising from any investment based on a recommendation, forecast or any information supplied by any third-party.

Bearish drop off pullback resistance?EUR/JPY is rising towards the pivot which is a pullback resistance and could drop to the 61.8% Fibonacci support.
Pivot: 159.52
1st Support: 157.81
1st Resistance: 160.99
Risk Warning:
Trading Forex and CFDs carries a high level of risk to your capital and you should only trade with money you can afford to lose. Trading Forex and CFDs may not be suitable for all investors, so please ensure that you fully understand the risks involved and seek independent advice if necessary.
Disclaimer:
The above opinions given constitute general market commentary, and do not constitute the opinion or advice of IC Markets or any form of personal or investment advice.
Any opinions, news, research, analyses, prices, other information, or links to third-party sites contained on this website are provided on an "as-is" basis, are intended only to be informative, is not an advice nor a recommendation, nor research, or a record of our trading prices, or an offer of, or solicitation for a transaction in any financial instrument and thus should not be treated as such. The information provided does not involve any specific investment objectives, financial situation and needs of any specific person who may receive it. Please be aware, that past performance is not a reliable indicator of future performance and/or results. Past Performance or Forward-looking scenarios based upon the reasonable beliefs of the third-party provider are not a guarantee of future performance. Actual results may differ materially from those anticipated in forward-looking or past performance statements. IC Markets makes no representation or warranty and assumes no liability as to the accuracy or completeness of the information provided, nor any loss arising from any investment based on a recommendation, forecast or any information supplied by any third-party.

Bearish drop?CAD/JPY is reacting off the pivot and could drop to he 1st support.
Pivot: 107.28
1st Support: 106.21
1st Resistance: 108.28
Risk Warning:
Trading Forex and CFDs carries a high level of risk to your capital and you should only trade with money you can afford to lose. Trading Forex and CFDs may not be suitable for all investors, so please ensure that you fully understand the risks involved and seek independent advice if necessary.
Disclaimer:
The above opinions given constitute general market commentary, and do not constitute the opinion or advice of IC Markets or any form of personal or investment advice.
Any opinions, news, research, analyses, prices, other information, or links to third-party sites contained on this website are provided on an "as-is" basis, are intended only to be informative, is not an advice nor a recommendation, nor research, or a record of our trading prices, or an offer of, or solicitation for a transaction in any financial instrument and thus should not be treated as such. The information provided does not involve any specific investment objectives, financial situation and needs of any specific person who may receive it. Please be aware, that past performance is not a reliable indicator of future performance and/or results. Past Performance or Forward-looking scenarios based upon the reasonable beliefs of the third-party provider are not a guarantee of future performance. Actual results may differ materially from those anticipated in forward-looking or past performance statements. IC Markets makes no representation or warranty and assumes no liability as to the accuracy or completeness of the information provided, nor any loss arising from any investment based on a recommendation, forecast or any information supplied by any third-party.
