somewhat foolproof high leverage (>25x) trading plan exampleThe idea is simple. look for key moment in a chart where large consolidation is coming to a head.
most recently we had this occur.
multi month triangle coming to a head.
bulls...
thinking we would break out of the consolidating triangle and ignite a new bull run.
3 apparent higher lows on the daily.
fundamentals getting stronger every day
institutional investors AND governments acknowledging keen interest and excitement
bears...
weekly macd bear cross below 0 line
below all major daily MAs
just closed two consecutive weeks below 50 weekly MA
this is just a sampling of technical indicators. we could add more to both sides.
regardless, it doesn't matter which one happens. Here's how you win no matter what.
as the consolidation approaches an apex, you get the opportunity to margin short and long at the same time .
consider the following.
You have $2k available for a trade. $1k for long and $1k for short.
wait until consolidation get's tight. look for the spread between the lower highs and the higher lows to get below 4%
Looking at the LIGHT green
after multiple HL and LHs, this a is a GREAT long and short entry for 25x, 50x, 100x. These options are likely NOT the entire of the HL and LHs, which is really good for possibly NOT getting margin called on your losing trade.
If you manage to get both long and short entered, wait a bit and let the triangle continue to form. stop loss BELOW our entry significantly. basically if you got an entry near the supporting triangle trend it may back test it, place stops below that. you might lose a significant portion of your trade. deal with it, this is margin trading. Now that the price has drifted from your entry, place stops at break even.
as the triangle reaches it's apex...its going to pop eventually. One of your 50x positions will be in a sick position for major profit, and the other will have closed (hopefully for little/no loss)
DARK green
You're late to the game, but same theory applies. open high leverage longs/shorts on triangle bounce. riskier here because you are expecting the triangle to break soon.
WHY is it somewhat?
of course nothing is perfect. and we have seen once or twice the whales clear out shorts AND longs in one sick up/down.
but this gives you a very good chance to have a live high margin trade. it just costs double then the advertised collateral.
Leverage

SHORT ADA (Cardano) at 2747We got a new signal for your guys !
Short position on ADA, 8x leverage.
Entry zone: 2757 to 2747
Target 1: 2723
Target 2: 2701
Target 3: 2680
Target 4: 2655
Target 5: 2630
Stop-Loss: 2805

Short BCH call at 10x leverage !New Bitmex call on BCH !
10x leverage
SHORT between 0.1510 to 1502
Target 1: 0.1492
Target 2: 0.1481
Target 3: 0.1467
Target 4: 0.1451
Stop-Loss: 0.1529

Sitting on a major trend line right now. Sitting on a major trend line support/resistance level right now. Hopeful for a break back up to retest 7599 but set my stop accordingly. prepared for a hard dip but still hopeful we'll remain bullish. could be a turning point within this hour. 7520 will either as strong support or immediately be broken. looks to be a cup and handle forming.


BTC/USD Bitfiniex - Still following that E wave? ManWell shit, I just started incorporating elliot wave's into my charting a little more heavily recently. I usually trade off volume and level, however recently elliot's have been helping in confirmation in more of my swing type leverage trades.

Today's Lesson (#4) : Adjusting the leverage to volatilityIn this educational content video I had to cover one the biggest noob trader mistake, trading with too much leverage.
That's basically what flushes out almost 80% of the noobs. Getting the margin call, putting more money into trading than you initially expexted.
All of this is well known as gambling problems. And the recent flow of beginners who went to the markets with hopes of easy gains, most are now feeling the painful experiment of what the market is doing to fools.
So I hope you'll learn something important today with that lesson. Cause if you don't, then you'll probably have to learn it the hard ways later...

Bitcoin Projections: Recognizing the Breakout PointsHello Traders,
Going to be quick with the intro and summary here as this is a short term play and just shows where you can recognize the breakout points for a short term bull run or short term bear run. Overall Im leaning towards a correction to 8700/8600 ideally, and then an attempt over a mid term time frame to 11,600.
Hope this chart helps you recognize where you can recognize critical plays/breaks and profit from them.
As always, this is not financial advice and make sure to do your own ta/research. Thanks
Crypto Hippo is the Name. You can find me on Youtube, Twitter, Facebook, etc.
My partner and I have put together a wonderful and fast growing community in discord that brings EVERYTHING crypto to one central location. We'll be doing live streaming trades soon so come partake in the profits.
Join the channel free at www.thecryptoblend.com
If you bring a friend we will give you lifetime premium access for FREE! Just message an Admin when you've invited someone and will validate it. You MUST use the invite referral link at the top left of the channel when you enter, under The Crypto Blend Tab --- Invite People --- Copy Link

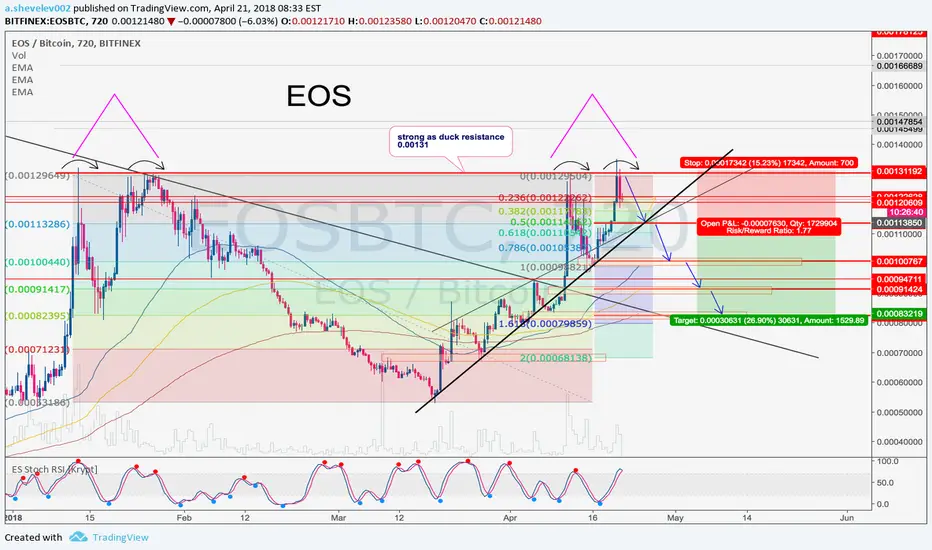
EOS Trend Should be Broken! DROP EOS to the bottom!Hello!
I know there is a lot of EOS holders and Believers, lets check what chart says: 0.00129 looks like Strong as Duck Resistance, and it reversing from it 4 times, and now, moving to trend line>> I expect breakout from uptrend and going down to 0.5 0.382 Fibonacci levels.
Short Sell trade:
Entry: After trend breakout 0.00113
Take Profit:
0.00100
0.00091
0.00082
Stop Loss: 0.00131
Good luck on trade!

$BTC strength looking paper thin in the short term.It's all on the chart. Quick afternoon update. $BTC

FibResistance+TrendResistance+Hpattern+OversoldishRSI=greattradeas we can see here we have a good trade set up with price already starting to bounce back down from .618 clear and tested Fibonacci retracement resistance as well as just normal trend resistance. This is not a continuation trade breakout it looks like. The RSI is coming close to oversold and not forcefully so. It looks likely to break down on its own resistance as well. If you want to be safe wait for that to happen. There is also a very clear butterfly pattern. overall this is likely a continuation pattern but the breakout does not seem likely to be at this test of resistance. The Euro is also losing ground against the GBP and the euro does not have serious movement on other currencies as of this time. This is a high probability trade 7% trade possible if using very healthy amounts of leverage and only risking two percent of account. I personally only risk 1.7% per trade because just this small drop severely limits the likelihood of large drawdowns mathematically.
Leave a like if you agree. If you don't or if you have feedback comment down below.

xrp short term playHowsit boys and girls, ladies and gentleman, lets take a look at BITMEX:XRPH18 . we can see a massive long term downtrend creating resistance that is holding strong. We have a symmetrical triangle and a descending traingle both reaching breakout point. Using a 1x leverage will yield you a nice return with your stop loss placed just below at the support from the previous 9 of the td indicator
For now im bullish waiting on confirmation of the breakout
If you found value in either my predictions or my analysis as a means to learn, please follow and like and share. If you didnt, please keep it to yourself its rude to gossip.
Cryptodad out!


XmrUSD Short Term Long XMRZ17 reference alsoChart speaks for itsself
abc correction
now elliot impulse wave forming
small time frame show developing bullish ema
rsi bounced off its support also and is beginning uptrend
THIS IS THE ANALYSIS I WILL BE USING TO TRADE THE $XMRZ17


BTC Leverage Trade 11-16Obvious divergence coming on the 15m, look for a snipe at the Bolinger Band. Or enter long when a spike of bulls come in on the 3m.
Take profit with 15m bearish divergence - will update.

Buy DASH BTC (Long term or Leveraged Entry)Alright guys. Been working and backtesting this. There's so much money to be made, and the opportunity to flip accounts quickly and safely are at an all time high, thanks to the de-centralized and mostly unmanipulated marketplace, making the market (charts) very transparent for the experienced technical trader.
So with any trade there's a couple simple principles EVERYONE looks at when determining a trade.
Market Structure
Retracements from a recent obvious high or low
Bulls vs Bears
Bulls vs Bears explained: The more and more I look through charts, in this case the very bullish crypto charts, there is a give in take. When a sign that the sellers want to come in and take their profits, the major bullish players throughout the world will take notice and allow the bears to take their profits. It's the only way to maintain a healthy give and take market. Especially in a healthy bullish market, which is definitely where we are at right now.
PLEASE NOTEAlso, there is one final confirmation before price heads back towards the previous high. Once EVERYTHING has been accounted for when looking for a buy (Price hit it's natural retrace point. Bearish market structure is broken. Buyers show up. And when the sellers DON'T show up) This confirmation is a bullish engulfing candle reversal on top of the 10 ema. This is a powerful long term play that works really quite well on the Weekly and Daily and even 4h timeframes. And, you can choose to have a tight stop loss... a little more risky, but the returns are much greater, even in the long run. One more thing on this signal, it must be OBVIOUS that price wants to chill and stay closed above the 10 ema.
DASH BTC 6-29-17
Now that I have kinda emptied my head, let's get into what I see here in DASH :)
(I apologize for the tight screenshot of the Daily. Gotta make that money to get a sweet setup.)
On the DAILY:
First, please refer to your own naked daily chart of DASH. This is all a learning process guys, and we need to work together to dominate this game.
We had a very obvious rise, and a very obvious retracement, which is where price is at now. During the retracement, price quickly came to a point that the buyers would not let the bears pass. Enough time has now passed for the bears to notice, and to take profit ASAP. Now we had just made a little new high (shown on my screenshot). So this is where I would look to take a long term entry.
But I like to be specific. Let's wait for confirmation on the retracement and we can get a perhaps perfect entry, and have a tighter, more specific stop loss.
On this little retracement, it made a W towards the ultimate bullish trend. And, it happened to be divergent. (Rsi, tdi) Divergent and OBVIOUS M's and W's on retracements towards the peak formation are probably the strongest tells of a trade.
There's also another way of looking at this, and I want some of you to look for it too.
On this little retracement shown on the Daily screenshot, it made two perfect bullish candle formations touching and closing consistently above the 10ema that look FUCKING PRETTY. This is the maybe number one sign that the bears are mostly out of the game and the bulls can take their trades.
Boom. Take the trade. Long term.
And for risk takers, like me, here is a possible way to start making more money or btc or whatever.
Once you have all the confirmations on the Weekly or Daily, take a 4h entry as well, with a 4h SL, and look to take a 1:2 or 1:3 profit based on your risk/Stop loss.
Here on the right, After it made it's W towards the upside on first rise that broke market structure on the daily, we need a new high made on the 4h, and an obvious candle reversal against the 10 EMA
This is an opportunity to take a 4h entry on a Daily trade. You can have your SL a below the most recent red candle on the screenshot. Upto you. Actually, putting it at or below the 50EMA looks to be a good option.
Take profit 2x or 3x your risk. This is at least a 75%+ trade.

Short till bullish trend?-OILBreak of 15min bullish trend. Now is testing support level at 52.70, if prices breaks it, we can project price till the next support level(52.10-52.20)

Leveraged ETF pairs: Time decayThis is more of an educational post, but it also serves as a trading idea.
Costs of derivatives and manager fees make leveraged ETFs have a dangerous time decay. If trading for periods longer than a day, these kick in. How badly they impair performance depends on the volatility of the underlyings, so be careful when trading these. A more clearly trending underlying makes for a safer leveraged play, so, instruments like QLD/QID aren't as affected by this.
You can observe how being short both sides of the coin, can produce a downtrend in the chart, and thus, a safe long term short.
Be careful when trading these for longer than a day, and if trading QLD, or QID, be careful with trades held for longer than a month, or a quarter (I estimate that is for how long they can outperform QQQ).
Cheers,
Ivan Labrie.

Leveraged Decay: how to calculate itBrexit and currency hedging has thrown up the need for products such as SUP3 however there is danger in holding such leveraged products as SUP3 (3X Long GBP Short EUR). As path dependency of the currency picks up in volatility the arithmetic mean drifts below the geometrical mean.
This is most easily realised in the following example of an up and down fluctuation of 10%:
100 +10% = 110
110 - 10% = 99
We have lost 1% due to the path dependency having only moved up and down 10%
We can approximate the volatility drag using the following:
Volatility Drag = 0.5 * (Leverage) * (Standard Deviation) ^2
This comes from the formula for the geom mean:
Geom Mean = Arith Mean - 0.5 * SD^2
It is not precise but allows a proxy to be formed!

Why Most Forex Traders Fail... LEVERAGEWay too many traders trade with very little capital and they do this because their brokers allow them to by offering them insane amounts of leverage. We really don't understand it because you would think that these brokers would want their clients to succeed in order to continue placing trades which yields the broker revenue from commissions and spreads. It is inevitable that with such little capital ($50-$100) these traders will go bust and blow their accounts, especially if they are allowed to take position sizes of upwards of 500 times their account value. These retail traders have been conditioned to believe that this is the way Forex trading is and quite frankly it isn't. The most successful Forex traders in the game use little to NO leverage at all and they only return a small consistent return of 1-3% per month. It seems impossible to make money with such small returns but if you actually take the time to break out a calculator and calculate how much such a return yields over extended periods of time like 5 years or 10 years you will see it is immense. Take $10,000... in 8 years with a consistent 5% a month return... that $10,000 will become $1,000,000.
So please guys read through the information on the chart. It is long but it is very valuable!
Tune in LIVE on YouTube goo.gl every Monday, Wednesday, and Friday at 7 P.M. Eastern Standard Time to learn how to trade the Forex market like a professional!
Follow us on our social media:
Website: goo.gl
Google+: goo.gl
Twitter: goo.gl
Instagram: goo.gl
Snapchat: Unique4xPro
TradingView: goo.gl

EURUSDmacro money margin market models momentum net offer ofset open order options paid pair patient pips portfolio profit pullback put quoStill waitingte rally range rate realmoney retail risk sector sell settlement short slippage spot stoploss swap swiss takeprofit technical trade trading trader traderslife trend unemployment value volatility wedge work
