LINK/USDT Setup: Structure Break + Fibonacci Confluence🚨 Market Watch: LINK/USDT Analysis 🚨
I'm currently keeping a close eye on LINK/USDT. 🧠 On the daily chart, we've observed a clear break in market structure 📉—and dropping down to the 4H timeframe, we see further confirmation of that shift.
At this point, price is looking a bit overextended 🏃♂️💨, and I’m anticipating a retracement back into equilibrium based on the current price swing 📊. This could set up a high-probability short opportunity 🎯.
📹 In the video, I dive into:
Overall trend direction 🔁
Market structure shifts 📐
Price action breakdown 🕵️♂️
And key support/resistance levels to monitor for target zones 🧱
My stop loss would be positioned just above entry, using around 2x ATR for smart risk control
🛡️. As for targets, we could see moves as wide as 6x ATR—but it's crucial to reference the left side of the chart for confluence 📅📈.
I’m aligning this setup with my Fibonacci retracement strategy, which we also covered in the video 🔢📏.
This is not financial advice. Always trade your own plan. ⚠️📉💼
LINKUSDT

KAVAUSDT UPDATEPattern: Falling Wedge Breakout
Current Price: $0.4567
Target Price: $0.74
Target % Gain: 60.53%
Technical Analysis: KAVA has broken out of a long-term falling wedge on the 1D chart, with strong bullish momentum and price closing above the trendline resistance. This breakout signals potential continuation toward the projected target.
Time Frame: 1D

LINKUSDT.P LONG SIGNSL 1hHello dear traders,
LINK is showing a bullish structure on the 1-hour timeframe, and it has the potential to move toward the liquidity zone around 13.290.
The trade setup is shown on the chart.
Please make sure to manage your risk properly.

LISTAUSDT UPDATELISTAUSDT Technical Setup
Pattern: Falling Wedge Breakout
Current Price: $0.1893
Target Price: $0.30
Target % Gain: 60.04%
Technical Analysis: LISTA has broken out of a falling wedge pattern on the 12H chart with increasing momentum. Price is holding above the breakout trendline, suggesting bullish continuation. A confirmed breakout with volume could push price to the projected target.
Time Frame: 12H
Risk Management Tip: Always use proper risk management.

Link Analysis (12H)Chainlink (LINK) Technical Outlook – Elliott Wave Perspective
After applying Elliott Wave Theory, the chart appears to speak for itself — the downward corrective phase seems to have concluded.
Zooming into lower timeframes, there are several bullish signs suggesting that LINK is primed for an upward move.
Key Technical Reasons Supporting Upside Potential:
Bullish Flag Formation: A clear flag pattern has formed in lower time frames, and LINK is currently testing its resistance level.
Elliott Wave Count: Based on wave structure, Wave 3 appears to be nearing completion. Should we see a short-term pullback, it would likely be Wave 4, offering a strong buy opportunity around the support zone of the flag.
Fib Confluence: The potential retracement aligns perfectly with the 50% Fibonacci level — a typical target area for Wave 4 corrections.
Two Possible Scenarios:
Immediate Breakout: With support from Bitcoin’s continued momentum, LINK could extend its current Wave 3 and break out from the flag without any significant pullback.
Healthy Correction: Alternatively, LINK could retrace to the 50% Fib level before initiating the final leg of Wave 5 — providing a textbook buying opportunity.
Target:
In both scenarios, the upside target remains the same: $18.00 to $18.40 range.
— Thanks for reading.

LINK in coming Weeks ...frankly, Bitcoin will reach $30 in the coming weeks.
Give me some energy !!
✨We spend hours finding potential opportunities and writing useful ideas, we would be happy if you support us.
Best regards CobraVanguard.💚
_ _ _ _ __ _ _ _ _ _ _ _ _ _ _ _ _ _ _ _ _ _ _ _ _ _ _ _ _ _ _ _
✅Thank you, and for more ideas, hit ❤️Like❤️ and 🌟Follow🌟!
⚠️Things can change...
The markets are always changing and even with all these signals, the market changes tend to be strong and fast!!

LINK Trade Setup – Pullback to Support OpportunityChainlink (LINK) is currently testing resistance, and a retracement into the next support zone offers a clean long entry with solid upside potential.
🔹 Entry Zone:
$13.00 – $13.40
🎯 Take Profit Targets:
🥇 $15.00 – $16.00
🥈 $17.00 – $18.00
🛑 Stop Loss:
Just below $12.00

LINK/USDT 4H Chart ReviewHello everyone, let's look at the 4H chart LINK to USDT, in this situation we can see how the price was moving in a downward channel, from which we saw an exit to the top and the formation of a new local uptrend line.
Let's start by defining the targets for the near future that the price has to face:
T1 = 15.08 USD
T2 = 16.87 USD
Т3 = 17.93 USD
Т4 = 19.07 USD
Now let's move on to the stop-loss in case the market continues to fall:
SL1 = 13.98 USD
SL2 = 13.12 USD
SL3 = 11.74 USD
SL4 = 10.76 USD
SL5 = 9.48 USD
If we look at the RSI indicator we can see how the price correction gave a strong rebound on the indicator, which could potentially give strength for new growth.

MAGICUSDT UPDATE
MAGIC Technical Setup
Pattern: Symmetrical Triangle Breakout
Current Price: $0.2253
Target Price: $0.290,
Target % Gain: 30.06%
Technical Analysis: MAGIC has broken out of a symmetrical triangle on the 4H chart with a strong green candle and volume spike, signaling bullish momentum and a potential 30% upside move.
Time Frame: 4H
Risk Management Tip: Always use proper risk management.

Link Long PositionAdded to leveraed longs under 15.050.
Invaladation 14.850
If holds here we can see a push towards 16 and 17.
targeting 16 and 17.
Note: Not a Financial Advice.

LINK/USDT 1H Chart Update Chainlink is riding a strong Rising Channel!
Price action shows clear patternson LINKUSDT
▸ Bullish Doritos at $12.00 & $13.00, pushing the price higher.
▸ Reverse Doritos at $13.00 & $15.00, leading to pullbacks inside Rising Channel.
▸ Key levels to watch: $14.00 (support) and $17.00 (upper resistance).
✉️ As long as LINK stays in the channel, the bulls are in control! Will we see a breakout to $17.00 soon? Let’s discuss!

#LINK/USDT#LINK
The price is moving within a descending channel on the 1-hour frame, adhering well to it, and is heading towards a strong breakout and retest.
We are seeing a bounce from the lower boundary of the descending channel, which is support at 14.30.
We have a downtrend on the RSI indicator that is about to be broken and retested, supporting the upward trend.
We are looking for stability above the 100 moving average.
Entry price: 15.00
First target: 15.30
Second target: 15.61
Third target: 15.94

LINK / USDT: Macro Support Zone ReachedThe price has now reached the upper boundary of the ideal macro support zone for a complex and rare corrective structure (running flat), between 11–8.5.
As long as the price holds above April’s low, my operative scenario assumes that a new multi-year uptrend (wave (3)) has already started.
Key resistance zones to watch ahead: 85–121 (first major resistance) and 150–205/220 as final macro resistance targets.
Full view of the macro structure:
Thank you for your attention and I wish you successful trading decisions!
⸻
Previous trend analysis on LINK:
Nov'24:
Jun'24:
Dec'23:

Taking a look at LINK.This chart looks very interesting and contains many little tidbits of information about potential future outcomes. I see good things coming for LINK in the future.
Good luck, and always use a stop-loss!

Support and Resistance Zone: 14.81-15.82
Hello, traders.
If you "Follow", you can always get new information quickly.
Please click "Boost" as well.
Have a nice day today.
-------------------------------------
(LINKUSDT 1D chart)
In order to continue the uptrend, the price must be maintained above the M-Signal indicator on the 1M chart.
Accordingly, we need to see if it can rise above the Fibonacci ratio of 0.382 (15.82).
Therefore, the key is whether it can rise after receiving support near 14.81.
-
If not, it should fall, and we need to check whether it supports near 12.49.
-
Trading strategies can be created based on whether there is support near the HA-Low and HA-High indicators.
It is not suitable to start trading because it has already risen from the current HA-Low indicator (12.49).
Accordingly, when it receives support near 12.49 and rises to the Fibonacci ratio 0.382 (15.82), you can check whether there is support and start trading.
This trade requires a short and quick response.
Therefore, it is recommended to try to keep the stop loss point.
If it rises above the Fibonacci ratio 0.382 (15.82) and maintains the price,
1st: 19.52
2nd: 23.98
It is expected to rise to the 1st and 2nd above.
-
Thank you for reading to the end.
I hope you have a successful trade.
--------------------------------------------------
- This is an explanation of the big picture.
To check the entire range of BTC, I used TradingView's INDEX chart.
I rewrote the previous chart to update it by touching the Fibonacci ratio range of 1.902 (101875.70) ~ 2 (106275.10).
(Previous BTCUSD 12M chart)
Looking at the big picture, it seems to have been maintaining an upward trend following a pattern since 2015.
In other words, it is a pattern that maintains a 3-year upward trend and faces a 1-year downward trend.
Accordingly, the upward trend is expected to continue until 2025.
-
(Current BTCUSD 12M chart)
Based on the currently written Fibonacci ratio, it is displayed up to 3.618 (178910.15).
It is expected that it will not fall again below the Fibonacci ratio of 0.618 (44234.54).
(BTCUSDT 12M chart)
Based on the BTCUSDT chart, I think it is around 42283.58.
-
I will explain it again with the BTCUSD chart.
The Fibonacci ratio ranges marked in the green boxes, 1.902 (101875.70) ~ 2 (106275.10) and 3 (151166.97) ~ 3.14 (157451.83), are expected to be important support and resistance ranges.
In other words, it seems likely that they will act as volume profile ranges.
Therefore, in order to break through these ranges upward, I think the point to watch is whether they can receive support and rise near the Fibonacci ratios of 1.618 (89126.41) and 2.618 (134018.28).
Therefore, the maximum rising range in 2025 is expected to be the 3 (151166.97) ~ 3.14 (157451.83) range.
In order to do that, we need to see if it is supported and rises near 2.618 (134018.28).
If it falls after the bull market in 2025, we don't know how far it will fall, but based on the previous decline, we expect it to fall by about -60% to -70%.
Therefore, if it starts to fall near the Fibonacci ratio 3.14 (157451.83), it seems likely that it will fall to around Fibonacci 0.618 (44234.54).
I will explain more details when the bear market starts.
------------------------------------------------------

LINK Trade Setup – Pullback to SupportLINK has made a solid move from ~$10 to $15 over the past couple of weeks. With that rally showing signs of slowing, a pullback into support presents a potential opportunity to catch the next leg up.
📍 Entry Zone:
$13.00 – $14.00
🎯 Take Profit Targets:
🥇 $15.00 – $16.00
🥈 $17.00 – $18.00
🥉 $19.50 – $20.50
🛑 Stop Loss:
Just below $12.00

LINK/USDT Potential UpsidesHey Traders, in today's trading session we are monitoring LINK for a buying opportunity around 14.6 zone, LINK/USDT is trading in an uptrend and currently is in a correction phase in which it is approaching the trend at 14.6 support and resistance area.
Trade safe, Joe.

LINK’s Swing Setup Could Push Past $15LINK bounced right off the $10 mark, charging upward toward the monthly open before slamming into resistance around $13.25. But now what?
Let’s break it down — because the next high-probability setup is taking shape, and it’s one you don’t want to miss.
The Current Situation:
LINK is:
Below the Point of Control (POC) of this trading range (~$11.35).
Below the monthly open at $13.5.
Still in a bearish trend on the 4H, showing lower highs.
Facing decent rejection from the monthly level.
We’re currently trading below the weekly open at $12.62, now sitting right on the Value Area Low (VAL) at $12.36. That puts us in a precarious spot and sets the stage for the next move.
Bearish, bearish, bearish. When bullish sir? Staying patient and waiting for a real shift in market structure is key.
The Bearish Play: Liquidity Grab Incoming?
There’s a liquidity pocket waiting below at $11.68, the most recent swing low. If LINK loses VAL and bearish pressure kicks in, this becomes the next logical target.
But here's where things get interesting...
The Bullish Setup: Confluence-Backed Long Opportunity
This isn’t just any random support zone — there’s a perfect confluence stack forming:
Swing low: $11.68
Daily support level: $11.45
Weekly support level: $11.28
POC of trading range: ~$11.35
0.618 Fibonacci retracement lands in this zone as well
That’s four layers of support in one tight cluster. This is where we want to scale into longs.
The Play: Scaling In
Entry: Ladder long positions from $11.68 down to the 0.786 fib (near $11.2)
Stop Loss: Below $10.35 for invalidation
Target: 0.786 fib retracement of the previous downward wave at ~$14.5
R:R: Approx. 3:1, with a potential +30% gain
The trend remains bearish but the chart is setting up a prime reversal zone. Patience is key here.
🔔 Set alerts. Watch for volume spikes. Look for SFPs or bullish engulfing candles etc.
The next move on LINK could offer one of the best swing setups especially since this trade could extend past the $15 mark, putting you ahead of the curve.
💬 Found this helpful? Drop a like and comment below. Want TA on another coin? Let me know and I’ll break it down for you.
Happy trading everyone! 💪

#LINK/USDT
#LINK
The price is moving within a descending channel on the 1-hour frame, adhering well to it, and is heading for a strong breakout and retest.
We are seeing a bounce from the lower boundary of the descending channel, which is support at 12.84.
We have a downtrend on the RSI indicator that is about to break and retest, supporting the upward trend.
We are looking for stability above the 100 Moving Average.
Entry price: 13.33
First target: 13.58
Second target: 13.83
Third target: 14.20

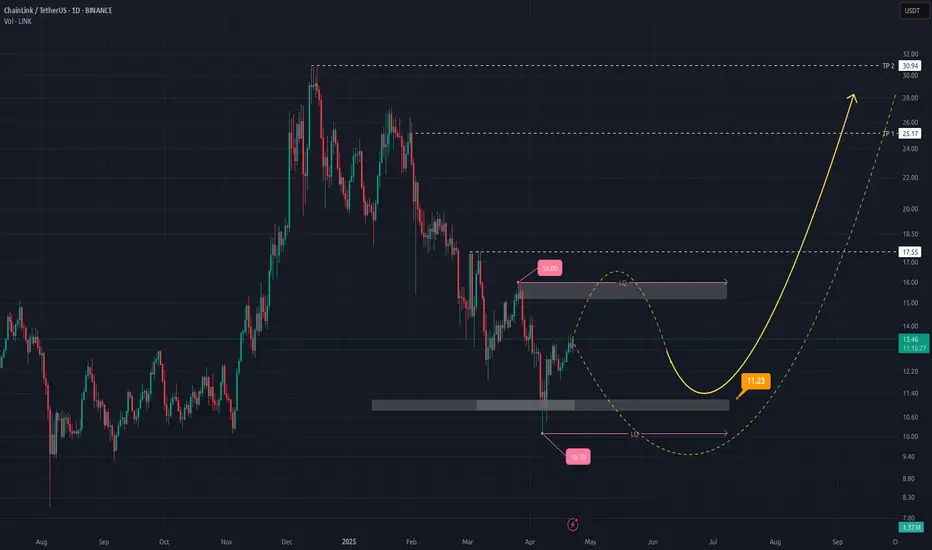
ChainLink (LINK/USD): A Bullish Breakout on the Horizon?Hey there, traders! Let’s take a closer look at ChainLink (LINK/USD) on the daily chart. There’s some interesting action that might point to a bullish move, but let’s break it down with a bit of caution to see if the stars are truly aligning.
Price Action
After a consistent downtrend, we’re seeing a potential shift at $11.23. There’s a bullish reversal candle showing up here, which could suggest buyers are stepping in at this key support level. It looks promising, but we’ll need more confirmation to be sure this is a real trend change.
Volume
The volume at this reversal point is picking up, which is a good sign—those bars are taller than the recent average. This might mean stronger buying interest, but it’s not a massive spike, so I’d keep an eye on whether this volume trend continues to support the move.
Pattern
Looking at the bigger picture, it seems like a cup-and-handle pattern could be forming. The price has rounded out (the “cup”) and is now consolidating (the “handle”). If LINK can break above the $16.00 resistance, we might see a bullish breakout—but this pattern isn’t fully confirmed yet, so let’s stay alert.
Potential Targets
If we do get that breakout, here’s what we might aim for:
TP1: $24.17 – A possible first target.
TP2: $30.04 – Could happen if momentum builds.
TP3: $32.00 – A stretch goal, but only if the bulls really take charge.
Key Support
The $11.23 support is our critical level to watch. If the price drops below this, the bullish setup could be in trouble, so let’s not get too ahead of ourselves.
Wrap-Up
We’ve got a reversal candle, some increased volume, and what might be a cup-and-handle pattern forming, so LINK could be setting up for a bullish move. But it’s not a done deal yet—breaking above $16.00 will be the real test. If you’re thinking of jumping in, set a stop-loss below $11.23 and manage your risk carefully. What do you think—could this be the start of something big? Let’s watch and see! Happy trading! 🚀
LINKUSDT 1D AnalysisLINK ~ 1D Analysis
#LINK Buy after successfully penetrating this resistant line with a short -term target of at least 10%+.

Chainlink Next Target $43, A 222% Profits Potential RiseChainlink is starting to recover. After producing a long-term higher low, it is now trading at the highest price on a rise since November 2024.
The entire consolidation range of late 2024 has been left behind. LINKUSDT remained within these levels for two weeks and is now finally trading above it. Bullish territory for sure.
Now, Chainlink has been producing higher highs and higher lows both based on candle wick and candle close, this leaves room for no doubt as to where prices are going next.
When looking at some of the other pairs, with lower highs and lower lows, we have to find supporting signals that predict additional growth. Like high trading volume being a good example.
Here we do not need to look for these signals as the trend is clearly identifiable. It means that Chainlink is strong in relation to many other pairs.
A strong chart, a strong pair can produce a strong All-Time High when the time comes.
Say the $43 target is only a mid-term one, within the next 1-3 months, but there will be more.
The 2025 bull market is likely to go until late 2025 or even beyond, early 2026. With this in mind, the target shown on the chart can be considered easy, this is only the first step.
After this target is reached, we are likely to see a correction, a mild one, followed by additional growth. We will adapt to the market if conditions change.
The most important part is to buy when prices are low, in this way, we can hold easily when strong shakeouts and retraces develop out of nowhere. We are going up.
This is a good pair, a good project, a great chart. Buy and hold.
Namaste.

LINK/USDT 8H - targets and stoplossHello everyone, let's look at the 8h chart LINK to USDT, in this situation we can see how the price has come out on top from the local downtrend line and how it is currently moving in a local sideways trend.
Let's start by defining the targets for the near future that the price has to face:
T1 = 12.65 USD
T2 = 13.13 USD
Т3 = 13.87 USD
Т4 = 14.40 USD
Now let's move on to the stop-loss in case the market continues to fall:
SL1 = 11.91 USD
SL2 = 11.05 USD
SL3 = 10.36 USD
SL4 = 9.66 USD
The MACD indicator shows an attempt to return to the uptrend, but here we can see a struggle that gives a sideways trend on the chart.
