LINK/USDT 8H - targets and stoplossHello everyone, let's look at the 8h chart LINK to USDT, in this situation we can see how the price has come out on top from the local downtrend line and how it is currently moving in a local sideways trend.
Let's start by defining the targets for the near future that the price has to face:
T1 = 12.65 USD
T2 = 13.13 USD
Т3 = 13.87 USD
Т4 = 14.40 USD
Now let's move on to the stop-loss in case the market continues to fall:
SL1 = 11.91 USD
SL2 = 11.05 USD
SL3 = 10.36 USD
SL4 = 9.66 USD
The MACD indicator shows an attempt to return to the uptrend, but here we can see a struggle that gives a sideways trend on the chart.
LINKUSDT

Trading opportunity for LINKUSDTBased on technical factors there is a Sell position in :
📊 LINKUSDT
🔴 Sell Now
🪫Stop loss 14.25
🔋Target 9.70
📏 R/R 1,5
💸RISK : 1%
We hope it is profitable for you ❤️
Please support our activity with your likes👍 and comments📝

MDTUSDT UPDATEMDT/USDT Technical Setup
Pattern: Falling Wedge Breakout
Current Price: $0.02544
Target Price: $0.0586
Target % Gain: 150.48%
Technical Analysis: MDT has broken out of a falling wedge on the 1D chart with a strong bullish candle and an 11.82% daily gain, confirming momentum. Breakout volume and candle close above resistance support further upside.
Time Frame: 1D
Risk Management Tip: Always use proper risk management.

Potential Bullish Reversal Setup in LINK/USDTThe LINK/USDT pair recently experienced a false breakdown below the March low, followed by a strong recovery. This move appeared to be a liquidity grab beneath the psychological support level at 10.00, after which the market quickly reversed direction.
In addition, the price action broke and closed above a descending trendline, which had previously signalled a corrective phase. Notably, the market also revisited a demand zone—an area where a major price rally originated in November 2024.
If the price retraces back toward the support level near the trendline, historical behaviour suggests the potential for another upward move. This confluence of a false breakdown, a trendline breakout, and a revisit to a key demand zone points to a possible bullish reversal, provided the support continues to hold. The next significant resistance level is identified around 14.80

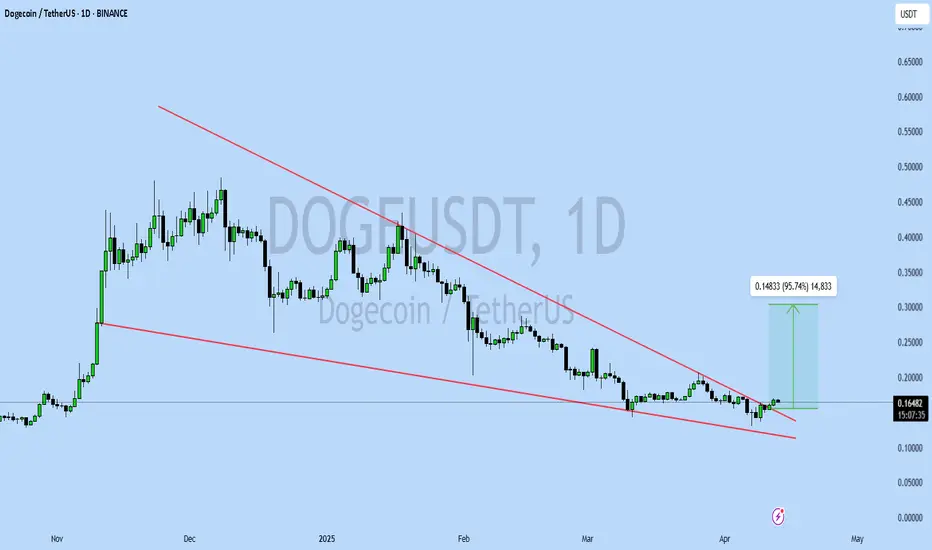
DOGEUSDT UPDATEDOGEUSDT is a cryptocurrency trading at $0.16485, with a target price of $0.30000. This represents a potential gain of over 90%. The technical pattern observed is a Bullish Falling Wedge, indicating a possible trend reversal. This pattern suggests that the downward trend may be coming to an end. A breakout from the wedge could lead to a significant upward movement in price. The Bullish Falling Wedge is a positive indicator, signaling a potential price surge. Investors are showing optimism about DOGEUSDT's future performance. The current price may present a buying opportunity. Reaching the target price would result in substantial returns for investors. DOGEUSDT is positioned for a potential breakout and significant gains.
SEIUSDT UPDATESEIUSDT is a cryptocurrency trading at $0.1700, with a target price of $0.4500. This represents a potential gain of over 200%. The technical pattern observed is a Bullish Falling Wedge, indicating a possible trend reversal. This pattern suggests that the downward trend may be coming to an end. A breakout from the wedge could lead to a significant upward movement in price. The Bullish Falling Wedge is a positive indicator, signaling a potential price surge. Investors are showing optimism about SEIUSDT's future performance. The current price may present a buying opportunity. Reaching the target price would result in substantial returns for investors. SEIUSDT is positioned for a potential breakout and significant gains.

SECRET Indicator Says LINK Will Moon🚨MartyBoots here , I have been trading for 17 years and sharing my thoughts on BINANCE:LINKUSDT here.🚨
.
🚨 BINANCE:LINKUSDT is looking beautiful , very interesting chart for more upside
and is now into support🚨
Do not miss out on BINANCE:LINKUSDT as this is a great opportunity
The SECRET Indicator says it will moon
Watch video for more details

TAOUSDT UPDATETAOUSDT is a cryptocurrency trading at $231.9, with a target price of $360.0. This represents a potential gain of over 60%. The technical pattern observed is a Bullish Falling Wedge, indicating a possible trend reversal. This pattern suggests that the downward trend may be coming to an end. A breakout from the wedge could lead to a significant upward movement in price. The Bullish Falling Wedge is a positive indicator, signaling a potential price surge. Investors are showing optimism about TAOUSDT's future performance. The current price may present a buying opportunity. Reaching the target price would result in substantial returns for investors. TAOUSDT is positioned for a potential breakout and significant gains.

Chainlink: Your Altcoin ChoiceI was about to call it quits for today but several people requested an analysis for LINK, so here it is.
Oh, by the way, I like Chainlink also and tend to publish many updates. Just lately I was out but now I am back healthy and with full force.
There are two main dynamics playing out on this chart that are of interest to us:
1) A perfect falling wedge pattern. This pattern is a classic reversal signal and one of the most accurate. It simply works.
2) A long-term support/accumulation zone. The falling wedge is enough to predict a reversal, but the action just entered the late 2024 buy zone and long-term support. This makes it even stronger.
I am sure we have positive signals coming also from the MACD and RSI.
This chart is based on the long-term. Again, if you would like to find the 2025 ATH for this or any other pair, just go to my profile by typing on my username and search for the pairs name. In this case, LINKUSDT, you will find many publications that are still good and valid when it comes to the numbers and ATH potential. I published many in 2024 and some even in 2023.
Now, the apex of the falling wedge is a higher low compared to the bottom in August 2024. This is good and works to support the other signals.
Trading volume is very low on the drop and this is also very good for the bulls. The market is on autopilot. It is dropping just because it needs to drop. Bot selling. Bot selling ends when real buying starts. We are about to experience a massive influx of money into the market.
Now, money is already "programmed." The exchanges already have the whales money. Money has been moving around for months now and the entire game is already setup. The start of the next bullish cycle has been programmed, you know everything works with algorithms and bots. The big players pay the exchanges and the exchanges take care of the rest. The only way for small players like us to win is by playing the long-term game. If we play short-term, we get killed because we are looking for 20-30% or more, while the whales can profit with 1-2%. While we try to complete a trade, they shake us out over and over, again and again. So instead of fighting the whales we use a strategy that works. We wait for the market bottom, when the market hits bottom or is close to the bottom, near support, we buy and hold.
We then just wait and let the bullish cycle unfold. When everything is up, we collect profits and move on.
There is also a play to short the market after the end of the bullish phase. I also play this hand and give guidance to my followers and traders, but this is far away.
Right now your only concern should be buying, buying like the world is about to end. Why? Because once the market starts moving there is no going back; once great entry prices are gone, they are gone forever.
The time is now.
Chainlink is good and trading near long-term support.
Buy when prices are low, it will soon start to grow.
It can take weeks or days, but it won't be long. The next bullish cycle should last between 6-8 months. It can expand at last 12 months or more. We will have to see about this part because market conditions are so different now, who knows if we will enter a 10 years strong/long bull market cycle, it is possible, just like it happened with stocks. But we can only prepare based on what we know, and what we know is that most of the market will grow really strong. If it gets better, great. If the bull market ends up being a standard one, this would still be awesome.
Thanks a lot for your continued support.
Namaste.

LINK Long Spot Trade Setup – Major Support TestLINK has retraced sharply and is now sitting at a critical support zone ($10.00–$11.00), historically a strong base for reversals. This offers a solid risk/reward opportunity for a potential bounce and test of upper resistance zones.
📌 Trade Setup:
Entry Zone: $10.00 – $11.00
Take Profit Targets:
🥇 $17.00 – $17.70
🥈 $21.70 – $22.40
Stop Loss: Around $8.80

ATOMUSDT UPDATEATOMUSDT is a cryptocurrency trading at $4.700, with a target price of $7.500. This represents a potential gain of over 60%. The technical pattern observed is a Bullish Falling Wedge, indicating a possible trend reversal. This pattern suggests that the downward trend may be coming to an end. A breakout from the wedge could lead to a significant upward movement in price. The Bullish Falling Wedge is a positive indicator, signaling a potential price surge. Investors are showing optimism about ATOMUSDT's future performance. The current price may present a buying opportunity. Reaching the target price would result in substantial returns for investors. ATOMUSDT is positioned for a potential breakout and significant gains.

CFXUSDT UPDATECFXUSDT is a cryptocurrency trading at $0.0788, with a target price of $0.1400. This represents a potential gain of over 80%. The technical pattern observed is a Bullish Falling Wedge, indicating a possible trend reversal. This pattern suggests that the downward trend may be coming to an end. A breakout from the wedge could lead to a significant upward movement in price. The Bullish Falling Wedge is a positive indicator, signaling a potential price surge. Investors are showing optimism about CFXUSDT's future performance. The current price may present a buying opportunity. Reaching the target price would result in substantial returns for investors. CFXUSDT is positioned for a potential breakout and significant gains.


LONG Position LINK/USDT#Singal
LINK/USDT
🟢 LONG Position
🎲 Entry1 @ 12.47
✅ Target1@ 13.62
✅ Target2 @ 15.54
✅ Target3 @ 18.87
✅ Target4 @ 23.98
✅ Target5 @ 30.25
❌ Stop Loss @ 9.69
Leverage: 5X
Margin: 5% of Wallet Balance
⚠️"Take Care of Risk Management for Your Account"

Short Position LINK/USDT#Singal
LINK/USDT
🔴 Short Position
🎲 Entry @ 14.00
✅ Target1@ 13.90
✅ Target2 @ 13.75
✅ Target3 @ 13.51
✅ Target4 @ 13.25
✅ Target5 @ 12.97
❌ Stop Loss @ 14.55
Leverage: 5X_15X
Margin: 10% of Wallet Balance
⚠️"Take Care of Risk Management for Your Account"

Chainlink $LINK to 17$?⚠️ RISK TRADE ⚠️
👑 #LINK/USDT BUY 👑
Entry price:
13.76 - 14.17 🟩
Targets:
1️⃣14.62🎯
2️⃣15.24🎯
3️⃣16.04🎯
4️⃣17.05🎯

Chainlink LINK price analysisThe 6-year trend line has been keeping the #LINK price “in play” by 4 times
The next is patience and observation.
🆗 As long as the OKX:LINKUSDT price is above the blue trend line, then the medium-term targets of $38 and $53 are still relevant.
_____________________
Did you like our analysis? Leave a comment, like, and follow to get more

LINK/USDT: Strong Momentum Points to Higher TargetsThe LINK/USDT pair has shown strong bullish momentum on the 1-hour timeframe, breaking above both the 15.00 level and a downward trendline. On the daily chart, four consecutive bullish candles reflect persistent buying pressure.
Recent movements suggest an ABC pattern is unfolding, hinting at a potential push toward the 17.00 resistance level. With momentum building, the market may soon test this zone, barring any negative news that could prompt a sell-off. A pullback may occur short term, but the overall outlook remains bullish, with a mid-term target at the resistance zone around 16.45

LINKLINK
March 26, 2025
8:02 AM
CRYPTOCAP:LINK just had a clean bounce off the +W OB (not a full-on impulsive move, but definitely a solid reaction)
Also, the MA100 and MA200 are forming a golden cross on both weekly and 4H TF — pretty bullish signal overall.
Looks like we’re setting up for W3. Right now, we’re in W2 and potentially about to enter W3 of W3, which is usually the strongest leg.

LINK Trade Setup - Higher Low ConfirmationLINK is showing early signs of reversal from a key higher timeframe support zone. We anticipate a short-term dip into the buy zone before shifting into an expansion phase.
🛠 Trade Details:
Entry: $13 – $14 (Buy Zone)
Take Profit Targets:
$17.00 - $17.70 (Initial Resistance)
$21.70 - $22.40 (Breakout Target)
Stop Loss: Daily close below $12
Looking for higher low confirmation before the move up. 📈🚀

Link: Possible buying opportunity Link find support at 78.60% fib level. We can find similar pattern in previous impulse move. There is highly likely that Link will take off from here all the way to $30.

LINK 1H LINK possible path has been drawn
a bit set back and then going even higher is possible
BINANCE:LINKUSDT
𓄀𝓈𝓉𝒶𝓎 𝓉𝓊𝓃ℯ𝒹 𓃓

The key is whether it can be supported around 15.45
Hello, traders.
If you "Follow", you can always get new information quickly.
Please click "Boost" as well.
Have a nice day today.
-------------------------------------
(LINKUSDT 1D chart)
How to interpret the OBV indicator
1. If OBV is rising from the 0 point, it is interpreted as an increase in buying power, and if it is falling, it is interpreted as an increase in selling power
2. How to create an EMA indicator for OBV and interpret it as rising or falling above the EMA indicator
3. How to add the price channel formula to the OBV indicator and interpret it like Bollinger Bands
-
If the price is maintained at the current price position, it is expected to attempt to rise above 15.45.
However, since the StochRSI indicator is showing a downward trend in the overbought zone, the key point is whether there is support near 15.45.
If it fails to rise, we should check whether there is support near 13.13.
-
I think we are facing a golden opportunity to turn into an upward trend.
If it fails to turn into an upward trend this time, there is a possibility that it will eventually fall to around 10.0, so we should think about a response plan for this.
Therefore, what we should pay close attention to is whether there is support near 15.45 and it can rise.
If support is confirmed near 15.45, it is the time to buy.
The first sell zone is 19.52-20.51.
-
Thank you for reading to the end.
I hope you have a successful transaction.
--------------------------------------------------
- Big picture
I used TradingView's INDEX chart to check the entire range of BTC.
(BTCUSD 12M chart)
Looking at the big picture, it seems to have been maintaining an upward trend following a pattern since 2015.
In other words, it is a pattern that maintains a 3-year upward trend and faces a 1-year downward trend.
Accordingly, the upward trend is expected to continue until 2025.
-
(LOG chart)
Looking at the LOG chart, you can see that the upward trend is decreasing.
Accordingly, the 46K-48K range is expected to be a very important support and resistance range from a long-term perspective.
Therefore, I expect that we will not see prices below 44K-48K in the future.
-
The Fibonacci ratio on the left is the Fibonacci ratio of the uptrend that started in 2015.
That is, the Fibonacci ratio of the first wave of the uptrend.
The Fibonacci ratio on the right is the Fibonacci ratio of the uptrend that started in 2019.
Therefore, this Fibonacci ratio is expected to be used until 2026.
-
No matter what anyone says, the chart has already been created and is already moving.
It is up to you how to view and respond to it.
Since there is no support or resistance point when the ATH is updated, the Fibonacci ratio can be appropriately utilized.
However, although the Fibonacci ratio is useful for chart analysis, it is ambiguous to use it as a support and resistance role.
The reason is that the user must directly select the important selection points required to create the Fibonacci.
Therefore, it can be useful for chart analysis because it is expressed differently depending on how the user specifies the selection point, but it can be seen as ambiguous for use in trading strategies.
1st: 44234.54
2nd: 61383.23
3rd: 89126.41
101875.70-106275.10 (when overshooting)
4th: 134018.28
151166.97-157451.83 (when overshooting)
5th: 178910.15
-----------------
