ETH - Log long Chart!Hello TradingView Family / Fellow Traders. This is Richard, also known as theSignalyst.
Let’s keep it simple! ⚡
📈 ETH is approaching a major structure and potential rejection zone marked in blue.
As long as this key support holds, the long-term bullish bias remains intact.
It’s only a matter of time before the bulls step in — confirmation will come from lower timeframes. 👀
📚 Always follow your trading plan regarding entry, risk management, and trade management.
Good luck!
All Strategies Are Good; If Managed Properly!
~Rich
LONG

ATOMUSDT Breakout And Potential RetraceHey Traders!
In today's session, we're keeping a close eye on ATOMUSDT as it presents a potential buying opportunity around the 4.13000 zone.
After trading in a prolonged downtrend, ATOM has successfully broken out, signaling a possible trend reversal. Right now, the pair is in a correction phase, and it’s approaching a key support/resistance level near the 4.13000 area — a critical retracement zone we’re watching for potential bullish continuation.
Trade safe, Joe.

SOL – Small pullback to then grab the liquidity?This 1H chart of SOLUSDT on Bybit showcases a clean bullish continuation setup after a strong impulsive move upward. The current price action suggests a strategic retracement into a high-probability zone of interest before a potential continuation toward buy-side liquidity.
---
1. Market Structure & Context:
- SOL has shifted market structure to the upside following a strong impulse that broke previous lower highs.
- The current pullback resembles a classic bullish retracement, aligning with smart money concepts where price revisits inefficiencies and discount zones before continuation.
- The low on the retracement appears to be forming a higher low relative to the previous structure.
---
2. Fair Value Gap (FVG) + Golden Pocket Zone:
- The blue box represents a clear Fair Value Gap created during the recent rally — a price imbalance often targeted for entries by institutions.
- Overlaying that zone is the Fibonacci golden pocket (0.618–0.65), a highly reactive retracement area in bullish moves.
- The confluence of FVG and the golden pocket makes this a powerful demand zone, supported by historical order flow behavior.
---
3. Fibonacci Levels & Price Action:
- 0.618–0.65 zone: Ideal entry region during bullish retracements. Price is currently reacting within this band.
- 0.786 level: A deeper retracement level that still supports bullish continuation if respected — though it marks the edge of the current FVG.
- The equilibrium between these levels represents a discount area for accumulation.
---
4. Liquidity Outlook – Buy-Side Liquidity (BSL):
- A clear BSL (Buy-Side Liquidity) sits above the previous local high.
- Price is likely to target this level as the next point of liquidity collection once the retracement completes.
- The green arrowed path shows the anticipated flow: a short-term dip into the FVG before a bullish move to sweep the BSL.
---
5. Trade Narrative:
- This setup reflects an entry based on optimal trade theory — retracement into a zone of inefficiency and discount (FVG + golden pocket).
- Bullish continuation is expected if this zone holds, especially with confluence from market structure and resting liquidity overhead.
- Ideal confirmation may involve lower timeframe bullish breaks of structure inside the FVG.
---
Summary:
SOL is offering a textbook retracement setup on the 1H, with price pulling back into a confluence of a Fair Value Gap and golden pocket (0.618–0.65). If the zone is respected, the next likely destination is the buy-side liquidity resting above previous highs. The reaction within this area will be key to validating the bullish scenario.

Gold Is Forming a Bull Flag : Targeting a New ATH?Hey Traders, in today's trading session we are monitoring XAUUSD for a buying opportunity around 3280 zone, Gold is trading in an uptrend and currently is in a correction phase in which it is approaching the trend at 3280 support and resistance area.
Trade safe, Joe.

3X Levered NAIL: Long Possible SoonMy opinion, one of the best levels to buy soon to be reached with NAIL, 3x levered home builders. Simple strategy, price gets to $21.14 let it fall below the line and then buy it when it breaks above the line. Set first take profit at +320%, remove a third of your position, then do the same at +500%, and 700% for the remaining 2/3's. Set stop to a fixed amount $20. As you can see these trades take a year, sometimes less or longer to develop, but are quite profitable.

BITCOIN Will Go Higher From Support! Buy!
Please, check our technical outlook for BITCOIN.
Time Frame: 9h
Current Trend: Bullish
Sentiment: Oversold (based on 7-period RSI)
Forecast: Bullish
The market is approaching a key horizontal level 84,703.50.
Considering the today's price action, probabilities will be high to see a movement to 88,907.42.
P.S
Please, note that an oversold/overbought condition can last for a long time, and therefore being oversold/overbought doesn't mean a price rally will come soon, or at all.
Disclosure: I am part of Trade Nation's Influencer program and receive a monthly fee for using their TradingView charts in my analysis.
Like and subscribe and comment my ideas if you enjoy them!

CADJPY Will Go Up From Support! Long!
Here is our detailed technical review for CADJPY.
Time Frame: 4h
Current Trend: Bullish
Sentiment: Oversold (based on 7-period RSI)
Forecast: Bullish
The market is on a crucial zone of demand 102.547.
The underlined horizontal cluster clearly indicates a highly probable bullish movement with target 103.850 level.
P.S
The term oversold refers to a condition where an asset has traded lower in price and has the potential for a price bounce.
Overbought refers to market scenarios where the instrument is traded considerably higher than its fair value. Overvaluation is caused by market sentiments when there is positive news.
Disclosure: I am part of Trade Nation's Influencer program and receive a monthly fee for using their TradingView charts in my analysis.
Like and subscribe and comment my ideas if you enjoy them!

GBPNZD Will Go Higher! Buy!
Take a look at our analysis for GBPNZD.
Time Frame: 1D
Current Trend: Bullish
Sentiment: Oversold (based on 7-period RSI)
Forecast: Bullish
The market is on a crucial zone of demand 2.224.
The oversold market condition in a combination with key structure gives us a relatively strong bullish signal with goal 2.266 level.
P.S
We determine oversold/overbought condition with RSI indicator.
When it drops below 30 - the market is considered to be oversold.
When it bounces above 70 - the market is considered to be overbought.
Disclosure: I am part of Trade Nation's Influencer program and receive a monthly fee for using their TradingView charts in my analysis.
Like and subscribe and comment my ideas if you enjoy them!

NZDCAD Will Go Up! Long!
Please, check our technical outlook for NZDCAD.
Time Frame: 1D
Current Trend: Bullish
Sentiment: Oversold (based on 7-period RSI)
Forecast: Bullish
The price is testing a key support 0.825.
Current market trend & oversold RSI makes me think that buyers will push the price. I will anticipate a bullish movement at least to 0.847 level.
P.S
Overbought describes a period of time where there has been a significant and consistent upward move in price over a period of time without much pullback.
Disclosure: I am part of Trade Nation's Influencer program and receive a monthly fee for using their TradingView charts in my analysis.
Like and subscribe and comment my ideas if you enjoy them!

BTC 4H VS 1D 200 EMAIt's quite a rare occurrence when the 200 EMA finds itself in a very similar position but right now BTC has that exact setup.
On the 4H BTC is fighting the moving average for the 12th time since losing the support level at the beginning in February. At this time the bearish trend channel upper limit also coincides with this level now, IMO a big move is being setup, but the direction is unsure.
On the daily we're seeing the moving average also in line with the trend resistance however the curve itself differs to the 4H in the way that it's levelling out from an uptrend, not levelling out from downtrend.
Bullish scenario - Breaking out above the moving average and trend channel with strength I believe would start to bring buyers back. Now I would not expect buyers to come flooding in at once as many have been burned too many times trying to long a breakout only for it to be a fakeout. I could see many looking for a form of confirmation, be that a retest as new support or a new HH & HL structure.
Bearish scenario - Yet another rejection off this level would be continuation of the downtrend with many adding to their shorts. This to me would be tied to the SPX/ Tradfi movements although those markets are much stronger than this time last week.
In conclusion there is no clear sense of direction just yet but I think it's coming very soon. The chop we are seeing at the moment is a symptom of a lack of confidence and uncertainty in market conditions. Naturally this lends itself to a continuation of the downtrend but all it takes is a catalyst and some big believers to push BTC out above the downtrend to continue the bullrun. I think we get our answer soon.


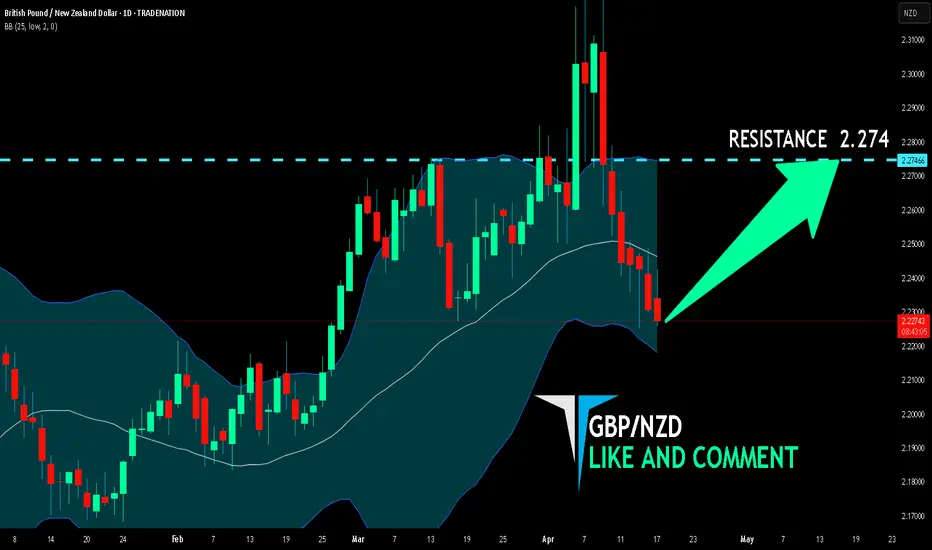
GBP/NZD BULLS ARE STRONG HERE|LONG
Hello, Friends!
GBP/NZD is making a bearish pullback on the 1D TF and is nearing the support line below while we are generally bullish biased on the pair due to our previous 1W candle analysis, thus making a trend-following long a good option for us with the target being the 2.274 level.
Disclosure: I am part of Trade Nation's Influencer program and receive a monthly fee for using their TradingView charts in my analysis.
✅LIKE AND COMMENT MY IDEAS✅
NIFTY 50 4hr analysis (bullish) (16/04/2025)Welcome back folks
havent been posting lately because of the hectic schedule,
the analysis is based majorly on the current emotions of the speculators that is relief bullish rally
- possible gap up tomorrow, if market makers decide to book profits tomorrow then its blood bath again imo
- either a follow up range or breakout above marked figures in the chart is expected
- i personally believe to not overthink this and be a part of the crowd and hope for the latter
trade cautiously, i wont be posting index charts anytime soon now, only stocks if schedule allows me
feel free to chat with me in the comments

GOLD: Long Signal with Entry/SL/TP
GOLD
-Classic bullish formation
- Our team expects growth
SUGGESTED TRADE:
Swing Trade
Buy GOLD
Entry Level - 3324.4
Sl - 3316.8
Tp - 3338.3
Our Risk - 1%
Start protection of your profits from lower levels
Disclosure: I am part of Trade Nation's Influencer program and receive a monthly fee for using their TradingView charts in my analysis.
❤️ Please, support our work with like & comment! ❤️

AUDNZD Trading Opportunity! BUY!
My dear friends,
AUDNZD looks like it will make a good move, and here are the details:
The market is trading on 1.0718 pivot level.
Bias - Bullish
Technical Indicators: Supper Trend generates a clear long signal while Pivot Point HL is currently determining the overall Bullish trend of the market.
Goal - 1.0781
About Used Indicators:
Pivot points are a great way to identify areas of support and resistance, but they work best when combined with other kinds of technical analysis
Disclosure: I am part of Trade Nation's Influencer program and receive a monthly fee for using their TradingView charts in my analysis.
———————————
WISH YOU ALL LUCK

USDJPY / 1 DAY / BULLHello Guys;
My USDJPY target level is 147,500.
My target may come a bit late because this trade is a swing trade.
I would appreciate it very much if you do not miss your likes within the framework of Respect for Labor Thank you very much in advance

ETH idea for longSo we have EQH, now we are in month bisi, have two patten
1. AMD, we are wait manipulation and break structure for long unicorn stetup
2. without manipulation this mean need search SMT with bct and wait 4h bisi
I hear Trump invest buy eth on 200m usd, this good point for long term position

Is This The End of Pullback?BINANCE:SUPERUSDT has entered the support zone between 0.5142 – 0.4754 after a strong impulsive move to the upside.
This support zone is considered valid due to multiple rejections that occurred within this area in the past—indicating strong buyer interest.
Ideally, this is where we expect price to bounce and resume the bullish trend. The first sign of confirmation would be a break above 0.5272, which may open the path toward higher targets.
However, the bullish scenario remains valid only if the price stays above 0.4983—a key invalidation level.
Note:
If this level is breached before a clear candlestick confirmation, the candle pattern being used to validate the move becomes invalid.
Even if the price breaks below the invalidation level, as long as it remains within the support zone, the support is still valid — but it would require the formation of a new bullish candlestick pattern to re-confirm the potential for an upward move.

Will This Descending Wedge Push HYPE to 22.5?If we take a closer look at the price structure, the orange and blue arrows show that BITGET:HYPEUSDT is in an overall uptrend. Meanwhile, the white arrow represents a minor pullback—just a ripple within the bigger trend.
When we connect the orange to the white, and then the white to the blue arrow, we can spot a descending broadening wedge formation. Given the current bullish structure, this pattern is more likely acting as a continuation rather than a reversal.
After the pattern is completed, the key level to watch is the resistance around 16.62, which comes from the white arrow's high. This level will decide whether price can break through and continue its bullish momentum toward the target zone at 20.52 – 22.55, or if sellers will step in and cause a rejection.
In case of a rejection, we might see some sideways movement as the market consolidates before making the next move.

GBPUSD Potential UpsidesHey Traders, in today's trading session we are monitoring GBPUSD for a buying opportunity around 1.32300 zone, GBPUSD is trading in an uptrend and currently is in a correction phase in which it is approaching the trend at 1.32300 support and resistance area.
Trade safe, Joe.

Euro may correct to support area and then continue to growHello traders, I want share with you my opinion about Euro. The price started its movement inside a tight upward channel, gradually rising from lower levels. After a steady climb, the Euro broke out of the channel with a strong impulse, entering a buyer zone between 1.0870 - 1.0910 points. This zone acted as a strong base, and from there, the pair accelerated upward, eventually reaching the upper boundary of a wide horizontal range. After multiple rejections near the range’s top, the pair finally made a breakout and exited above resistance, confirming the shift in momentum. The growth didn’t stop there - price continued its rally, reaching the current support area between 1.1320 - 1.1280 points, which now aligns with a strong horizontal level at 1.1280 points. This area was successfully retested and defended by buyers. Currently, the price is consolidating slightly above this support, forming a local correction after the recent impulse. As long as this structure holds and the support area remains intact, the bullish pressure is likely to resume. Given the breakout, the strong base from the buyer zone, and the bullish market structure, I expect the Euro to continue growing toward the 1.1550 level, which is marked as my current TP1. Please share this idea with your friends and click Boost 🚀

USDJPY Will Explode! BUY!
My dear followers,
This is my opinion on the USDJPY next move:
The asset is approaching an important pivot point 142.79
Bias - Bullish
Technical Indicators: Supper Trend generates a clear long signal while Pivot Point HL is currently determining the overall Bullish trend of the market.
Goal - 143.26
About Used Indicators:
For more efficient signals, super-trend is used in combination with other indicators like Pivot Points.
Disclosure: I am part of Trade Nation's Influencer program and receive a monthly fee for using their TradingView charts in my analysis.
———————————
WISH YOU ALL LUCK

EURNZD Set To Grow! BUY!
My dear friends,
EURNZD looks like it will make a good move, and here are the details:
The market is trading on 1.9177 pivot level.
Bias -Bullish
Technical Indicators: Supper Trend generates a clear long signal while Pivot Point HL is currently determining the overall Bullish trend of the market.
Goal - 1.9461
Recommended Stop Loss - 1.9017
About Used Indicators:
Pivot points are a great way to identify areas of support and resistance, but they work best when combined with other kinds of technical analysis
Disclosure: I am part of Trade Nation's Influencer program and receive a monthly fee for using their TradingView charts in my analysis.
———————————
WISH YOU ALL LUCK
